
Dynamic Logging with Rookout & Dynatrace
The only thing better than one awesome (and extremely useful!) tech tool is integration with another similarly great tool. That’s why we’ve been working on building up our collection of new integrations because our main goal, always, is to make developers’ lives easier. And we do that by allowing you to immediately get all the live data you need from Rookout straight to your favorite tool.
And the next step in doing so? Adding integration with one of the biggest names in observability and monitoring today: Dynatrace. As a pair, Rookout and Dynatrace are a dynamic logging duo that really brings your code visibility up a notch.

We’re excited about adding Dynatrace to our integration collection.
Dynatrace provides infrastructure and application monitoring with a number of features like DevSecOps automation, hybrid cloud observability, and business analytics just to name a few. Using logs, metrics, and traces, Dynatrace provides data ranging from code-level detail to UX data. The platform is designed to be “answer-centric,” as it focuses on drawing context-based conclusions from all the data it collects.
Integrating Debugging and Observability
The major advantage that this integration gives is that Rookout adds dynamic data to Rookout’s capabilities. With a direct link, Rookout’s debugging data makes an immediate difference for a large amount of info in your Dynatrace account.
Data from Dynatrace logging feeds into Rookout. Without any extra instrumentation, Rookout can then surface the relevant code based on Dynatrace logs, where you would add our non-breaking breakpoints to the code as reflected in the Rookout app. The data from Rookout syncs automatically with Dynatrace. New logs are immediately sent to your Dynatrace account to be consumed and parsed as other logs would in their UI.
Set Up the Dynatrace-Rookout Integration
Your organization’s admin should manage this. In case you are the admin, here’s how to do it.
Hit the cog in the Rookout UI and go to Targets.
There, add your Dynatrace Tenant ID and Access token.
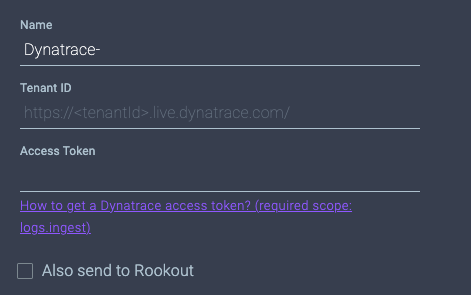
dd your Dynatrace credentials into Rookout
To get the token, go to your Dynatrace account and make sure that token creation is enabled. It will be off by default.
Go to the appropriate page by searching for the Settings page in the left-hand menu. Scroll down to Integrations, hit the down arrow, then select Access Tokens. Finally, scroll back up and you’ll have the option to Enable personal access tokens. See the whole thing here:
Enable personal access tokens in Dynatrace
Settings > Integration > Access Tokens > Enable personal access tokens
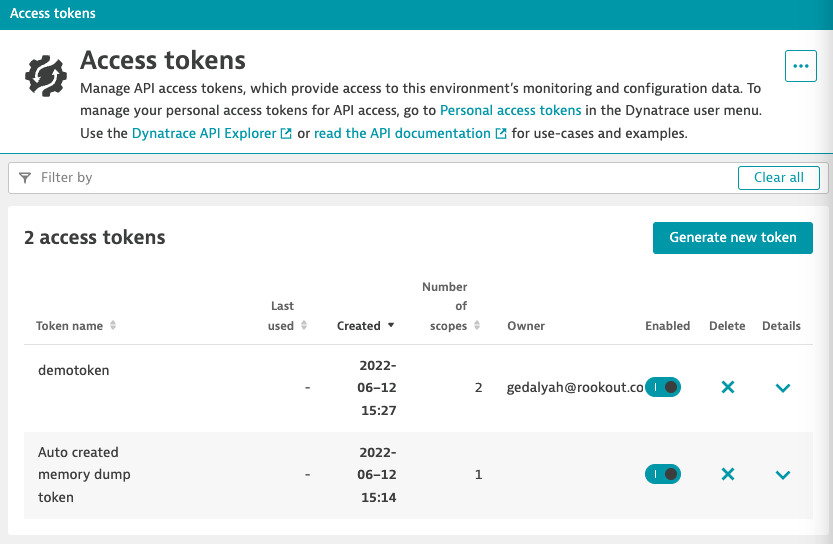
Go back to the separate Access Tokens page (…live.dynatrace.com/ui/access-tokens/…) where you can now hit the Generate the token button to the right of the screen (as seen below).
Finally, return to Rookout and input the token. The Tenant ID will be the URL of your account. Be sure to check the Also send to Rookout box below:
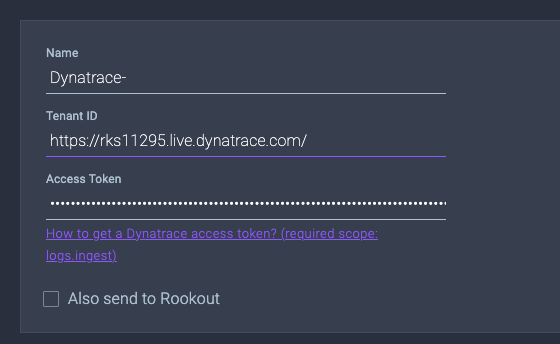
Add your Dynatrace token and tenant ID into Rookout
Your full list of targets will appear afterwards.
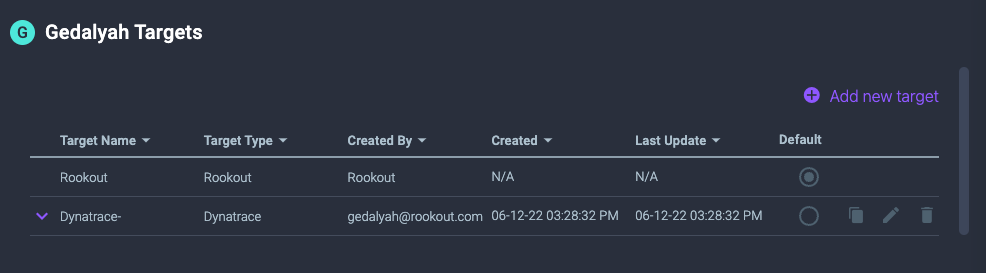
Targets in the Rookout UI
Debug Your Code
Set Your Non-Breaking Breakpoints and Run
Set the target for that breakpoint – or where the data should go – to the Dynatrace account you’ve specified.
Set your non-breaking breakpoints in Rookout
Hit run.
Dynamic Logging: View Your Data
The data will appear in two places. First, check it at the bottom of the Rookout UI.
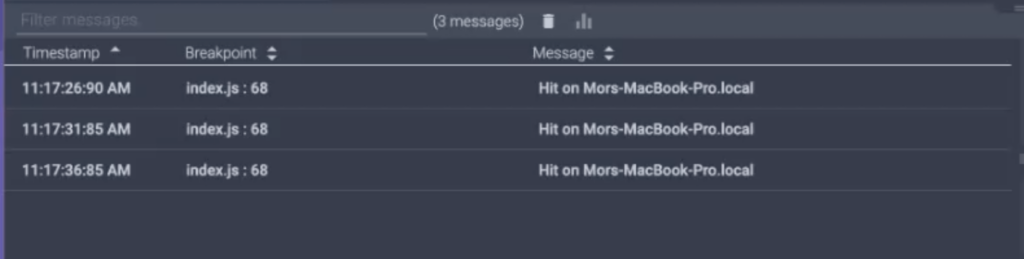
Logs generated by your breakpoints in Rookout
Then, go check that that data has transferred to your Dynatrace account.
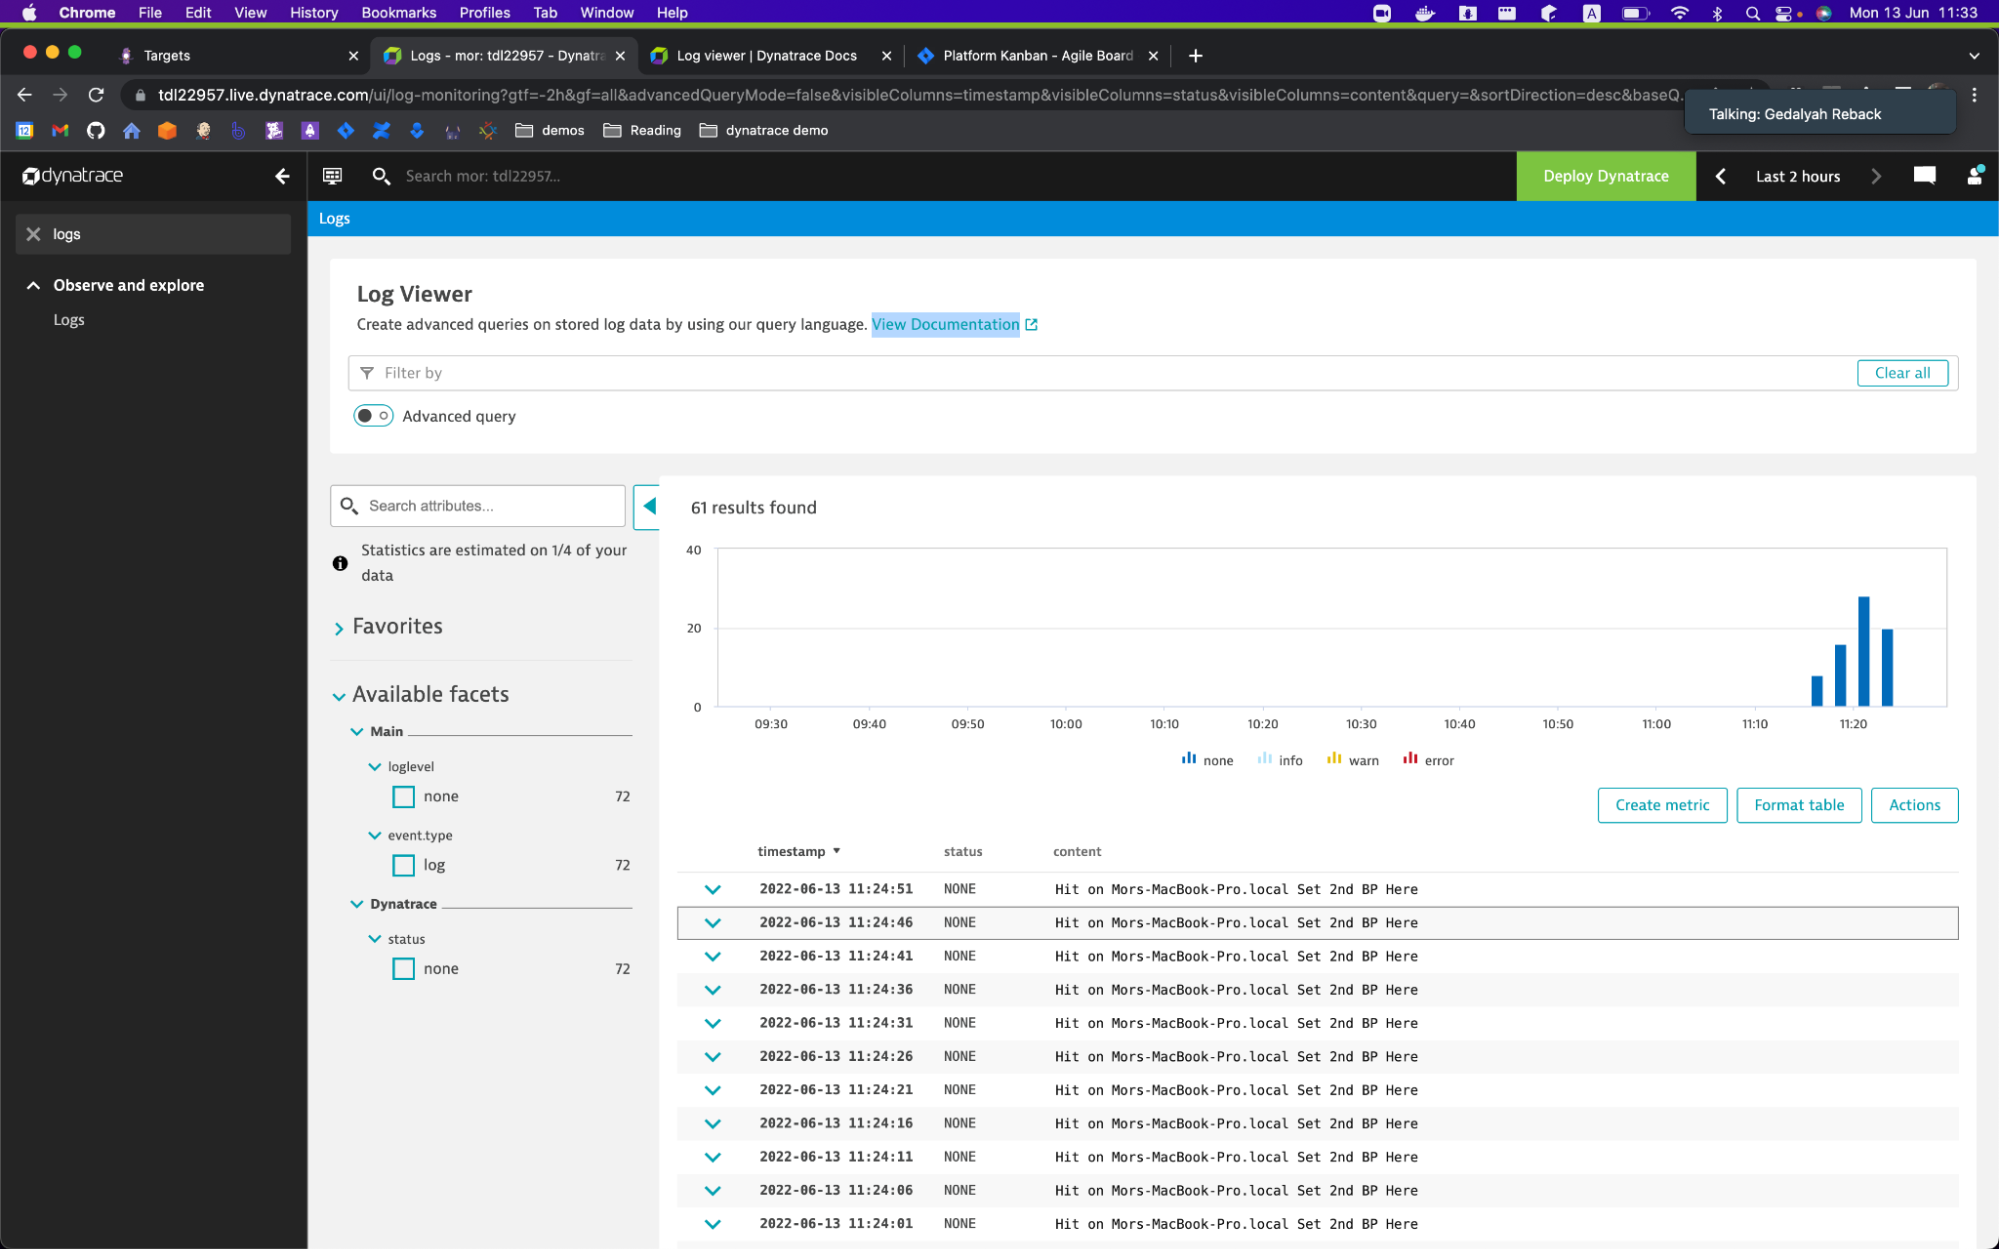
View those same logs from Rookout inside of Dynatrace
Debugging that Reinforces Logging
Logs, metrics, and traces are the “three pillars of observability.” Debugging is analogous to the rebar reinforcing the concrete in each pillar. In the case of this integration, Rookout’s debugger enriches your Dynatrace logs that hone in on the problems your initial logs recorded. Learn more about Rookout’s dynamic observability options in our live logging and live debugging capabilities, and try us out for free with any of our observability integrations.
Related posts