
“Hello, Ruby Debugging”
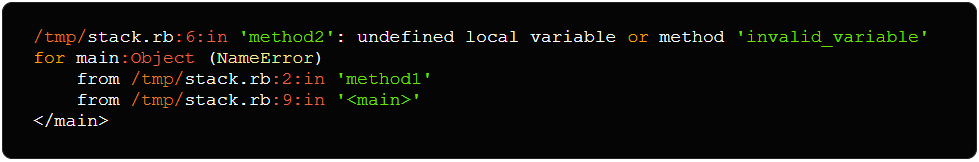
Learning a new language is always a joyous event. From the first innocent google search, through the first “hello world”, to always being surprised when the classic text is somehow printed to the screen/command line console/browser tab/local text file. The entire time your mind is quickly soaking in new ideas and concepts, new syntax and phrases, and new ways of doing things. Some of them can be compared to the languages you already know. Others are brand new. So nil is the new null, and I should expect a NoMethodError instead of a ClassNotFoundException.
When our customers asked that we add Ruby support, we had a happy chance to go through this excitement. Some of us on the team are passionate python advocates, while others favor Go. Some appreciate the power and maturity of the classics like Java and C++, while others prefer the scale and flexibility of Node.js. But so far only a handful of the team had a chance to actually code in Ruby.
Looking at you, Ruby
And so we took the first steps with joy. Running through a quick tutorial, printing some friendly lines, figuring out how to quickly show the power of the new language without getting our hands too dirty. But when you write code, life is bound to get dirty sooner or later. Something won’t work as you expected, an exception will be thrown, the app will crash and burn. You won’t be sure if it’s because you’re not a Ruby specialist yet or because you made a rooky (he he he) mistake.
This is the point in which you will reach the less fun part of learning a new language – learning how to debug it.
From puts debugging to rubber ducks
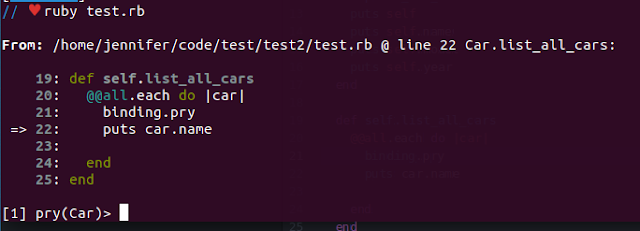
One of the first pages I googled under “how to debug Ruby” was naturally this one. I quickly learned that puts is my new print, and that pry is my new gdb. I learned how to gem-open and gem-unpack to see the source code. I was about to google further for a VSCode Ruby debugger plugin when I read a line that made me smile: “When all else fails, explain the problem to someone else”. It’s good to know that no matter how much changes when switching to a new language, rubber duck debugging is still your best friend. And, just to be on the safe side, I always have my rubber duck at my desk. It’s sitting there quietly, next to a purple Rook. Both of them sit there smiling, not judging me, willing to lend me a helping hand. Wing. Whatever.
The debugging guide went on to mention Wireshark, Strace, and curl, and when those words were used I usually ended up putting my hoodie on and looking for my safe space. Debugging is hard, but debugging in an unfamiliar language and without a familiar debugging tool is harder. Fear not though. Rookout is now here to help.
There is no such place as far away Ruby debugging
I started with local debugging using the newly found VSCode debugger and lo and behold! I had found the experience I was looking for: find a suspected line of code, set a breakpoint, run the app, hit the code. Essentially, it was a step-step-step through the code, looking at the local variables, and then comparing them to what I expected their value to be. When things look strange and you’re in a foreign land, when primitives aren’t primitives anymore because everything is classes, when you start to lose confidence in your coding prowess – well, let’s just say that it’s good to have the familiar debugger experience to keep you feeling at home.
After a couple of hours of happily debugging Ruby on my desktop, it was time to take things to the next level. I began by deploying the app to a cloud machine, labeling it “production”, then bringing my dream app to life. Sounds too good to be true, right? Obviously, as this is where things really started going sideways.
Even when debugging my “native” coding languages, remote debugging is a challenge. These challenges range from knowing where the code is running to making sure it’s running the same version I’m viewing in my IDE, to finding the relevant debug information, and getting access to a remote machine. All these steps require a significant learning curve and even after you’ve gone through them, each remote debugging session starts with that uneasy feeling at the pit of your stomach that something will definitely go wrong.
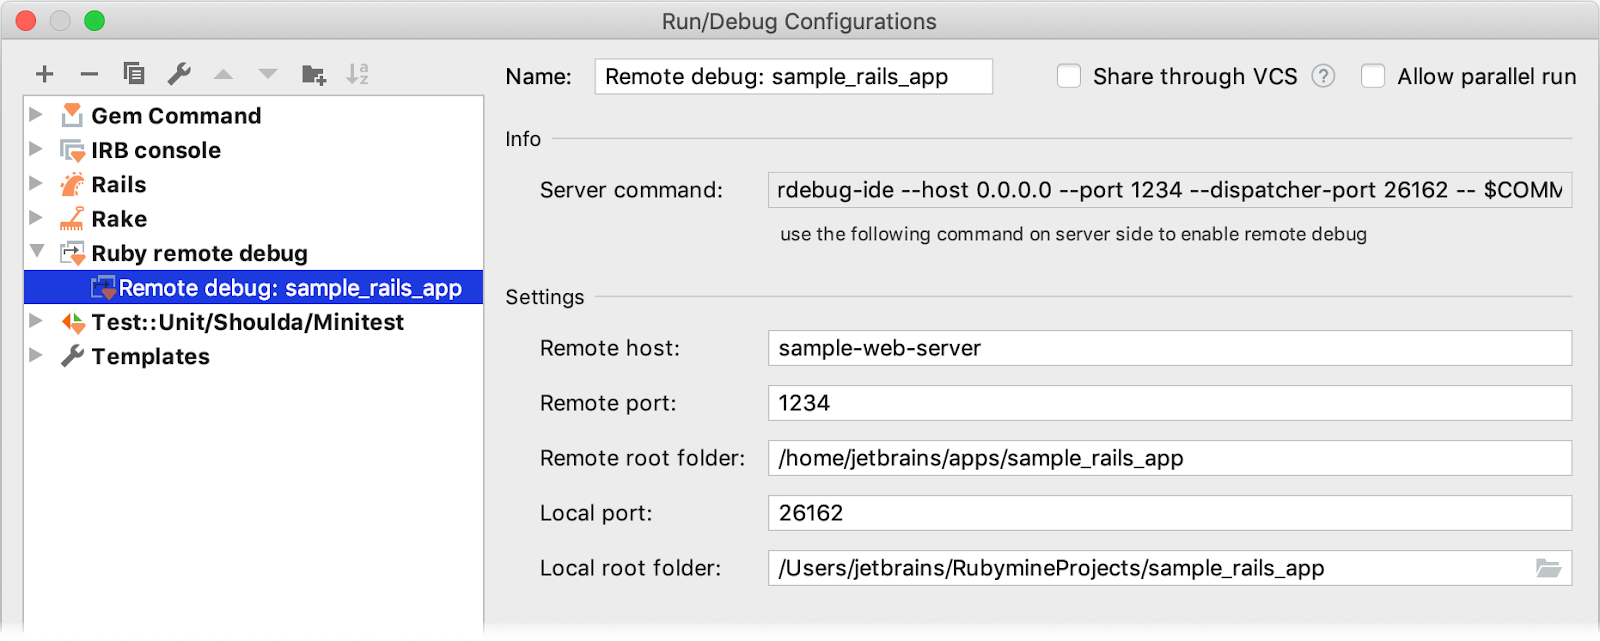
My first stab at remote Ruby debugging was no different. Finding the right IDE and plugin for the job, struggling with configuring a remote debug configuration, realizing I have to ask for SSH credentials… It seemed as if all the things I hate about remote debugging were back to haunt me. The thrill of coding in a new language started to lose its appeal, and I began to long for a remote debugger that would make me feel at home.
New Language, Same Debugger
As the title of this blog post hints, Rookout has newly added support for Ruby debugging. Installing the Rookout Ruby gem is a simple one-time task. And the best part? Once it’s up, you can debug any Ruby app, wherever it’s running. No waiting for puts lines to be added, no attaching to a remote server, no need to switch tools and learn new ones when moving from local debugging to remote, cloud, and even production debugging.
Setting up the Rookout SDK is a one-time code change – just add the following snippet into your app, as soon as it is initialized:
![require 'rookout' ::Rookout.start token: ['[Your Rookout Token]', labels: {env: "dev"}]](/wp-content/uploads/2021/06/5fc8b11144aef2e74892118b_screen20shot202020-12-0320at2011.33.5720am.png)
Check it out for yourself: https://docs.rookout.com/docs/ruby-setup/
And happy debugging!
Related posts