
Farewell StackDriver,
Hello Rookout
Transition seamlessly from
Google StackDriver Debugger
to Rookout’s powerful Developer-First
Observability platform
Troubleshoot and debug 80% faster in Production and any environment across multiple runtime and operating systems for a seamless and efficient experience
- Easy transition from the Google StackDriver debugger to Rookout with minimal changes to dependencies and initialization.
- We’ve got you covered: use JVM, .Net, Node, Python, Ruby, and Go packages.
- Streamline your debugging process with a production-grade live debugging solution with superior performance.
- Gain content-rich snapshots showing Variables, Processes, Stack Trace, Tracing, Tests, and Git data.
- GCP full support out-of-the-box
Engineering divisions using Rookout:


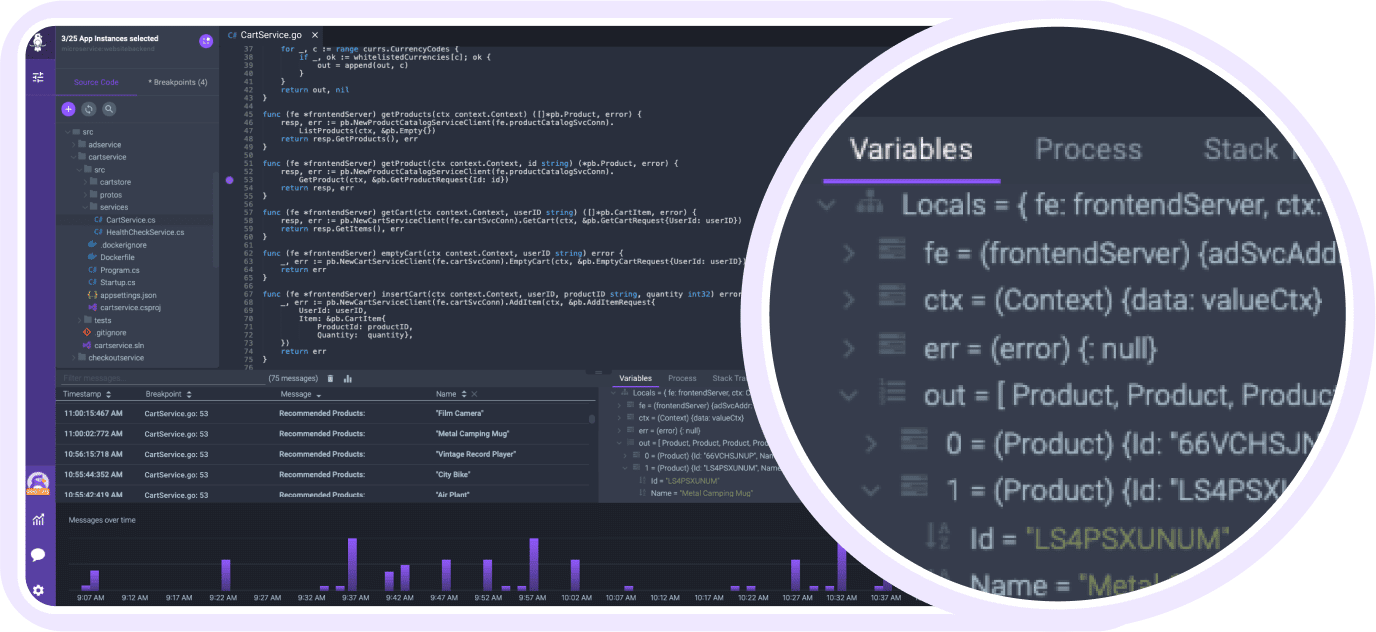
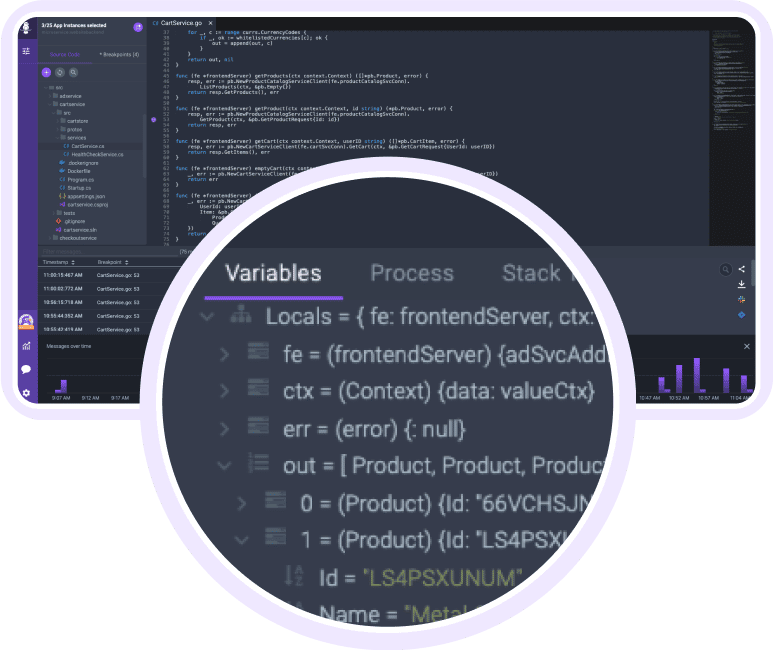
Capture snapshots
Instantly understand the state of your application by using non-breaking breakpoints and getting instant output, including: your full stack trace, local and global variables, tracing data and context, server metrics (CPU, memory), time measurements, and more.
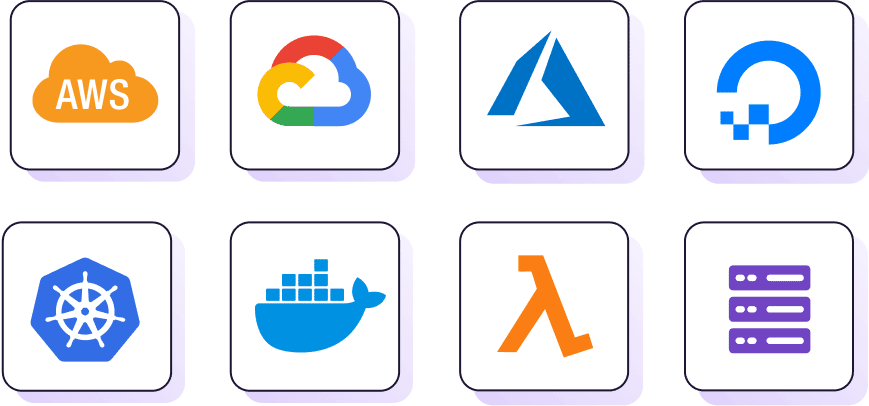
Debug any deployment
Fetch data from dynamically deployed, distributed applications with no need for SSH, attaching a debugger, or deploying a new version. Debug across dev, staging, and production as if the app was running on your laptop.
Gain X-ray vision into 3rd party dependencies
Overcome the black box debugging challenges derived from using open-source components, external dependencies, or your own legacy code.
Go beyond debugging
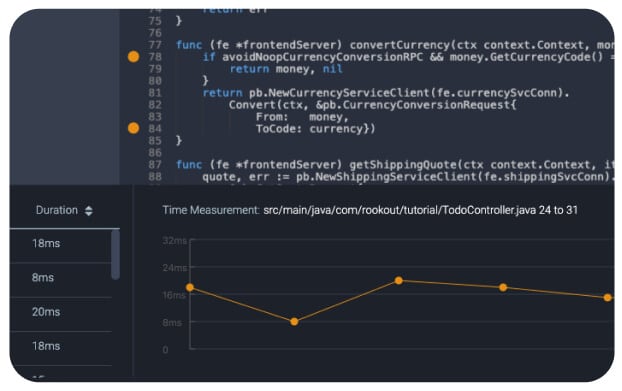
Real-Time Profiling
Leverage agile flame graphs to measure the execution time of any function or code snippet without worrying about performance hits
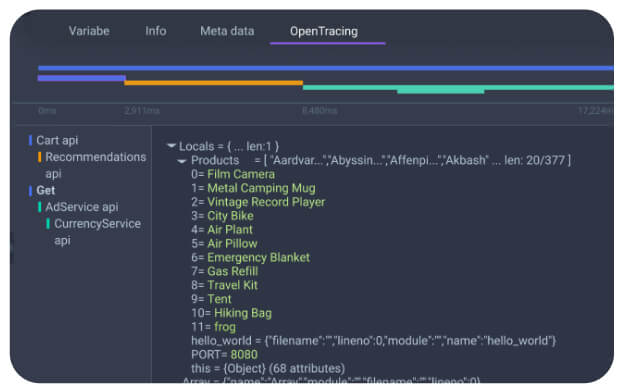
Distributed Tracing
Integrate with your favorite OpenTracing and OpenTelemetry tools to provide you with full context and visualization of your debug session
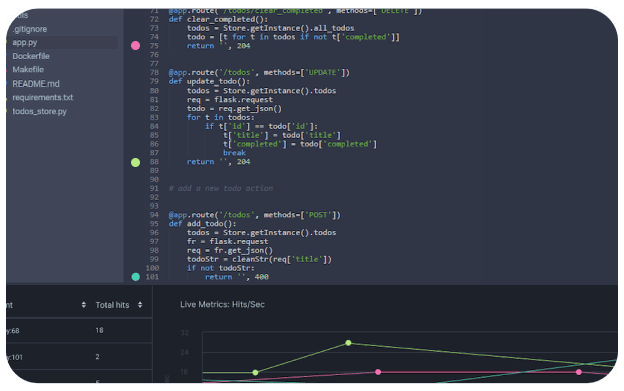
On-Demand Metrics
Save time and resources by analyzing your application performance in real-time. Avoid the guessing and tab-switching with side-by-side metric data and code
Generate dynamic observability data
Create the three pillars of Observability – logs, metrics, and traces – from live debug data on the fly. Pipeline to your favorite collaboration and observability tools and analyze them side-by side-with existing information.
Enterprise Grade
Trusted by banks and Fortune 500 companies in tightly regulated environments

- Get full control over database privacy with data redaction and data-on-prem options.
- No source code or customer data is ever uploaded or stored.
- Matching your tight contract with 99.5% uptime guarantee and 24/7 Enterprise SLA.
- Ground-built solution for simple and short deployment in even the most distributed and scaled cloud deployments.
- Strict compliance standards with: SOC 2 Type 2, GDPR, CCPA, and HIPAA. More info