5 Monitoring Tools Every Startup And MVP Should Check Out
As an entrepreneur and the CTO of a young startup, keeping a close eye on the product is at the top of my priorities. To keep improving the product, I’m always alert to new issues; and seeing those issues from different perspectives is key to resolving problems before users are affected. This is where monitoring comes in.
In this blog post, I will get you into my stack and share the list of monitoring tools I’m using on a daily basis. I will also talk about the value we’re getting from each tool.
Our toolbox helps us meet our Quality, User Experience, and Sales goals. In fact, every time Rookout has installed and implemented a new monitoring tool I came to the immediate realization: we should have added it sooner.
It’s worth mentioning that most of the monitoring tools discussed here won’t set you back more than $100 a month and won’t take too long to implement. They also work with most frameworks and languages.
Don’t reinvent the wheel
You have an early MVP, congrats! Without some fundamental visibility, however, how do you know it’s really working the way you intended it to?
Monitoring tools can be immensely valuable during development, and they are also critical to the product’s success with your customers. Fortunately, you don’t have to reinvent the wheel and fall prey to the NIH Syndrome. Today’s market is saturated with affordable monitoring options which do not require significant financial resources or developing efforts. This means you can start using these tools from day one, getting actionable insights and implementing them to optimize your workflow and product.
Logz.io
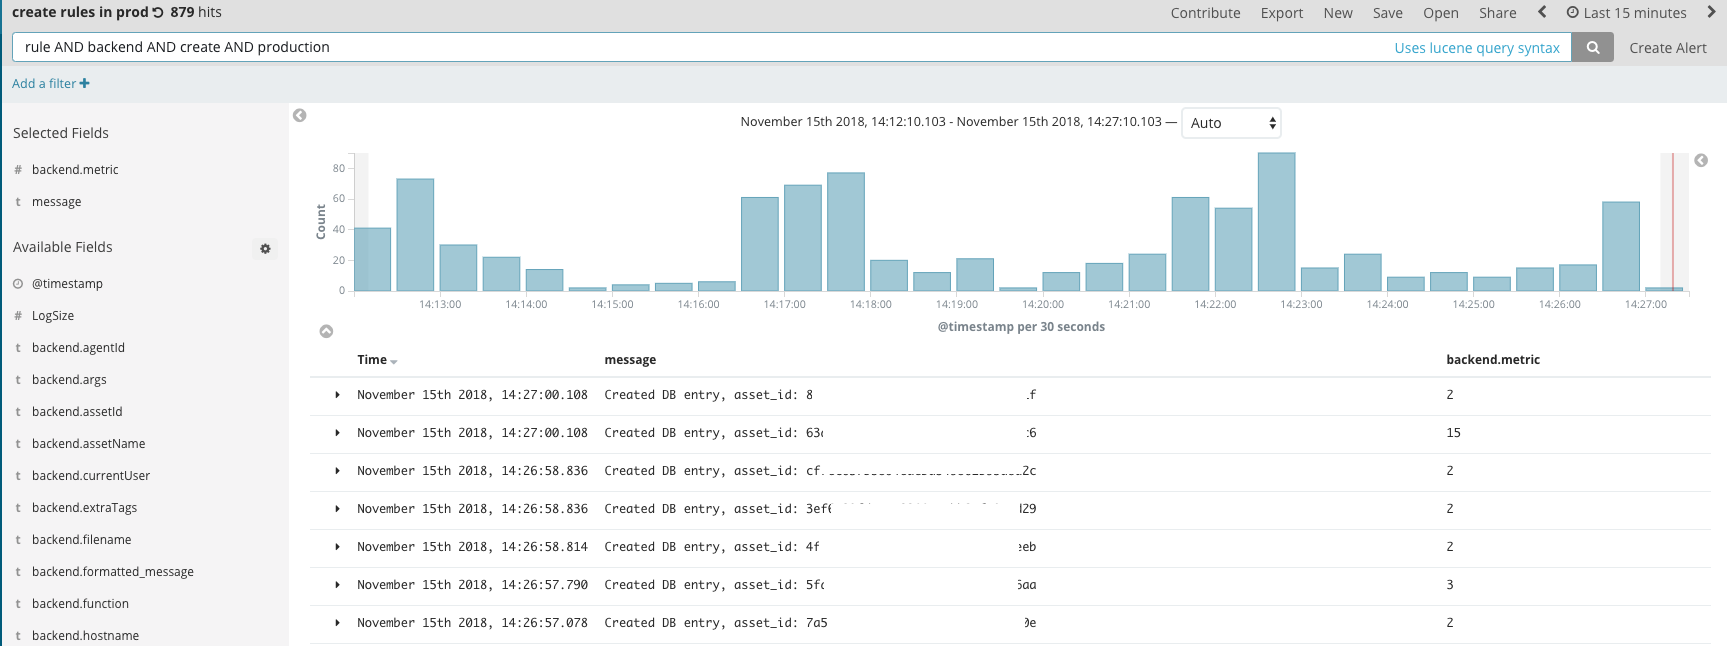
The importance of logs for devs can’t be overstated. Logs are where it all happens; it’s where the party’s at. And when something’s off, you’ll need your logs to deep dive into your code and come up with the questions you couldn’t think of before.
Logz.io provides ELK as a service and simplifies the process of log management. We use this tool to find errors and trace how they happened step-by-step. This is raw, meaty data in its most detailed and varied form, and this is the first place we’re going to check when we detect that something isn’t running smoothly.
Datadog
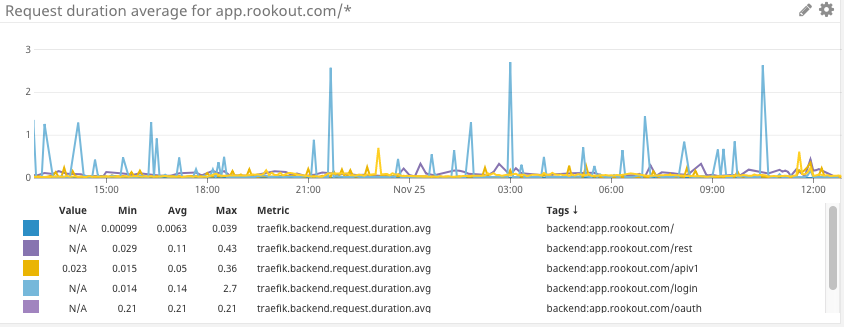
APM monitoring is at the heart of overall application health monitoring. Out of the various metrics you can watch for, the following two are the most important:
- Error rate: Make sure your service successfully replies to requests. Relying on upstream services to monitor these metrics won’t do if they are unavailable or failing in some way.
- Latency: Make sure your service replies in a reasonable timeframe, providing good UX for your users. Relying on upstream service might not suffice as you will not see queued requests waiting for processing.
Datadog allows us to build specific dashboards and alerts to meet our distinct needs. For instance, we have an alert set up to let us know when Redis memory consumption goes over a certain threshold. We also use Datadog to monitor R&D metrics, quality, velocity, and business trends.
Sentry.io
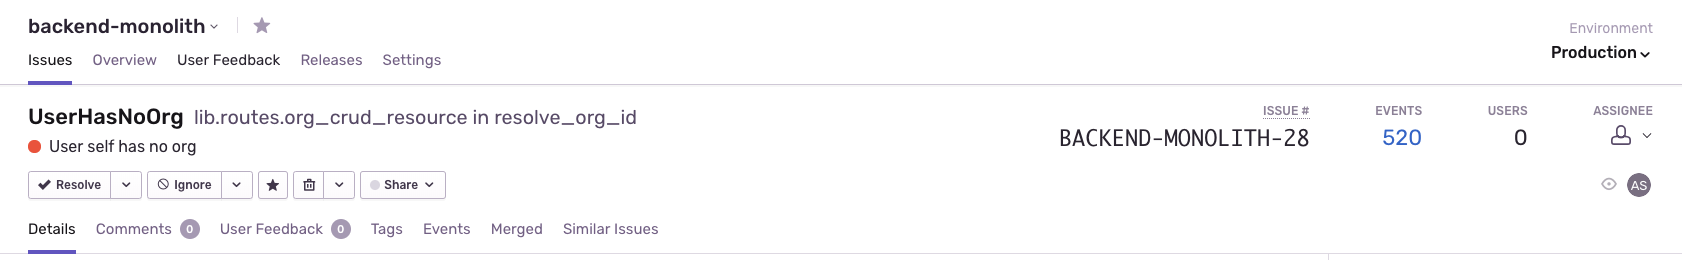
Instead of wasting precious time digging through the logs in search of exceptions, we use Sentry. It collects all of the required info on the occurrence of exceptions in a comprehensive and digestible way. You also get some cool features, such as error aggregation, push notifications, and automatic exception assignment to developers. Sentry is our first line of defense to let us know when things go wrong for a user, across our frontend and our various microservices.
LogRocket
Possibly the youngest tool on this list, LogRocket is a cool new all-in-one frontend monitoring solution. LogRocket records the (securely redacted) sessions of your users, allowing us to understand their User Experience while deep-diving into any bug they may have encountered. You can see the exact behavior of the users on the app, see where they clicked and the state of the app at each point. Our solution engineers use LogRocket daily to assist our customers; our product and UX experts use it to improve the product, and our frontend engineers use it to fix bugs.
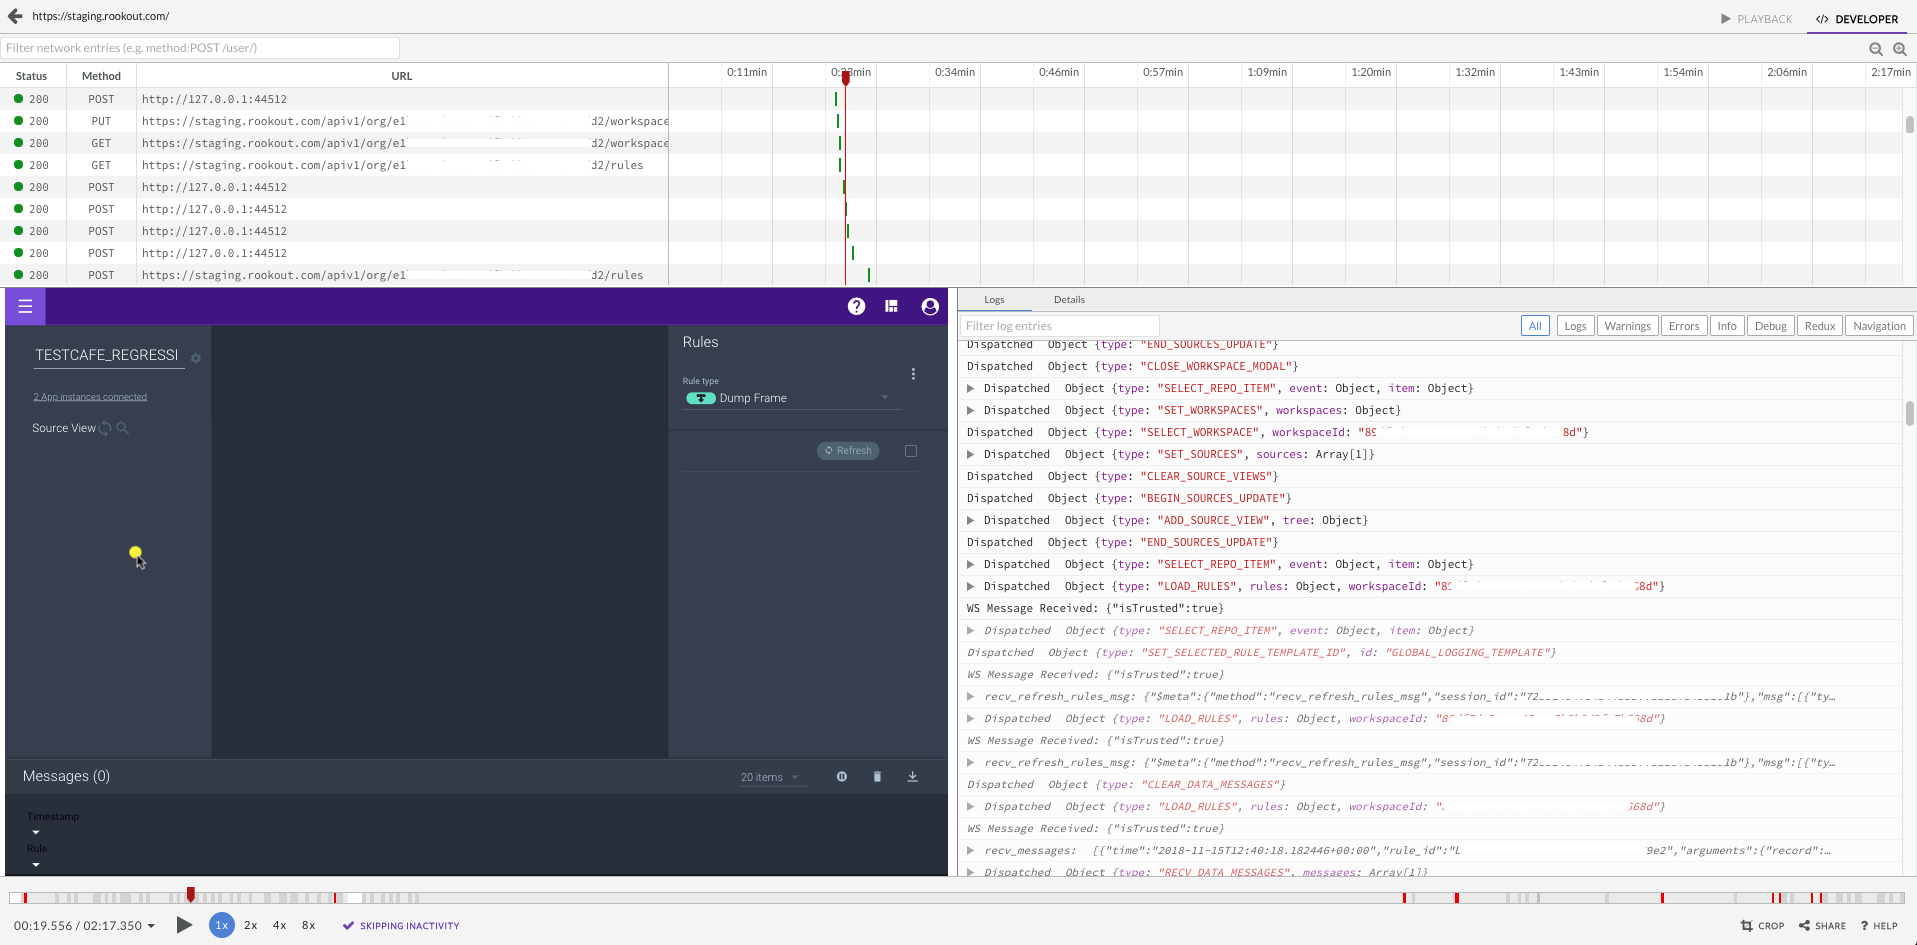
Rookout
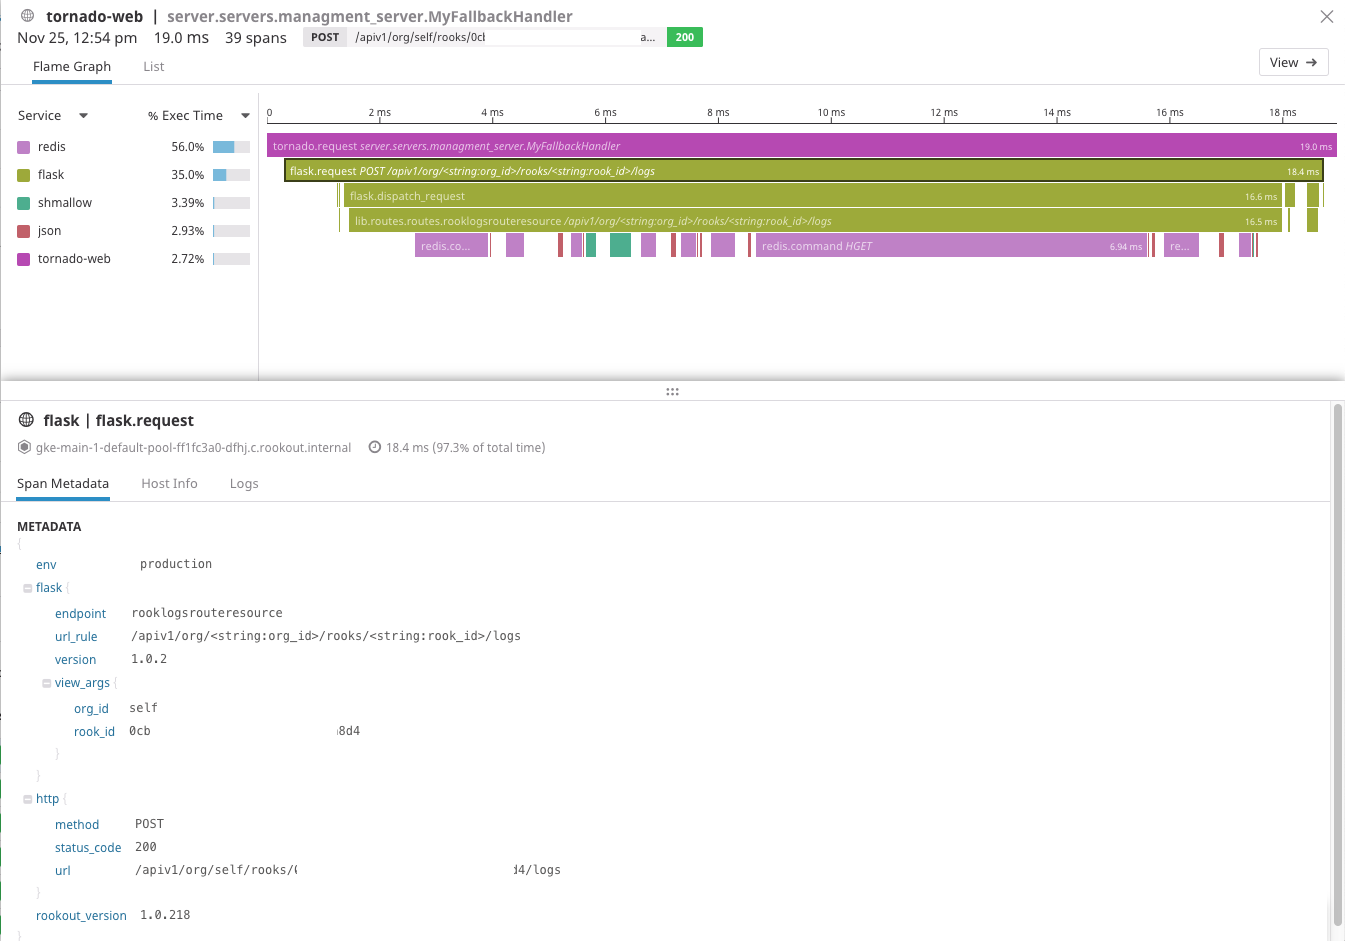
Last but not least, is drinking our own champagne. We use Rookout to debug our own SaaS platform including the production, staging and dev environments.
Even though we can push a commit to production in under 15 minutes, sometimes the exploratory cycles of adding a logline, or Sentry/DataDog export, just takes too long. Adding a new metric using Rookout in a single click can often mean the difference between a successful and failed onboarding session.
To sum it all up
I know how tempting it is to jump right into developing new features for your app. But especially in the beginning, it is much wiser to invest your resources and time into monitoring. A profound understanding of the application and its behavior, combined with a birds-eye-view of its strengths and weaknesses is vital to the success of your company. Use monitoring tools to deep dive into your current product, ask the right questions to understand it better, and optimize its performance with your users.
As I’ve mentioned before, these tools don’t require many resources, both, in terms of time and money; but don’t underestimate the value they can bring to your company. My best advice for you is this: As soon as you get your MVP out of the gate, put monitoring high up on your priority list and start reaping the benefits.
Related posts