

How To Stream Logs From Rookout To Logging Management Systems
Let’s face it: If you’re a developer, you spend a lot of your time logging. Today, as organizations are leaving on-prem servers behind and moving to containers and microservices, the importance of logging has grown. Finding the right logs is critical to understanding issues, fixing them and redeploying, yet searching manually through log data has become nearly impossible.
Sending logs to your management system of choice can be messy. Even experienced developers are challenged by configuring multiple microservices and deploying across all of them, especially when it’s not a one-size-fits-all solution. The process is different with every system. Configuring across multiple services can be error-prone, require many permissions and significant costs for large amounts of storage space.
Keeping up with the logs
Luckily, logging management systems have kept up with the changing software development ecosystem, and devs everywhere have access to the information they need. The management systems we work with today can not only store logs and alert development teams but provide reports and insights for different functional groups in organizations from business, to operations, to marketing.
At Rookout, we are first and foremost developers. We know how important logs are, but we also know how time-consuming it can be to write them and send them off to multiple services, each with their own integration process that varies from language to language. Our solution? Stream directly from Rookout to all of your favorite management systems without installing libraries, adding code snippets, or writing logs into your code, one by one.
Setting up dynamic logs
An application can be comprised of thousands of lines of code, and devs are prone to experiencing logging FOMO when writing the logs that accompany them. With logs being a valuable source of information, we spend a significant amount of time writing them into our code so that we don’t enter the dreaded rebuild/test/redeploy cycle. Well, what if you never had to set up a multi-node cluster on your machine or log every line? Instead of logging your code traditionally, you can set up Rookout’s non-breaking breakpoints as dynamic logs.
Dynamic logging simplifies the way you write, collect and send your logs. You can set non-breaking breakpoints to collect only the data you need, without writing extra code or redeploying your app.
A standard application might look something like this:
import logging
import time
import sys
root = logging.getLogger()
root.setLevel(logging.DEBUG)
handler = logging.StreamHandler(sys.stdout)
root.addHandler(handler)
logging.info(‘starting’)
time.sleep(2)
def func():
count = 0
for i in range(5):
logging.info(“My test index : %d” % (i))
count = count + i
time.sleep(1)
logging.info(“My count : %d” % (count))
func()
Now take a look at what our app looks like with Rookout installed:
import time
import sys
import rook
rook.start()
time.sleep(2)
def func():
count = 0
for i in range(5):
count = count + i
time.sleep(1)
func()
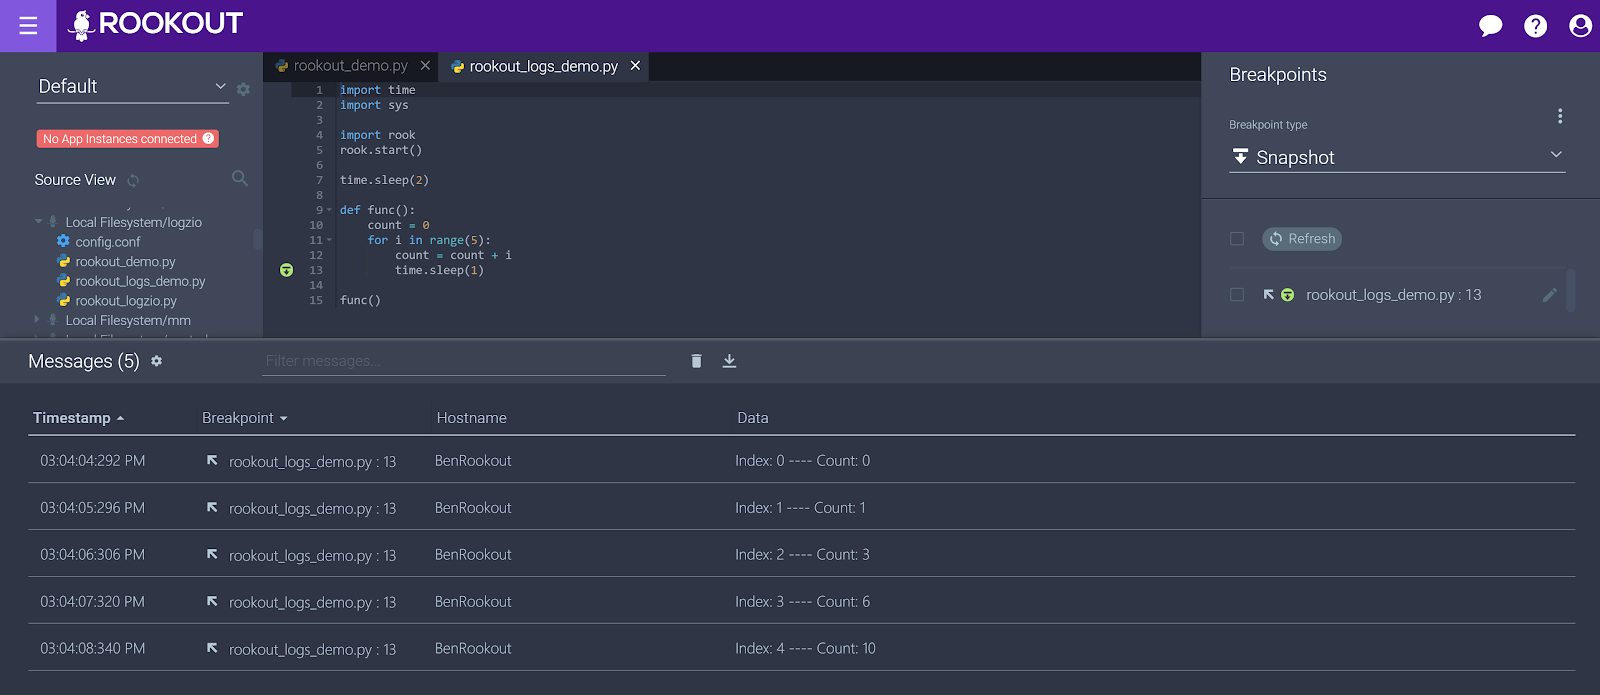
When Rookout is set up, you can simply set your breakpoints by clicking next to the line number and then see the data in the IDE-like interface.
Integrating Non-Breaking Breakpoints and Management Systems
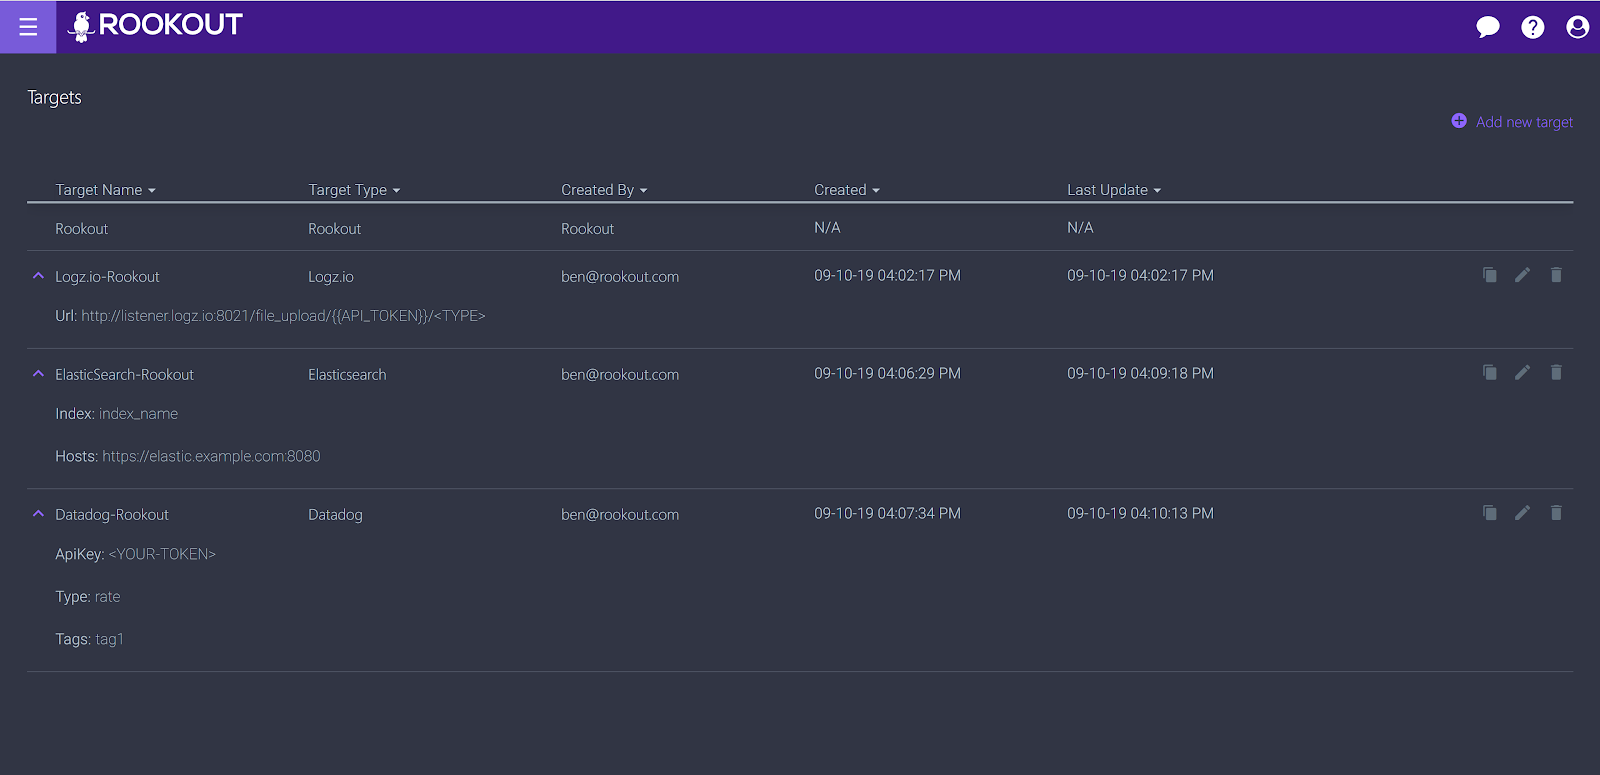
If you’re interested in streaming logs to your management system of choice, simply set custom targets for your breakpoints, using the URL, index, or API key of the system in the Rookout app. To do that, simply go to Rookout’s top left menu and select ‘Targets’. Whether you have legacy management services running or you’re setting up new infrastructure, the process is the same.
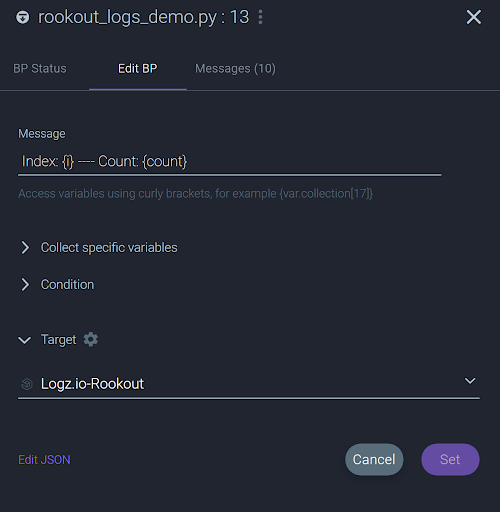
Once you have your targets configured, simply edit your breakpoints, select the target of your choice in the app and they’ll stream directly to your selected service.
We decided to stream our logs to Elasticsearch first. Your logs won’t appear in the Rookout IDE if you set up streaming, but if you query the Elasticsearch server you can see the result. Here’s ours (simplified):
{
“hits” : {
“total” : 5,
“hits” : [
{
“_index” : “rookout_elastic_search_demo”,
“_source” : {
“@timestamp” : “2019-09-12T15:11:49+03:00”,
“filename” : “rookout_logs_demo.py”,
“function” : “func”,
“line” : 13,
“locals” : {
“count” : 3,
“i” : 2
}
}
},
{
“@timestamp” : “2019-09-12T15:11:47+03:00”,
“variables” : {
“count” : 0,
“i” : 0
}
}
},
{
“@timestamp” : “2019-09-12T15:11:51+03:00”,
“variables” : {
“count” : 10,
“i” : 4
}
},
….
}
Let’s look at another example and stream our logs to Logz.io. Logz.io provides the ELK Stack as a managed service and could be a good option if you don’t want to maintain your Elasticsearch cluster on your own. In this case, all you need to do is set the target of your breakpoint for the service after configuring it, it’s as easy as that.
Now, if you run your app, you’ll see that the breakpoints you set in Rookout with the click of a mouse are streaming logs directly to Logz.io.
Letting the Information Flow
Development cycles can take months, and adding a single log line can often take over a week from writing to deploying it into your app. Modern software ecosystems require us to use dynamic, elastic methods, and to log compulsively so we can easily identify security issues and bugs in our code. With logging becoming a sensitive part of the deployment cycle for many companies, accessing the data you need on-demand before you rebuild and redeploy has become an essential part of the dev workflow.
“Logs, just like any other commodity, change in value. Sure, some logs might not be important 100% of the time. But the last thing you need when troubleshooting an issue in production is that a single message holding a critical piece of the puzzle not available. The result of compromising over what data to log, because of costs, is a dent in your system’s observability. “ – Daniel Berman, Logz.io
Every team has its own needs, from data collection to aggregation and metrics, but configuring new services as your team grows and your application changes can mean repeating sensitive processes. We believe observability should be at your fingertips, so you can invest your time into the things that matter most.
Give non-breaking breakpoints a try, and stream your logs quickly to all your favorite systems.
Related posts


