
The Fourth Pillar of Observability: Your Developers’ Must-Have Observability Tool
A paradigm shift is overdue in the realm of software observability. While Site Reliability Engineers (SREs) have been having fun with metrics, traces, and logs, software developers have been left in the lurch, shackled to the conventional, low-fidelity tool of logs. Why should SREs have all the fun, right?
Welcome to the dawn of a new era. An era where developers, too, can enjoy superior observability engineering. That’s where the fourth pillar of observability comes in: Snapshots.
Logs: Low Fidelity vs. Snapshots: High Fidelity
Traditionally, logs have been the mainstay of debugging for developers. They provide insight into the system’s behavior and serve as the primary source of data during issue investigation. However, their information is often limited, sometimes irrelevant, and quite noisy. This ‘low-fidelity’ nature makes them less efficient in capturing the full picture of a system’s status, hindering quick problem resolution.
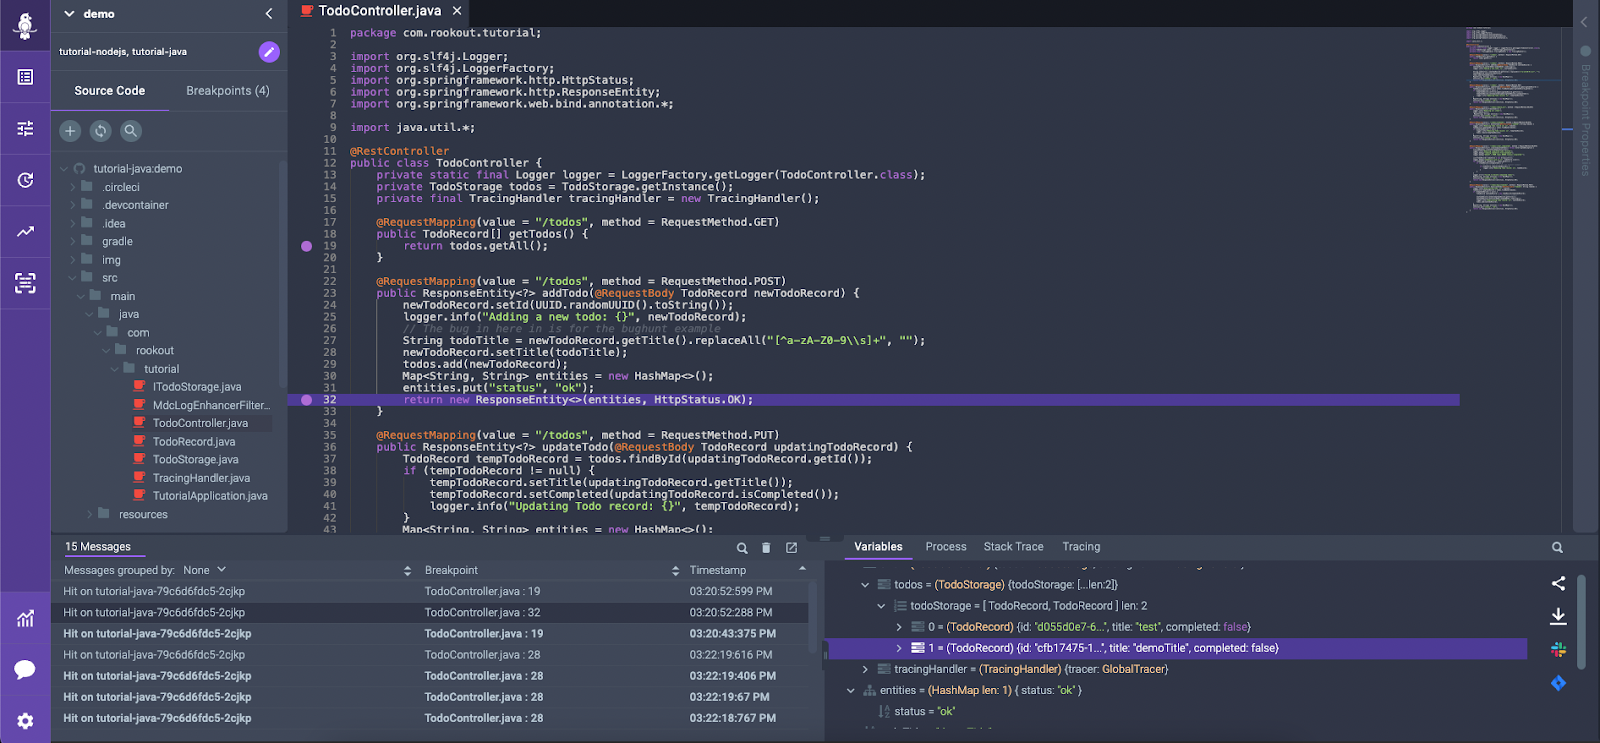
Snapshots, on the other hand, are the antithesis of logs in terms of fidelity. A snapshot is a high-fidelity, contextual image of your application’s state at any given moment. It can contain variable values, stack traces, and other metadata, making it a richer and more informative source of data. The high fidelity of snapshots provides an in-depth view of the code execution, facilitating more efficient debugging and reducing the time to resolution.

The Pain of Optimizing Logs
Let’s be honest. Working with logs is a nightmare, isn’t it? They require a great deal of optimization, necessitating constant tinkering with the code to ensure that the logs capture the right data. It’s a time-consuming process, fraught with challenges, and the end result may still not be optimal.
To make it even more difficult, logs are often not ‘developer-friendly’. Developers have to carefully choose what to log, balancing between log verbosity and performance impact. Too little logging and there might not be enough data to diagnose an issue. Too much logging and the system could be bogged down with the performance cost, not to mention the hassle of sifting through mountains of irrelevant log entries. This often leads to an iterative, try-and-fail process of determining the right amount of logging, significantly impeding the development cycle.
Additionally, developers often have to anticipate which data will be required for future debugging sessions, which is inherently problematic. As we have yet to encounter any developers who can see the future, this makes predicting future issues accurately a difficult, if not impossible, task. Thus, developers often find themselves in situations where the logs don’t contain the necessary information to diagnose an issue, thereby leading to more time lost in log augmentation.
Last but not least, making changes to logs, whether adding new ones, removing outdated ones, or updating existing ones, involves modifying the code, testing, and then deploying the updated service. Each of these steps consumes a significant amount of time and resources, slowing down the overall software development process.
From a financial perspective, these inefficiencies translate to real costs. The time and resources consumed in log optimization not only slow down the development cycle, leading to delayed releases, but also represent labor hours that could have been spent on feature development, enhancements, or innovation. Additionally, extensive logging results in high storage costs. As data generation accelerates, managing and storing these logs can be a severe financial burden.
Snapshots: Contextual Data in Real-time
In contrast, snapshots offer a more seamless, efficient solution. They allow you to see data in the context of the code, eliminating the tedious back-and-forth involved in decoding logs. With snapshots, there’s no need to manually map log data to code, as they are designed to give you the relevant information right where you need it.
Snapshots provide a context-rich view of your application’s state in real-time, offering a more granular and detailed understanding of your code’s behavior. They make it easier to identify and address problems, significantly reducing the time spent on resolving issues. They are not just a stand-alone tool but a piece of a larger observability engineering puzzle, complementing and enhancing the effectiveness of the other three pillars – logs, metrics, and traces.
While logs are the fundamental basis for observability, providing raw data about system events, metrics offer a high-level overview of system health and performance, and traces give insight into request flows across services. However, even with these tools, developers often grapple with the question: “What exactly is happening inside my code at this moment?”
This is where Snapshots truly shine. Snapshots provide a contextual, real-time view of your code’s execution, bridging the gap between these high-level statistics and the granular detail of specific code execution. They complement metrics by providing detailed context for changes in system behavior. They supplement traces by offering a deep dive into specific function calls or service interactions. And they enhance logs by providing a rich, detailed picture of your code’s state at any point in time, eliminating guesswork and assumptions.
Snapshots: Reliability and Relevance
Logs, by nature, are based on a plethora of assumptions and can quickly become outdated. This results in a situation where you might base your analysis and decisions on inaccurate or obsolete information.
Snapshots, however, are highly reliable. They capture the exact state of your application at a specific point in time, ensuring the data’s relevance and accuracy. This allows developers to make informed decisions based on up-to-date, precise information, significantly reducing the chances of errors.
Snapshotting without Redeployments
One of the best things about snapshots is the ability to add them in real-time without requiring code changes or deployments. This is a game-changer for developers as it eliminates the cumbersome, time-consuming process associated with log optimization, enabling a more streamlined approach to observability. By combining snapshots with logs, metrics, and traces, developers can gain a comprehensive view of their software – from macro performance metrics to micro-level code execution details.
Let’s not stop at the three pillars of observability; let’s raise the bar and embrace snapshots and give developers the observability tools they deserve and need to make their jobs easier. Snapshots promise a future where high fidelity, real-time, and context-rich data are not luxuries but norms in software debugging. Get ready to say goodbye to the limitations of logs and welcome the powerful capabilities of snapshots in your developer toolkit.
So, here’s the takeaway: logging sucks. But with snapshots, we’re hoping to change that narrative. Let’s elevate our observability game. Together.
If you’re intrigued by this new way of approaching observability software, be sure to stay tuned. We’ll be diving deeper into the power of snapshots in our next blog post. And if you want to learn more about the fourth pillar of observability, watch Liran Haimovitch’s webinar on SDTimes on this exact topic. Enjoy!
Related posts