
Introducing Dynamic Observability: A no-code integration between Elastic and Rookout
In recent years, Observability has become a de-facto standard when discussing development and maintenance of cloud-native applications. The need to develop an observable system and ensure that as it runs in production, engineers will be able to detect performance issues, downtimes, and service disruptions, has evolved into a rich ecosystem of tools and practices. It also demands the elevation of the field to a new form of a more dynamic kind of observability.
The Elastic Observability platform has been a trailblazer in this ecosystem, providing a one-stop-shop for collecting logs, trace information, and metrics from a seemingly infinite number of agents, agentless collection methods, and cloud provider integrations. Adding visualization, automated root cause analysis, and alerting capabilities on top of the collected data provides engineers with a single pane of glass, providing a rich APM experience presented in a unified and intuitive user experience.
The latest integration between Elastic and Rookout aims to further enrich this experience by introducing Dynamic Observability – namely, the ability to collect additional logs, trace information and metrics 1) without adding code nor waiting for a deployment, and 2) with minimal impact on performance and logging costs. This development has pushed observability one step further towards a real-time capability, allowing it to address the rising challenges of managing and deploying distributed and dynamic microservices-based deployments.
In this blog post, we will dive into the new partnership, providing a hands-on guide to exposing the power of Dynamic Observability.
Introducing the Rookout Live Platform
As the name suggests, the combination of debugging with logging and metrics creates a more dynamic observability environment that operates with no interruption to production and can be activated quickly. The Rookout Live Platform integrates with the Elastic Observability, offering two game-changing capabilities to Elastic users:
- “Non-Breaking Breakpoints” that let you fetch local variables, logs, and metrics from any line of code within the app. This is without stopping the app, without adding code, and without restarting.
- Live Logging lets you change logging verbosity level dynamically and contextually. Drill down to the specific instances, components, accounts, or even individual users to get detailed Debug and Trace logs with no pre-filtering.
To enjoy these capabilities and enhance your Elastic Observability experience, we will first set up your Rookout environment.
Setting Up
Setting up Rookout is a matter of minutes. Sign up for the Rookout service online and add the instrumentation agent to your application. if you happen to be using Java, it’s going to look something like the following. For other programming languages and the on-boarding wizard check the online docs should.
curl -L "https://repository.sonatype.org/service/local/artifact/maven/redirect?r=central-proxy&g=com.rookout&a=rook&v=LATEST" -o rook.jar

export JAVA_TOOL_OPTIONS="-javaagent:$(pwd)/rook.jar -DROOKOUT_TOKEN=[Your Rookout Token]"
Besides the instrumentation agent, Rookout also offers a web debugger. Once your application is up and running, you’ll be able to set Non-Breaking Breakpoints in a dev-friendly user interface, and instrument your code dynamically.
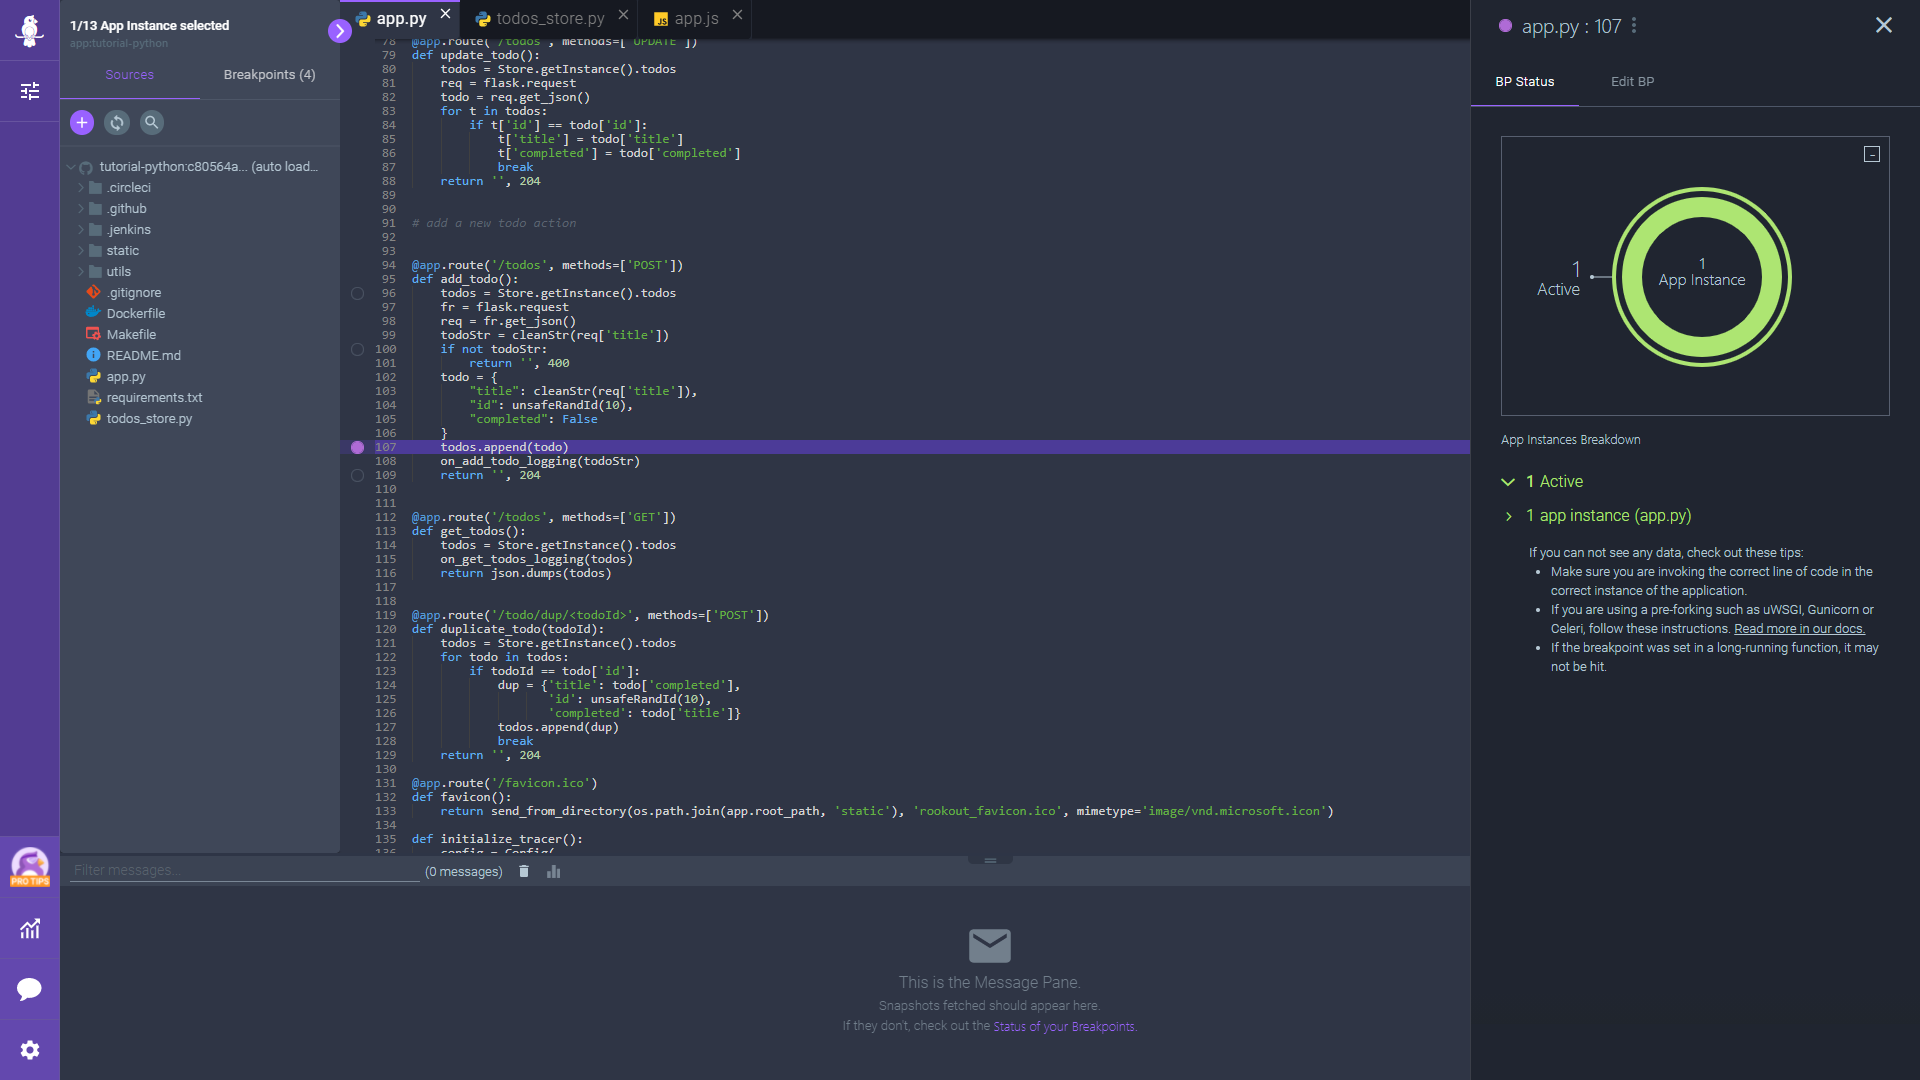
To make sure everything is set up correctly, and see the magic of Rookout, select the appropriate file and add a non-breaking breakpoint to the relevant line of code. Once you invoke it, you will instantly get a full snapshot of your application, showing the values of the variables, stack trace, and much more!
Detailed debug information is visible, but your app did not stop
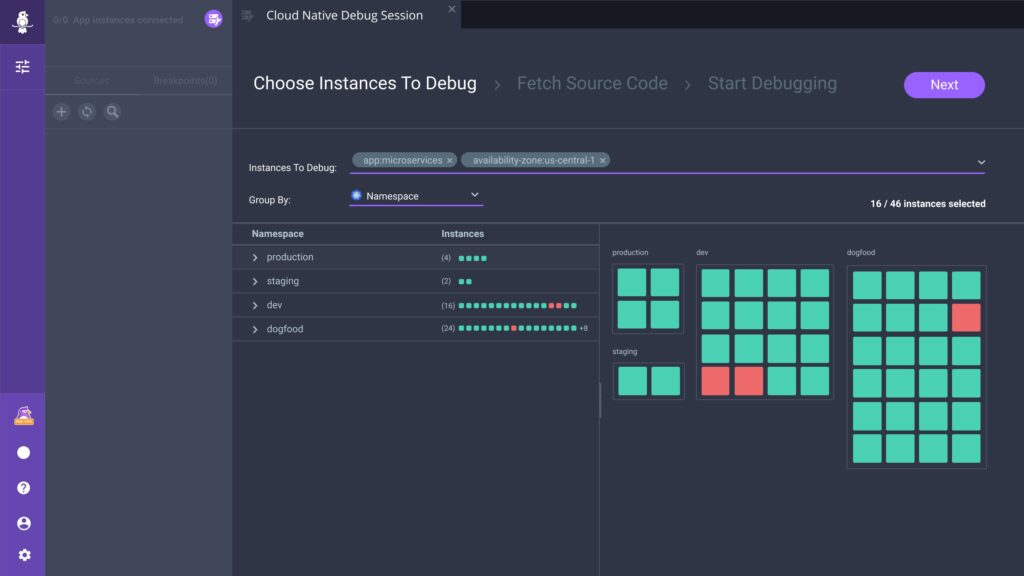
One more ability provided by Rookout is a dynamic view of your cloud-native deployment. In the Debug Session Configuration page, you will be able to get a view of your environment, and group the instances in which Rookout is deployed. By grouping and filtering your environment by Namespace, Deployment or any other cloud-native parameter, you will be able to slice and dice and dynamically fetch data from any or all of the pods, containers, functions or servers running in your application.
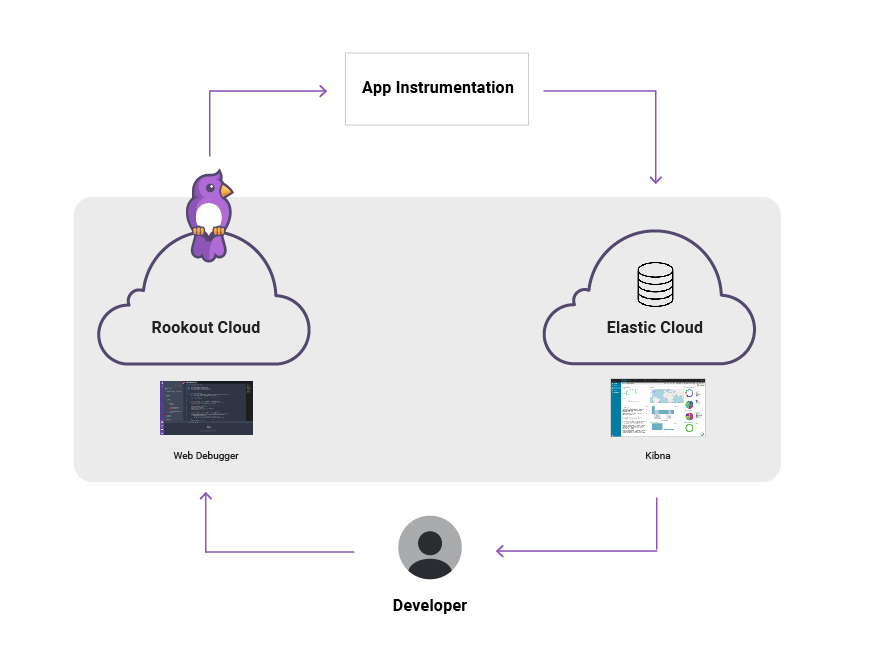
Connecting with Elastic Observability
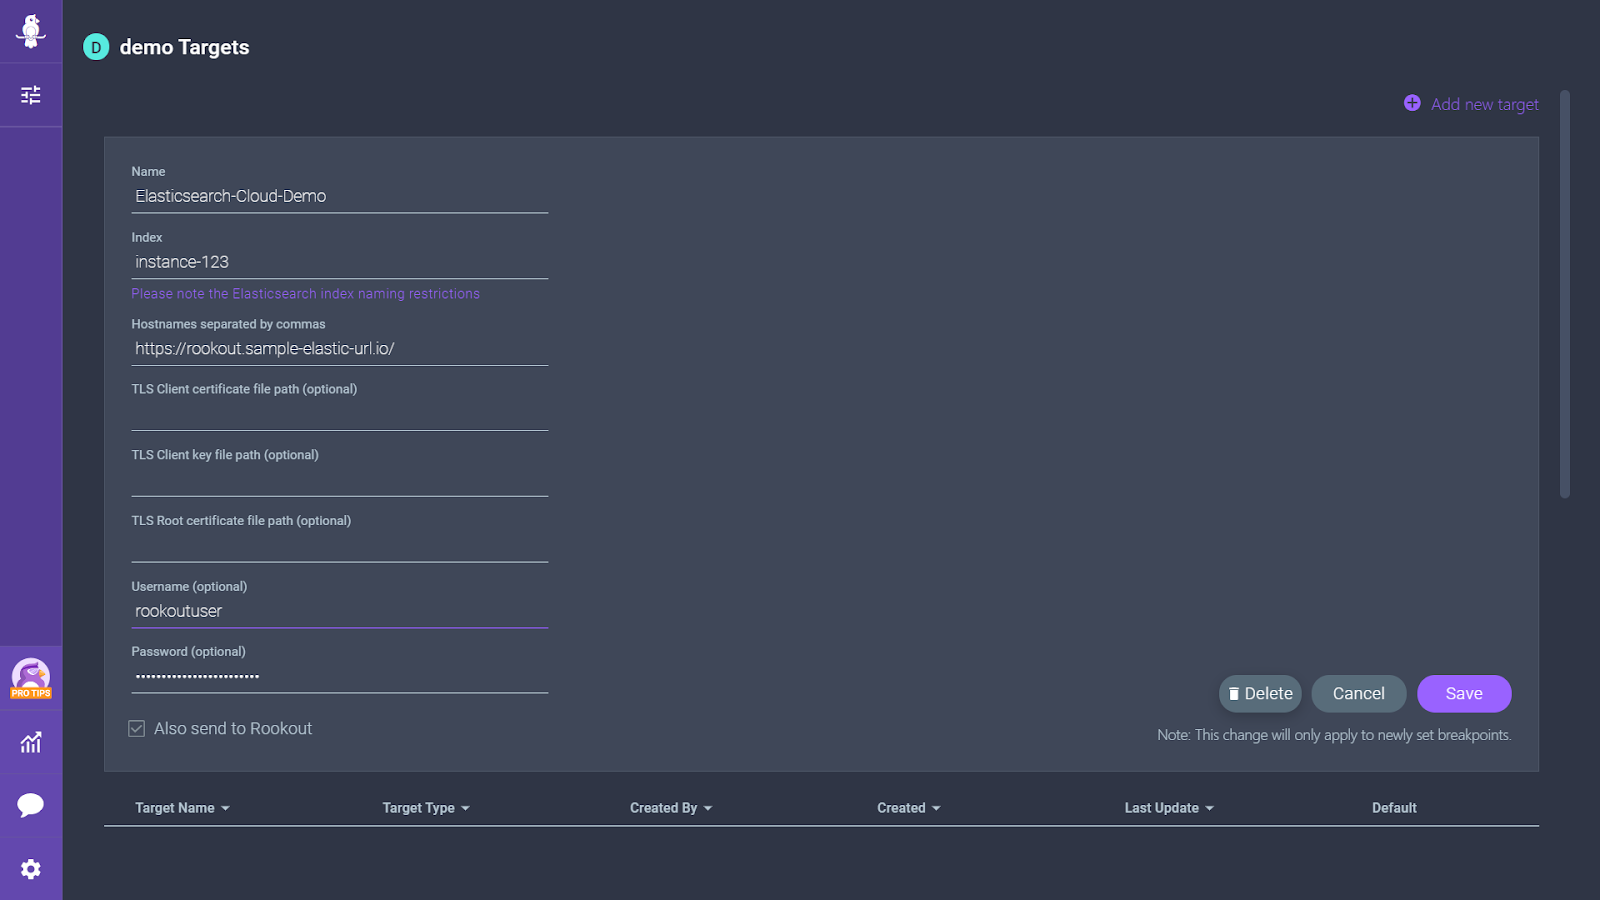
Next, you’ll want to hook Rookout up with your Elastic Observability, so that you can benefit from dynamically collected data in Kibana. Start by clicking Settings (the cogwheel at the bottom left) and select the Targets option. Go ahead and add Elasticsearch as a new target:
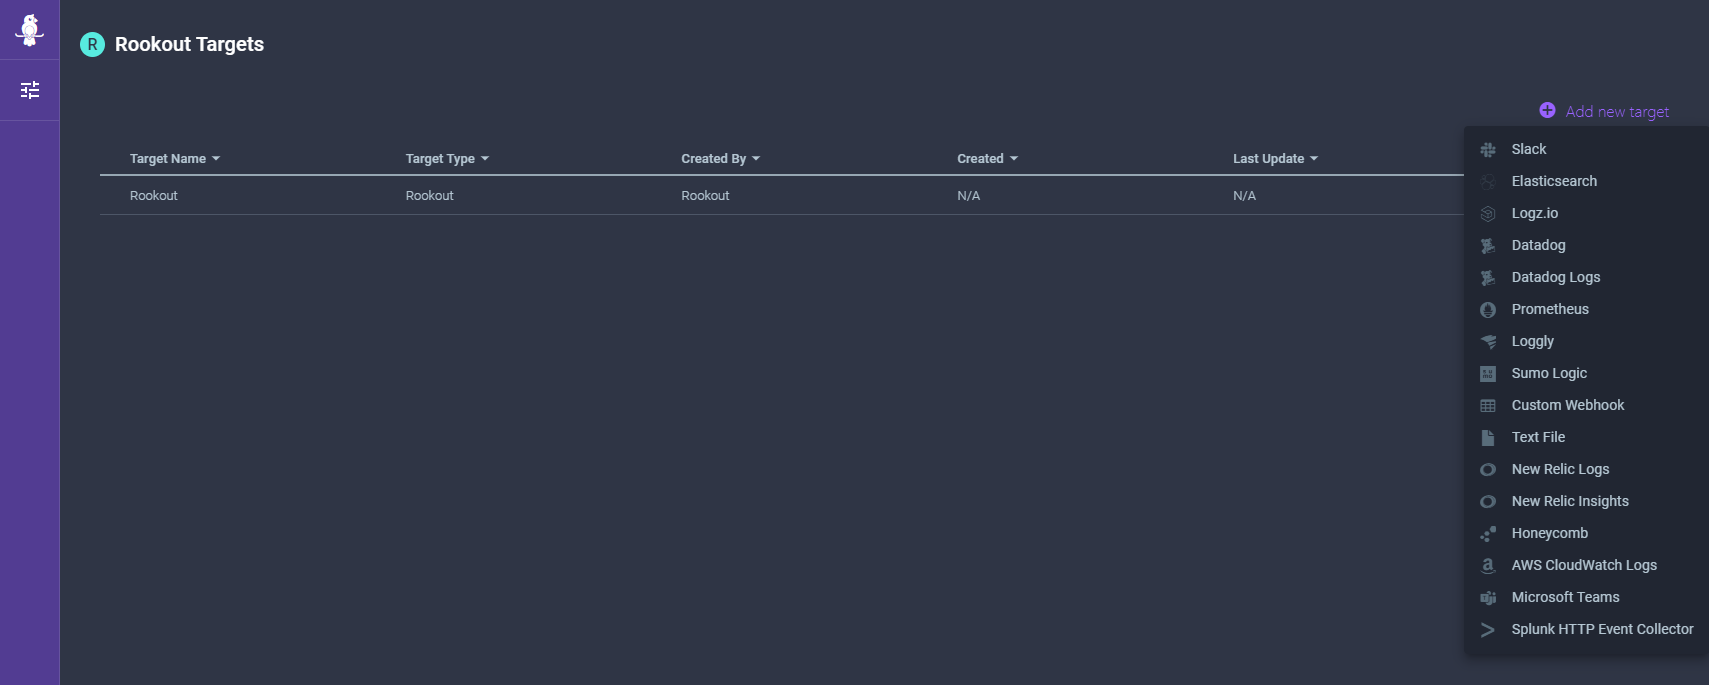
Name your new target, configure that cluster’s hostnames, the index name, authentication credentials and more:
Now that you are connected, the Rookout instrumentation agents will listen quietly for instructions. When a Rookout Non-Breaking Breakpoint is set and hit, they will dynamically start streaming live data to your Elastic Observability instance.
Seeing it in Action!
Once you have got everything set up, getting new data into your Elastic is a breeze. Start out by selecting the instances you want to collect data from. You can collect data from as many (or as few!) instances as you need. Whether you want to collect data from entire deployments, or a single instance, that’s entirely up to you.
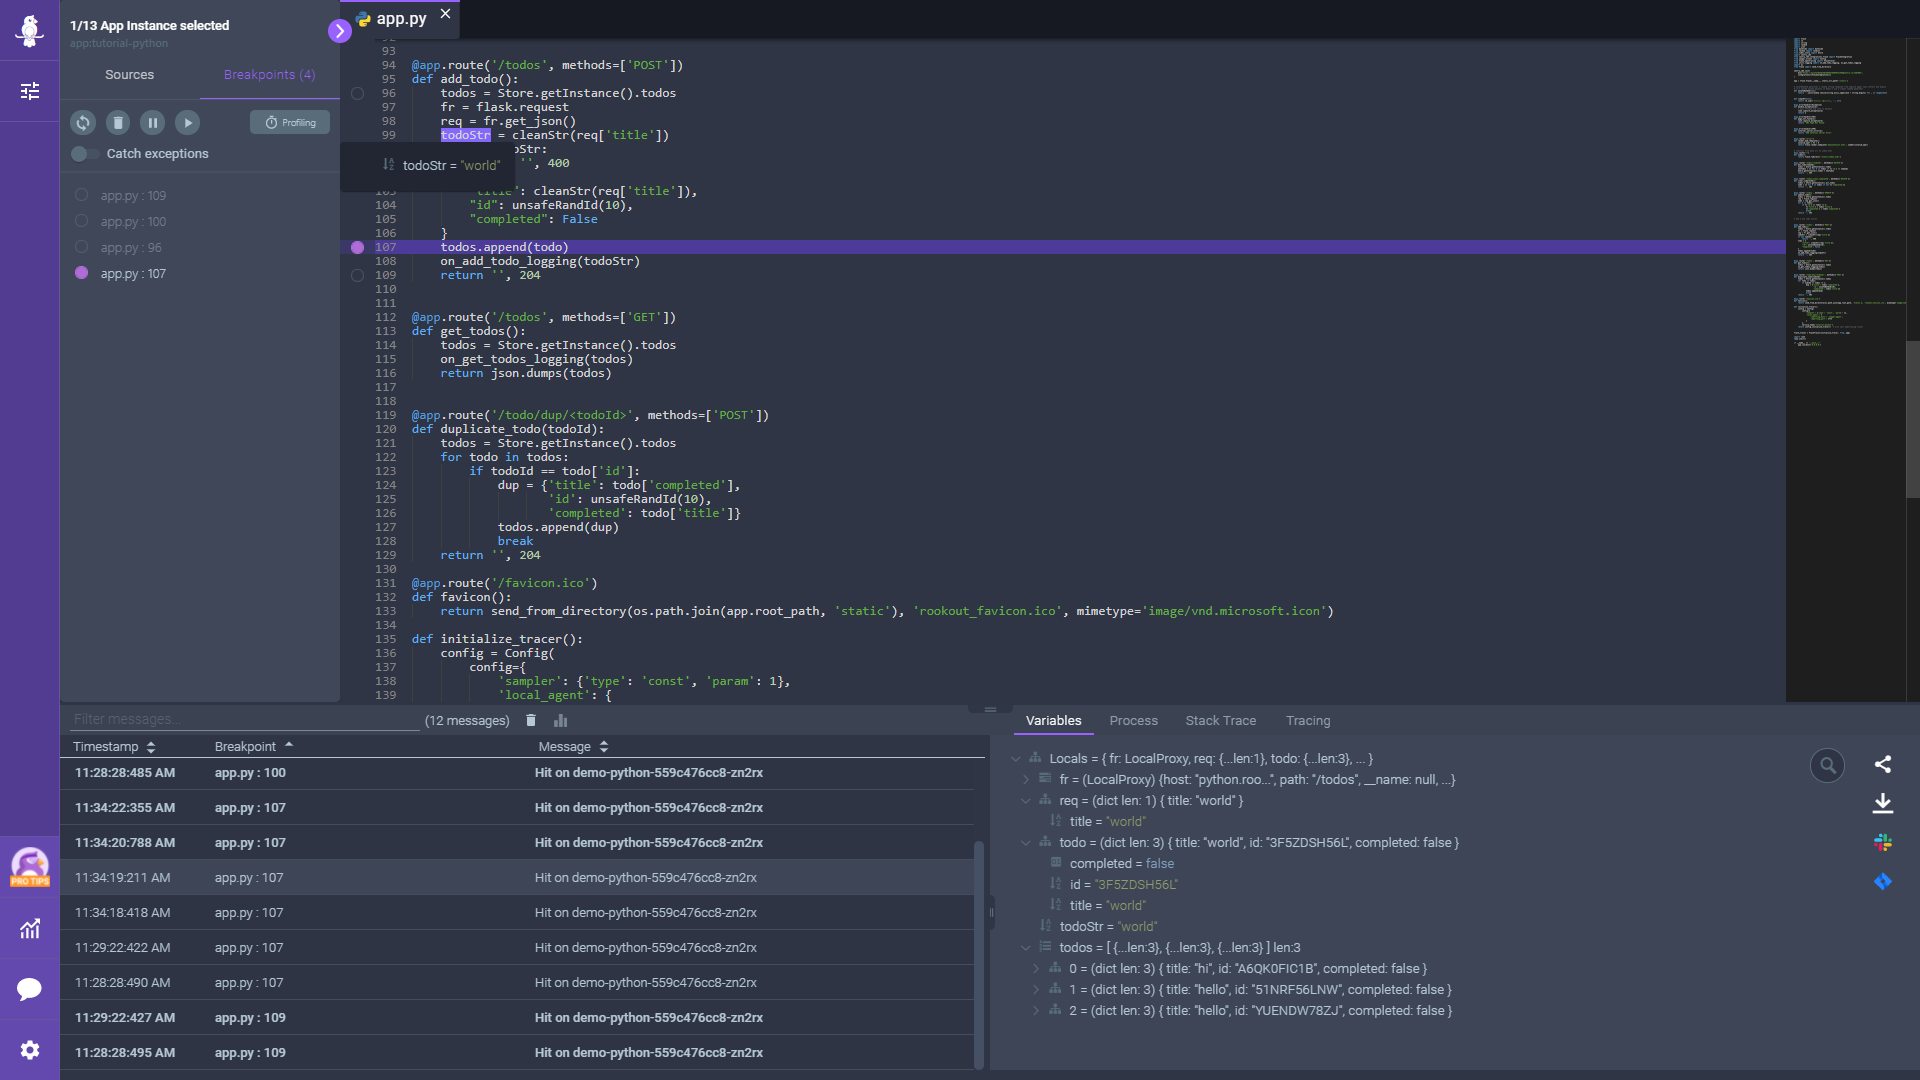
Based on the instances you have selected, the source code will be automatically loaded into your browser, and all you have to do is click on the relevant line. Once that line of code is executed, you will see a snapshot at the bottom of the screen – make sure this is the information you are looking for.
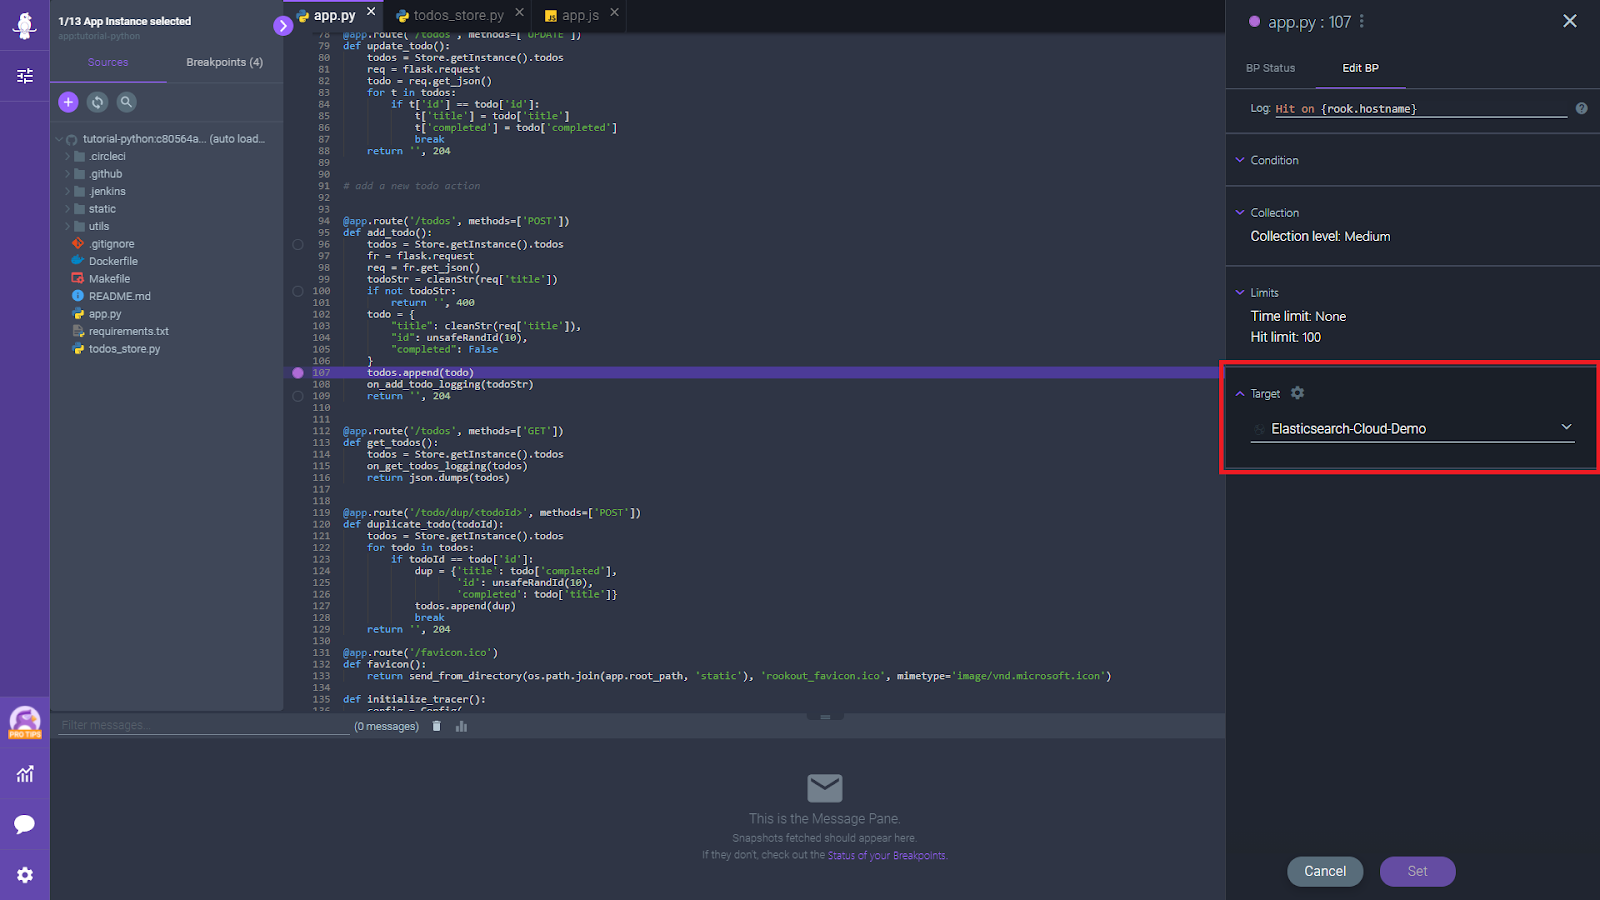
Finally, edit the breakpoint and configure it to send data to Elasticsearch, and you are done!
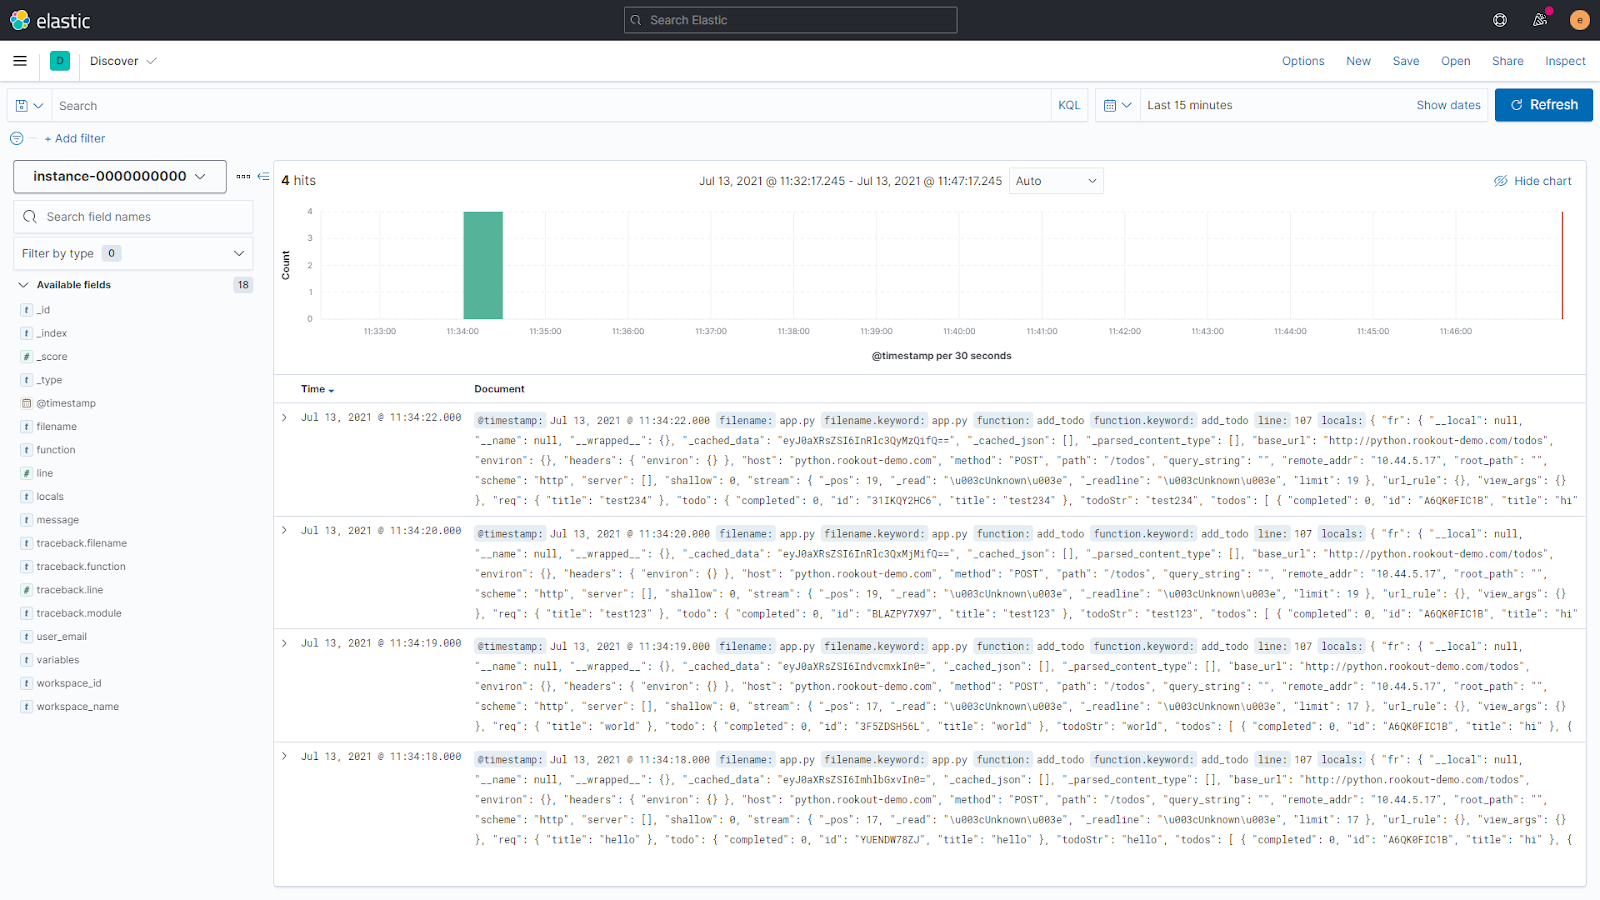
The same detailed debug information is visible in Kibana. No code change or restart required
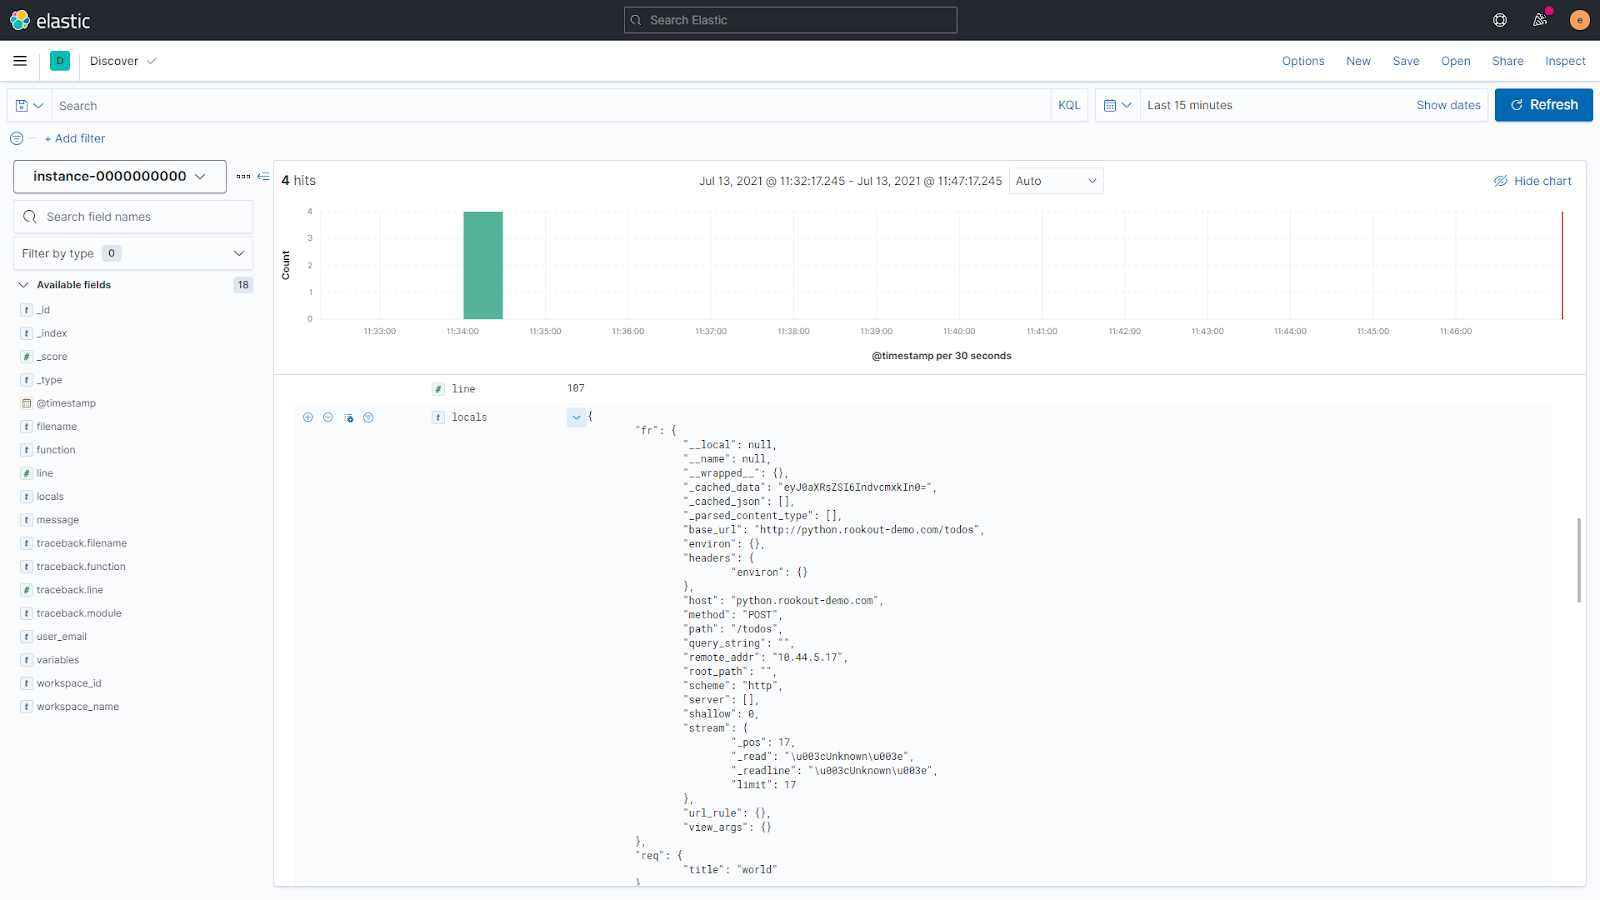
A closer look into local variables collected when the breakpoint was hit
Oh, and one more thing
We have seen how Rookout can be used to instantly switch on a newly created log line, without adding code and without stopping or restarting the app. This is very useful in cases where the data you are missing is just not printed to log. That is – if the log line is just not
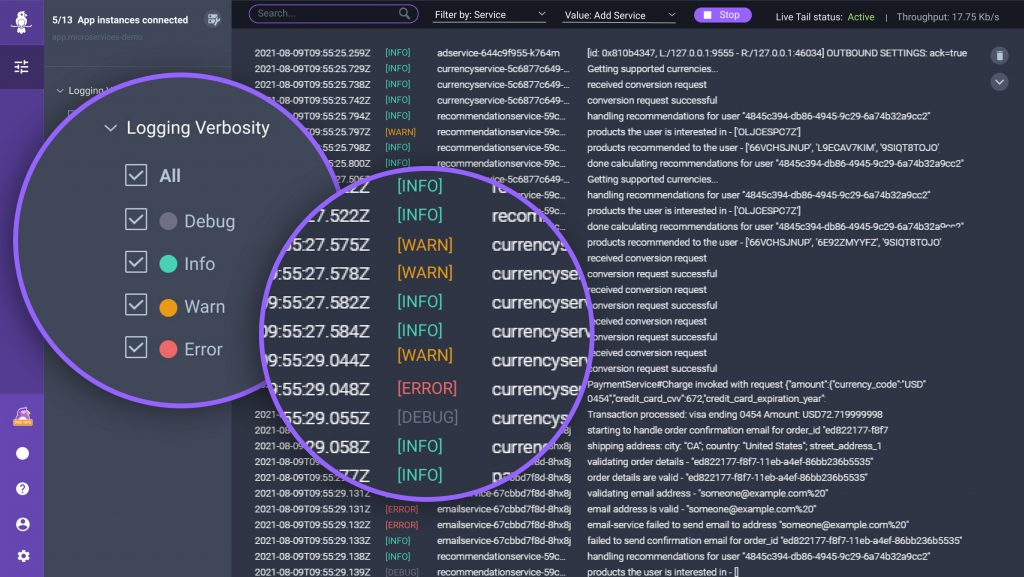
there. In some cases, you do have a log line that would have printed the missing data – for example, a log line in DEBUG or INFO level, that will not be printed when the application is running in WARNING or ERROR logging verbosity.
For those cases, Rookout has recently released Rookout Live Logger. This tool that lets engineers change log verbosity and apply dynamic, context-based filtering to existing logs. These logs can also be dynamically pipelined to Elasticsearch, adding yet another level of control over logs, metrics and traces that make up the Elastic Observability experience.
Wrapping things up
As we have shown, Rookout lets you dynamically troubleshoot and add logs in remote, live environments. The fact that you can gain extra visibility into your detailed running code without changing it and without restarting is what sets Rookout apart from traditional instrumentation methods. And by pipelining extra data dynamically into your Elastic ELK stack, we aim to provide a production-first debugging approach throughout your application development lifecycle.
Want to try this for yourself? Signup for free 14 days trials of Rookout and Elastic Cloud.
Related posts