
FOMO Is Out, Live Logging Is In – Here’s How To Cut Costs When Logging In Your Frontend
We all know that debugging and troubleshooting cloud-native environments is no walk in the park. Sometimes we forget that debugging the frontend portion of those applications is no simpler and comes with its own set of challenges. We also all know how hard it is to get logging just right: managing verbosity, volume, and usefulness to just the right level. Well, in the realm of frontend, with potentially thousands or millions of users running your code, log aggregation can easily spin out of control.
Did you ever inadvertently add a log to production that ended up creating millions of log lines? Did you ever wish you could turn on a specific log line to help resolve your specific case? Learning from our users, we came to realize that those challenges are even harder to meet in the distributed world of frontend application development and operation.
In this day and age, companies are struggling to optimize their spend to make the most out of every dollar while achieving the greatest impact and velocity with their engineering teams. This means we can no longer afford capricious over-verbose logging and millions of dollars in log aggregation costs. We need more dynamic and granular control to ensure we’re getting the logs we need while optimizing the signal-to-noise ratio.
We need Live Logging. We need it for the cloud. We need it for the frontend.
Live Logging
After all, when going through Kibana we are only seeing a fraction of the logs we should have at our fingertips. Traditional, static filtering, usually limits us to INFO level logs at best, and ERROR level logs at worst. And so much of the data we actually need to understand what’s going on in instant resides that unattainable DEBUG level.
Live Logging is about changing all that. It’s about running those queries in real time on our running application(s), to get everything we need. Whether we are looking at a specific account, user, or source file, we get full verbosity logging.
Even better, this means we can give up on that dreaded logging FOMO, and reduce the verbosity of our most noisy, and yet, rarely useful log lines. This is definitely the season for saving on unnecessary spend.
What About Frontend Logging?
So far, at Rookout, we have been all about building the best developer-focused Observability tool for cloud-native applications. And yet, Live Logging goes way beyond the cloud. Starting today, you can easily add Live Logging to your frontend with just a few lines of code:
const rookout = require('rookout');
rookout.start({
	token: "your-token",
	console_live_logger: true
}).then(() => {
	// your app logic here
});
After adding the required code, you can start your app! In order to enable Live Logging, you should go to Rookout and click on the ‘Live Logging’ tab on the left side of the screen:
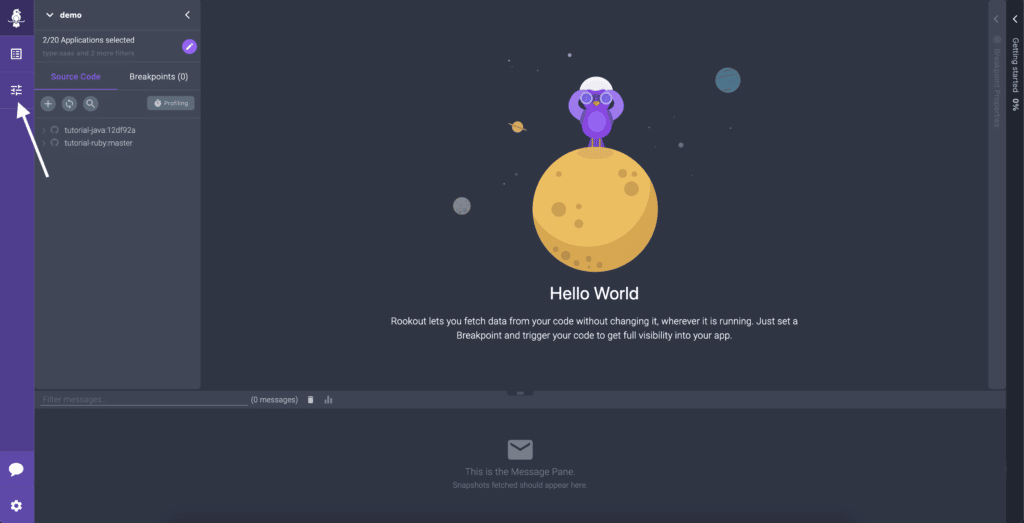
Once you are there and your app is connected to Rookout, you can enable Live Logging by pressing the ‘Start’ button:

When you’re all done, you can stop Live Logging by clicking on the ‘Stop’ button:

TL;DR
Eliminate the need for your developers to decide in advance how much log verbosity to run with, and make it available on demand, whenever they need it. By having all the data they need at their fingertips, both your frontend and backend engineers can make data-driven decisions and solve bugs faster. And the best part? No longer do they need to worry about not having added enough log lines and racking up logging costs.
And what if you want to continue investigating? You can pipeline your new debug data to any organization you need and analyze that data side by side.
Check out the full video on Live Logger’s support for frontend here – and, as always, reach out if you’d like to hear more!
Related posts