
Making The Right Choice – Speeding Up Your Application Selection
There’s nothing worse than creating that perfect cup of coffee, sitting down, putting yourself into the mindset of digging deep into your production environment, and…nothing. Because your application is a complex living beast and seeing how all the pieces fit together is often more than you’ve bargained for.
While trying to figure out what’s what, your coffee is growing cold, and you’re becoming increasingly frustrated. Those Slack notifications are piling up, those Jira tickets aren’t going away, and you’ve just burned through more time than you cared to.
Sound familiar?
The first thing you have to do in every troubleshooting session is to gain a sense of the puzzle in front of you. Unfortunately, in modern cloud-native applications, troubleshooting is often easier said than done. This is where we, as Rookout, felt we had a unique opportunity to make things easier for our customers.
Making Live Debugging Even More Intuitive
As a developer-first observability tool we map all our customers’ code across all their microservices and environments. Now, we’ve made that information easily available to all of our users to help them gain a better understanding of their applications and make their debugging sessions even more productive.
At the core of it, we’ve added a new screen that allows software engineers to easily slice and dice across all their running applications, see how everything comes together, and even know exactly what version of code is running where.
What does this look like? Well, I’m glad you asked.
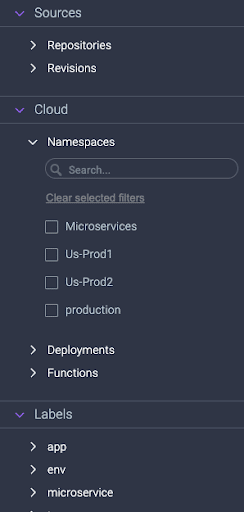
1. Structured Facets & Categories: these new facets and categories are intended to help the users to explore, discover, and review the various values and properties of their applications that are divided by structured sections. Users can use them in the application selection to search within the application values, define a specific set of applications to debug, and learn about their applications.
2. Active and inactive applications: the use of the new toggle will allow users to easily navigate between two different modes: seeing what’s running right now versus seeing all the applications that have recently run. Looking at an inactive application is useful when working with Serverless, batch, and other kinds of cloud-native applications that aren’t continuously on.
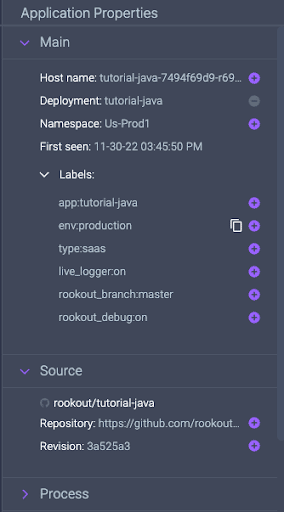
3. Application properties: with this, users now have copious amounts of knowledge at their fingertips. The new properties pane will provide essential information users need to understand and debug cloud-native and Serverless applications. This includes everything from hostname, Kubernetes and Serverless metadata, custom labels, to process command line, and even the exact source code revision!
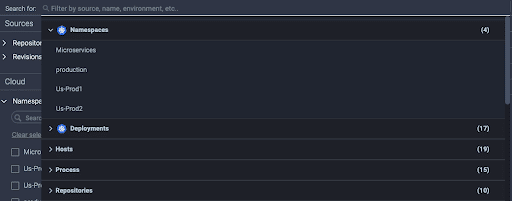
4. Free Search Ability: users can free search whatever they want, by Key or Value, and by a specific application value or category. This helps the users explore and discover their different matched applications.
On top of everything else, this new experience allowed us to bring to life our #1 feature request – easily selecting multiple microservices for simultaneously debugging cross-service requests in a seamless manner.

The TL;DR
Gain an unprecedented view of your application with our brand-new explorer. See where your code is deployed and how everything comes together. And remember, live debugging is always just a click away.
Want to learn more about how it works? Check out this video or talk to us.
Related posts