

Cloud Logging: machines first, humans second
Logs. Do we really need them? As developers, we write the code and the tests, and everything seems to be looking great. Why then, do we need to spend even more time writing a bunch of lines nobody is ever going to read?
Recently I did a talk on the subject at StatsCraft (check out the slides here). This post, a summary of the talk I gave, will discuss why we need good, informative logs, and how we can write them well enough. I’ll also cover different tools that might just take your logging to the next level.
Logging for humans
Usually, one can divide the logging journey into three stages. First is no logs at all, aka ‘logs are for losers’: at this point, the developers simply don’t believe in the importance of logs. They often realize their mistake only when it’s too late, both figuratively and literally: usually sometime in the middle of the night when something fails for no apparent reason.
The next stage is bad logging: the developer is adding some unhelpful log message. For instance: Something bad has happened. This isn’t really useful, but it is still better than no logging at all.
And finally, the stage we all want to reach – good logging: here we understand logging is important and start writing descriptive messages. Something like:
Org name is not valid, org_name=”hello world”, timestamp is 1989/11/11
So how do you make sure you’re always at the ‘good logging’ stage? It might help to remember the following:
- When writing logs do not think of yourself but focus instead on the dev that will probably encounter that log later on. Would you understand it out of context if you were in his/her shoes?
- When unexpected things happen – you should log them. Let’s keep surprises to the bare minimum, especially unpleasant ones…
- Each log should contain as much relevant data as possible. You can’t have too many relevant details. Every little piece of data can be crucial when something goes south.
- It’s OK to add and remove logs. Logging is dynamic – in order to increase visibility or reduce noise, add and remove logs whenever needed.
Logging for machines
The world of logging for machines is full of possibilities. In most cases, data is going to arrive at some sort of centralized logging system such as ELK, Logz, Splunk, etc. We now have visualization, alerts, aggregation with other logs, smart search, and much more. As you may know, these features are missing when writing a log that is intended to be readable by a human. So how can we make logs better for machines? A good start would be to remember that the King of logging for machines is, of course, JSON.
In order to better understand our logs’ context, it’s wise to add as much information as possible:
- Adding request-related fields: org name, IP, user email, time, etc. This will allow devs to understand how, when, and who this log refers to.
- Per env – commit hash, GitHub tag, machine name. This will allow devs to understand if the problem is something new/sporadic (per machine), or something that happens across all machines.
- Use a smarter logger to get better logs – “for free” 🙂
Machine logs
Python – Structlog: `structlog` makes logging in Python more powerful and less painful. With it, you can add structure to your log entries. If you wish, `structlog` can take care of your log entries output. You can also choose to forward them to a preferred logging system.
There are several advantages to smart logging:
- it’s easy to implement and use. Its interface is very similar to the ‘regular’ logger, with more capabilities:

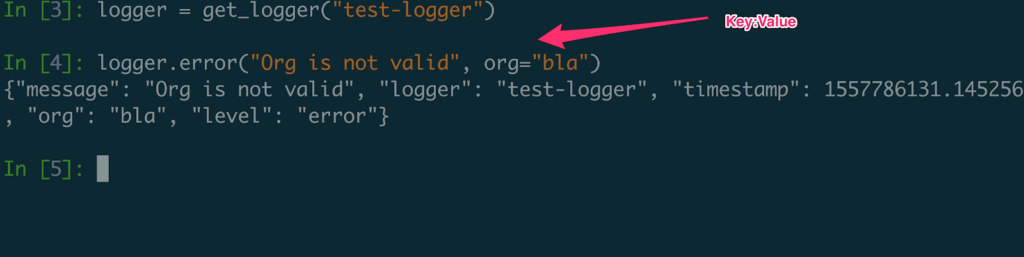
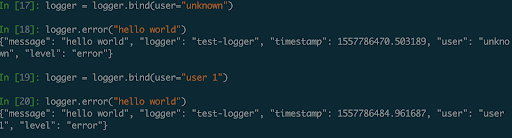
- Data binding. Since log entries are dictionaries, you can start binding and re-binding key/value pairs to your loggers to ensure they are present in every following logging call:

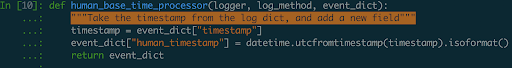
- Powerful Pipelines. Each log entry goes through a processor pipeline which is just a chain of functions. These functions receive a dictionary and return a new dictionary which gets fed into the next function. That allows for simple but powerful data manipulation. Old log:

- A log enrichment function (happens once per log):
- New log:

Similar logging infra exists in any language: Golang – Logrus, JS – Winston, etc.

Distributed tracing: or as it’s often called — request tracing. This method can be used for profiling and monitoring apps, mostly those based on a microservices architecture. Using distributed tracing can help track down the causes of poor performance and the exact spots where failures had occurred. This method allows devs to track requests through multiple services, providing various metadata which can later be reassembled into a complete picture of the app’s behavior at runtime.
Logging for everyone, on-demand!
Logging data in advance can be challenging. So what happens if you forget to set a log line and things come crashing down? Or when the only log you have says Something bad happened? Luckily, there are tools you can use to quickly get the data you need from your application while it’s running.
Stackdriver: If your app is running on Google Cloud you can use Stackdriver to get data from your code using breakpoints in production. However, it is geared towards helping devs integrate with the Google Cloud platform, and isn’t meant to be used as a general data collection tool.
Rookout: Set non-breaking breakpoints in your production code and get any data you might need – in an instant. This means you don’t have to write extra code, restart or redeploy your application. Just click and get the exact data you need in real-time. Rookout works on all clouds and platforms seamlessly: On-Prem, Monoliths, GCP, Azure, AWS, AWS Lambda, ECS, Fargate, etc. You can also pipeline your data anywhere it might be needed: DBs, APM, logging, exception manager, alerting, etc. Moreover, your data doesn’t have to go through the cloud at all, or even through Rookout’s server. You can drive data directly to your final target, even within your internal network.
Among the unique aspects of Rookout as an infrastructure solution is adding a temporal aspect to logs. Suddenly, developers can say and apply things like “I want this log for only a week.” “I want these data snapshots only when a specific condition happens.” “I want this data to be collected until an event happens,” or “I want this service to collect data until another service decides otherwise”. Rookout completely changes the way we can think about logs.
We’ve come a log way
Driving logs down the river of time, we’ve come a very long way. From simple human text lines, through smart, best practices, structured data, processing pipelines, tracing, to on-demand logging for everyone with a click.
Every step in this journey is a step in the evolution of software, both as a whole and per project. No one can be certain if this journey has an end, but the ride and every step of the way sure get easier with each log line.
Related posts


