
Making Rookout’s Breakpoints Even More Non-Breaking
Stop me if you’ve heard this one before.
You’re debugging a local app using your favourite IDE. You set a breakpoint, the code stops, and you look at the local variables. You get a sense of what’s going on, what has happened, and what should happen next. Then, you step forward to the next line of code, and the one after that, and the one after that, and the one after that is invoking a function, so you step in again…
If at first you don’t succeed, step in again
Well, at least, you try to step in. But the function you are invoking came from a third party class, and you don’t have the source files. Or maybe it was compiled or transpiled in a way that doesn’t allow debugging. Maybe you’re missing some of the debug information files, or they were generated from a different version of your code.
The best-case scenario here is that you find the debug information or source files, and try again. Maybe you even rebuild the entire project to get the full debug data. The worst-case scenario is that you are just unable to debug.
The bigger problem of data availability
Of course, the above is a simplified and local version of the bigger problem that we are trying to solve with Rookout. We want to make sure you can always get the data you need so that you can always get full visibility into your code. And like many other things, this challenge becomes even bigger when you are building a cloud-native app; when your app is already running in staging and prod; or when you’re looking at a huge monolith that someone else wrote.
In those cases, there are even more things that can stop you from seeing the data you need. For a start, there could be multiple instances of the app you are trying to debug. And each instance could have a different version of the code or a different configuration. Some of these instances may not yet be up at the time of setting the breakpoint, and others may be torn down after it’s been set.
So which instances should Rookout fetch data from? And which instances may require your or your DevOps team’s attention in order to guarantee observability?
Breakpoint status breakdown capabilities
To address these concerns, we have invested significantly in improving our Breakpoint Status Breakdown capabilities.
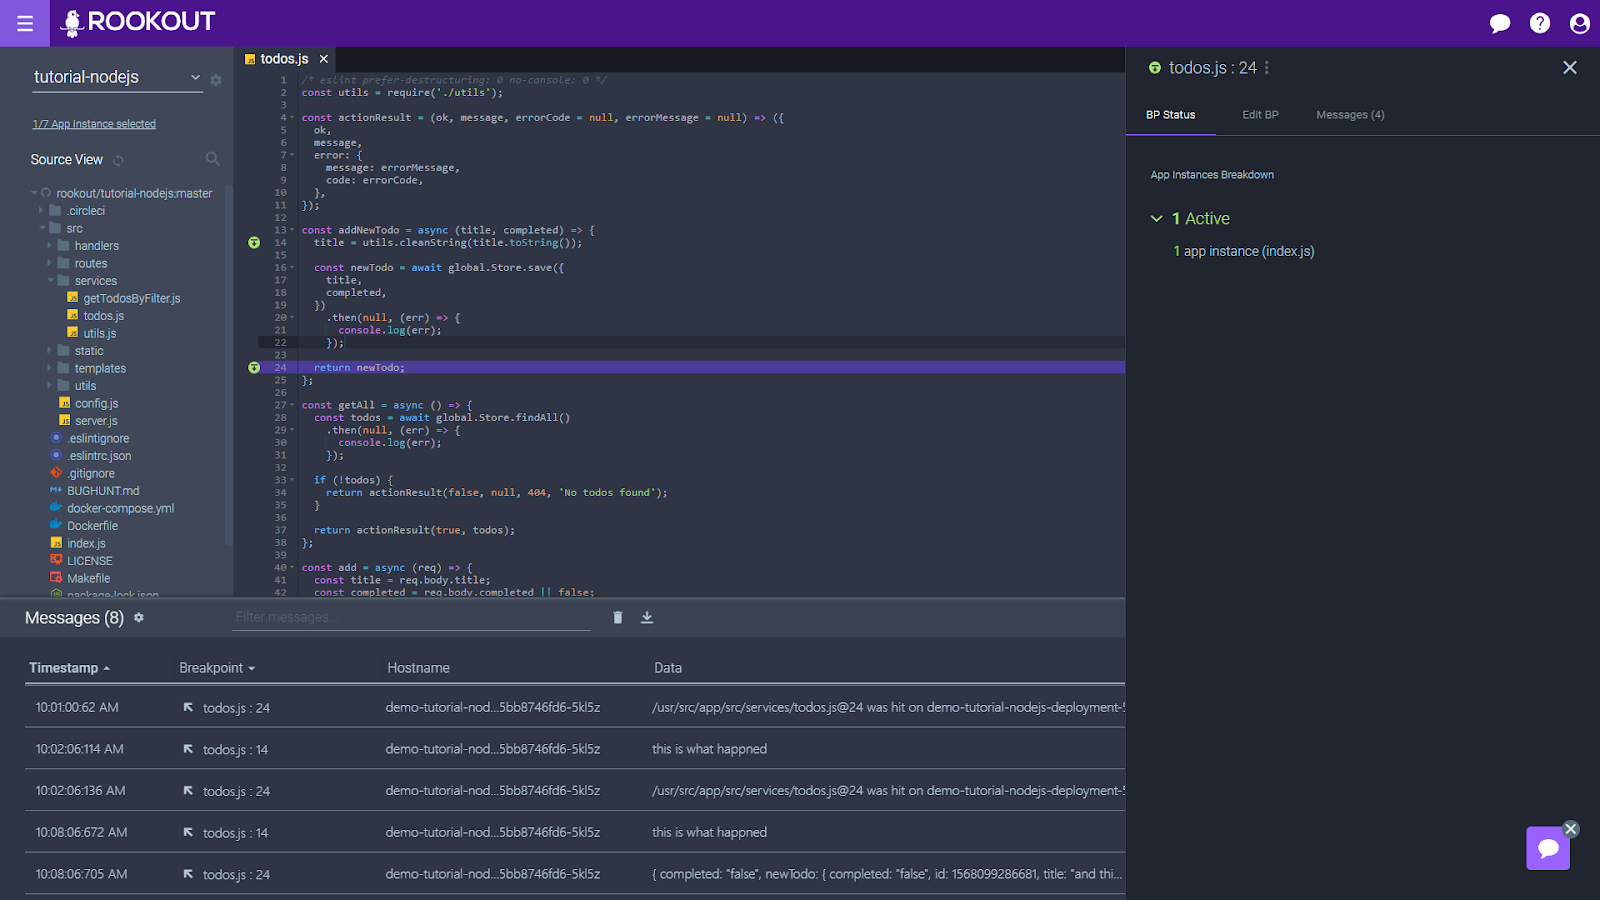
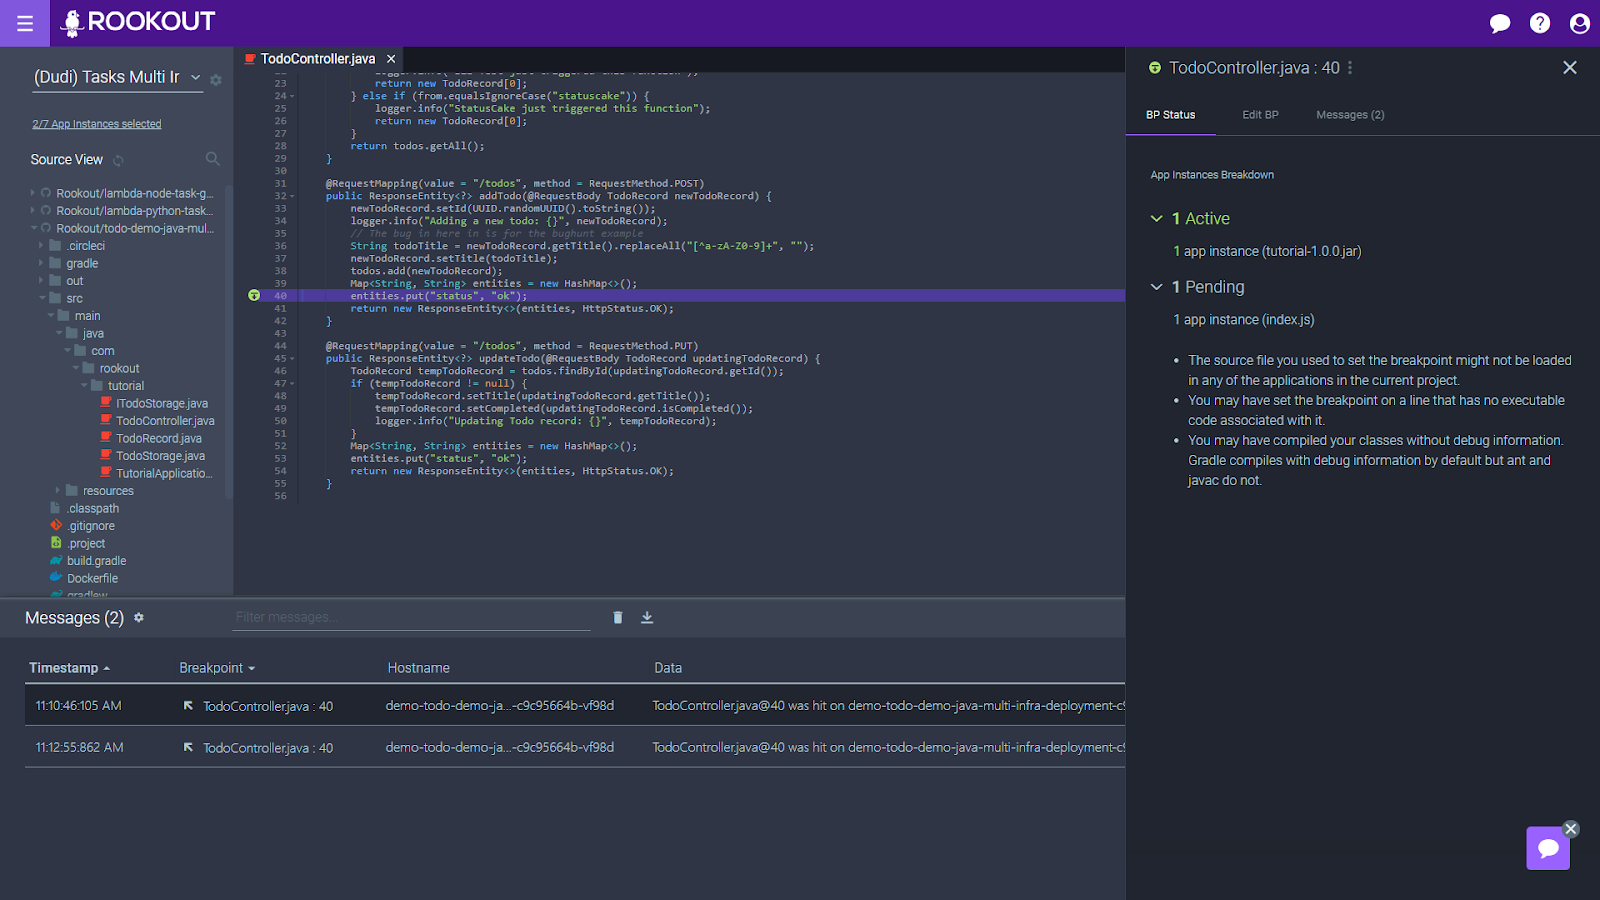
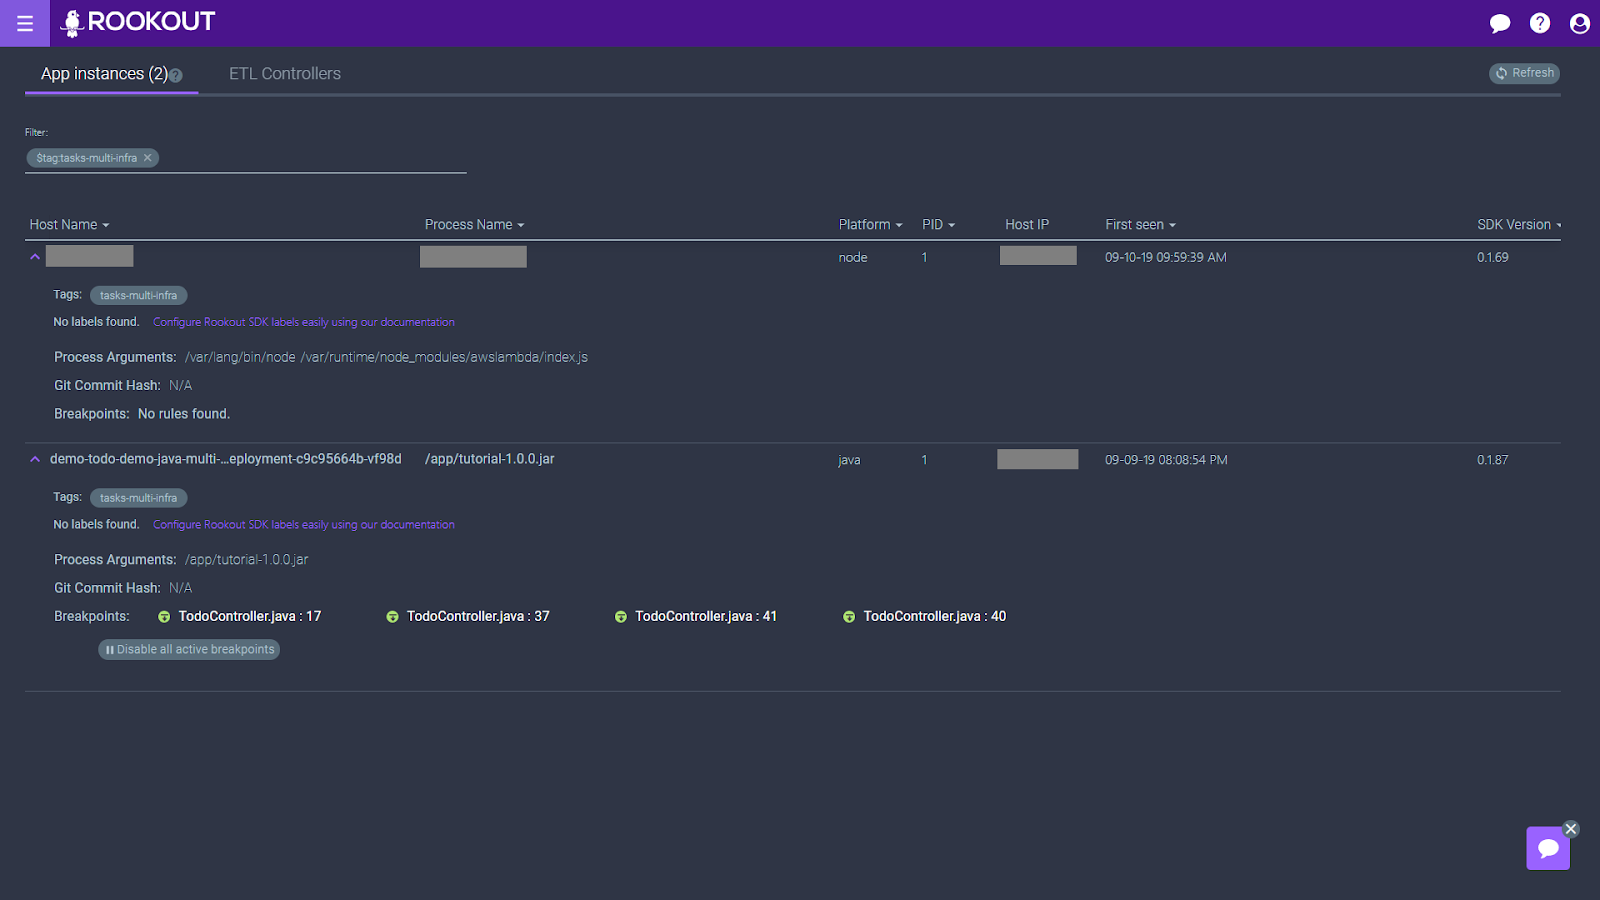
Now, expanding the Breakpoint Status pane will show you the following:
- How many instances of your application has the Breakpoint been applied to?
- Did Rookout fail to apply Breakpoints to some of these instances, for example, because they are running a code version that does not match?
- Which instances have such problems, and how do I spot them?
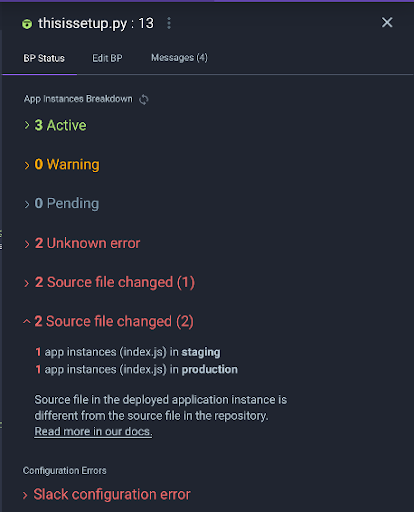
With this information, we hope you will gain some insight into your app even before you start getting debug messages or log lines streamed into your observability pipeline. For example, you may discover that you see more instances or fewer instances than you expected. Or you may find that some instances are not deployed in the right environment, or that they aren’t using the right code version.
In fact, as we rolled out this functionality, we have learned that some of our customers even use this ability to keep an eye on their CI/CD flows, giving their DevOps team a quick health check of their current deployment.
BP status breakdown for Rookout deployment
The breakpoint status should also allow you to troubleshoot your Rookout deployment. If you are missing the debug messages and log lines you were expecting, the breakpoint status indicator may hint at the underlying reason.
In some cases, we learn that the Rookout SDK was just not installed on the relevant instances, or that it cannot reach Rookout due to network connectivity issues. In other cases, we learn that specific frameworks behave differently than expected when we baked them into our app. If you are using Python forking servers, or Node.js transpiling frameworks, you may have already faced these challenges.
We hope the new breakpoint status breakdown view will help you understand what’s going on when you set a Non-Breaking Breakpoint, and that in turn, will help you gain the observability you need. If you have any questions or suggestions, be sure to give us a shout!
Related posts


