
Remote Debugging: Everything You Need to Know
Nowadays, the term ‘remote debugging’ instills fear into even the bravest of dev hearts. Palms sweaty, knees weak, and arms ready (to code) they dive into what they’re sure will end in much pain and possibly a few broken pieces of code. This scenario and these feelings are common to devs everywhere, where many opt to take the trusted path of debugging on their *own* machines. While this may be a tried and true method, the future of debugging is here and, you’ve guessed correctly, it comes in a remote form (cue heart palpitations).
Service architecture has become increasingly complex and the old days of monolithic applications are behind us (well, not entirely, but that’s another discussion for another time). With the rise of new software techniques such as microservices or serverless, not only has the way we write code changed, but also the way we debug it. This change necessitates taking a leap of faith to try and adopt new means to work the bugs out of the system. Enter remote debugging.
In simple terms, remote debugging is debugging an application that runs in a place other than your local environment. This is usually done by connecting the remotely running application with your development environment. Intrigued but also a little terrified? We get it, but don’t run just yet.

When Should You Use Remote Debugging?
If you are a developer or an executive (or both), you know that debugging is crucial. Even more, you understand that while classic debugging might be yielding results now, remote debugging – when done right- can save you a significant amount of headache and time. Remote debugging becomes crucial at some point for you, whether it’s because of difficulties you’ve encountered with classic debugging or the simple fact that the classic debugging method has become near impossible to use.
Believe it or not, there are high chances that at one point you used the technique of remote debugging without even realizing it. Crazy? Not so much.
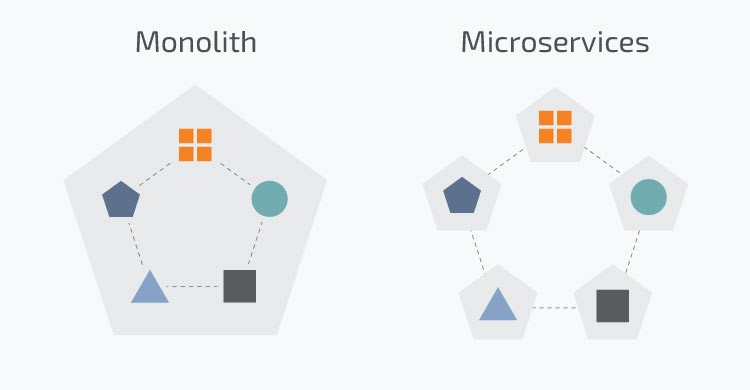
For a deeper understanding, let’s look at the problem with the old way of troubleshooting the code for modern software architecture. Let’s take a look at microservices, given that this method has been used by developers for a longer time than the serverless approach.
As we know, microservices came into place as a solution, as well as a substitute for monolithic applications. At its core, this technique is defined by the following principle: divide a big application into smaller parts that are easier to manage, and distribute the workload among developers.
As you can see in the below scenario, the application is distributed, thus making it much more difficult to reproduce a bug, due to the simple fact that it’s difficult to trace it back to the source. On top of this, logging is decentralized and harder to analyze.
If you are going to attempt production debugging of such an architecture, you will have to access and sift through many log files and write often necessary additional logs, after which you’d need to redeploy and restart your application, just to get additional data. This process is not only time-consuming but it also requires more practice and patience. So yes, we understand why you try to avoid debugging microservices like the plague.
What About a Serverless Application?
Serverless, comparatively to microservices, is a much more distributed architecture. The underlying premise of serverless is that it works by default abstraction of underlying infrastructure and abilities related to it. Thus meaning, we decouple our application at function level. Function levels are single-purpose, programmatic functions that are hosted on managed infrastructure.
The downside in microservices is that developers who are working in normal conditions aren’t able to run their processes and can’t debug their serverless applications on their IDE or local environment.
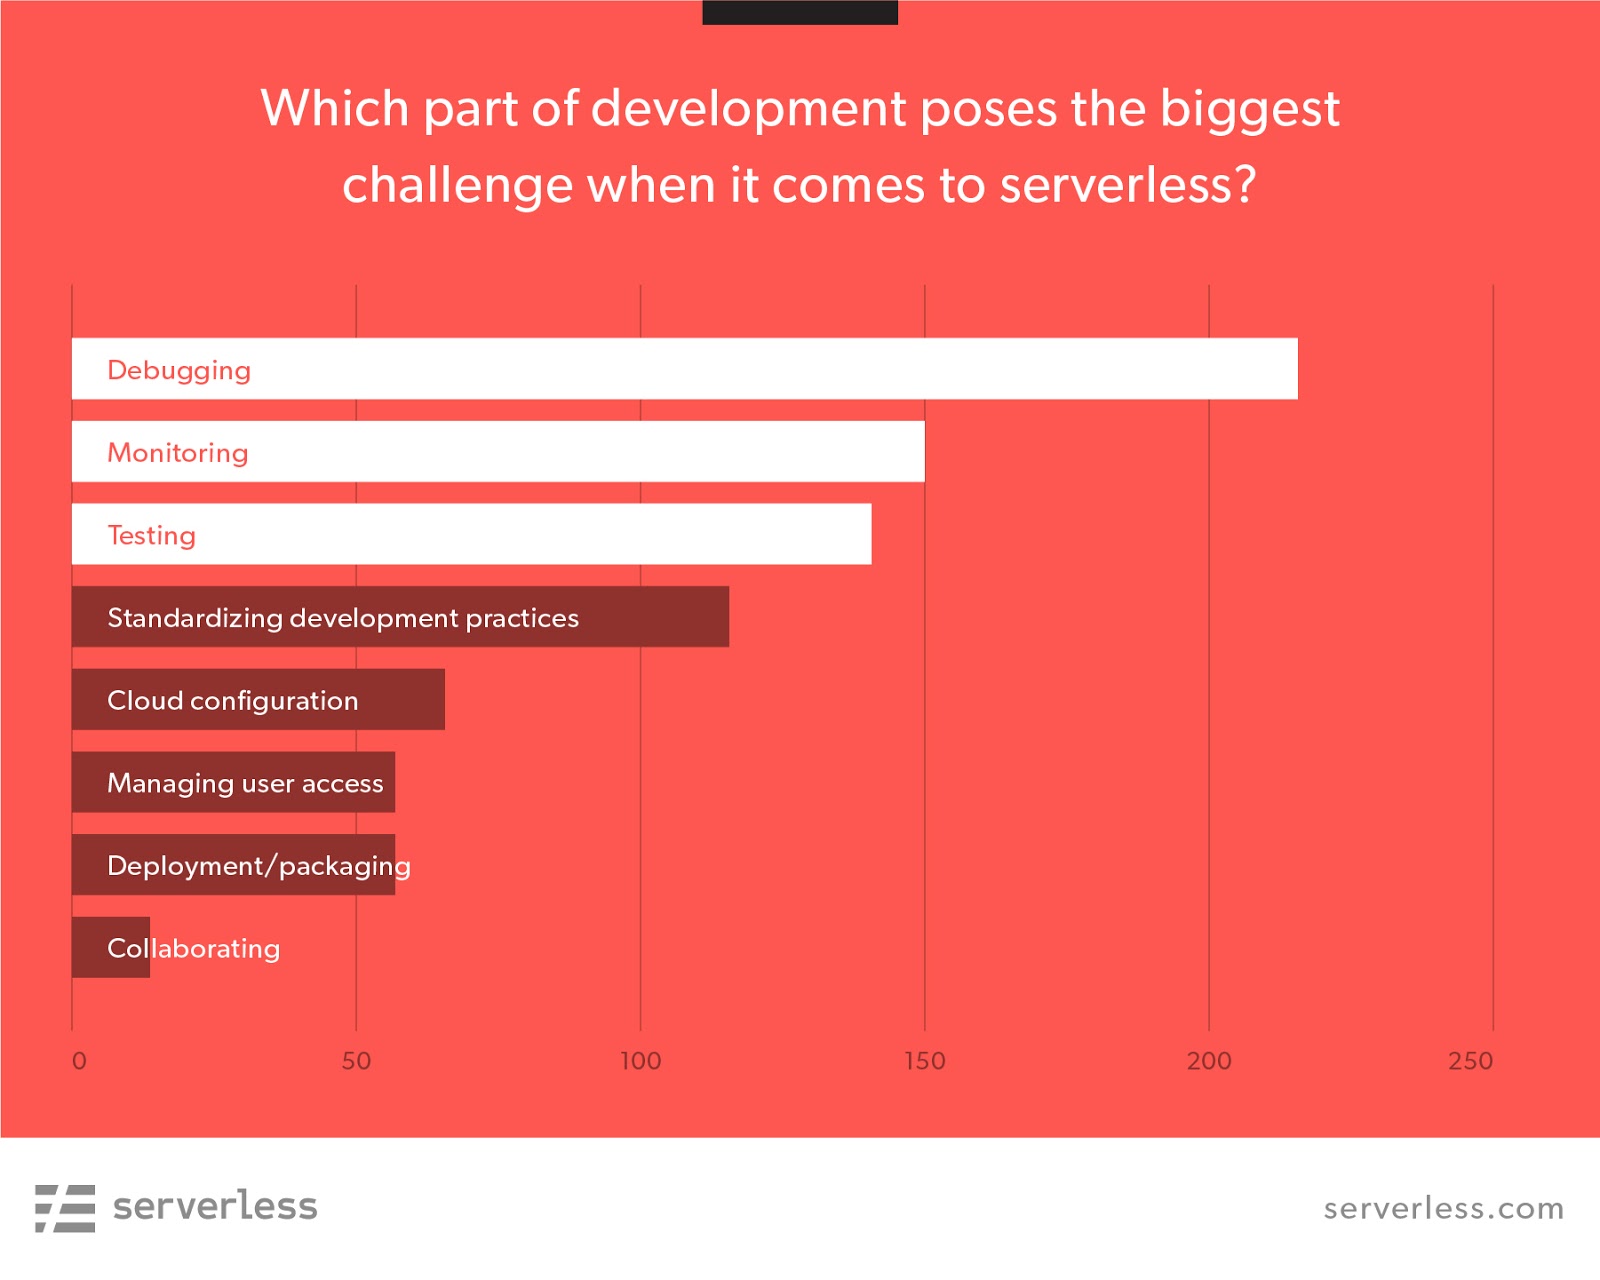
A 2018 community survey of the biggest serverless challenges showed that the most notable one to be debugging. This with the addition of monitoring and testing clearly points back to a lack of proper tooling.
These examples represent situations where remote debugging can bring surprising value, making the process simpler and faster, most significantly in cases where regular debugging is impossible.
A more classic case where this can be seen is with a web application that has a problem on mobile phones. In this situation, remote debugging with the help of different tools made available by modern browsers is the only solution.
How To Go About Remote Debugging Properly
As wise men have taught through the ages (well, the debugging ages at least), debugging is 99% about collecting data about your application until you reach the point where you figure out what is causing the problem.
Remote debugging is the same, but because the application runs on a different host than yours, collecting data from it can be really problematic and can have a lot of caveats in terms of performance.
Luckily enough, nowadays we have a powerful suite of tools that allow you to debug defective code running on a different host as if it were your local code. Yes, you read that right: remote debugging can be done so that it’s basically like classic debugging.
To properly explain, let’s go with Rookout for a demo of just this.
We mentioned that the core of debugging is represented by data collection.
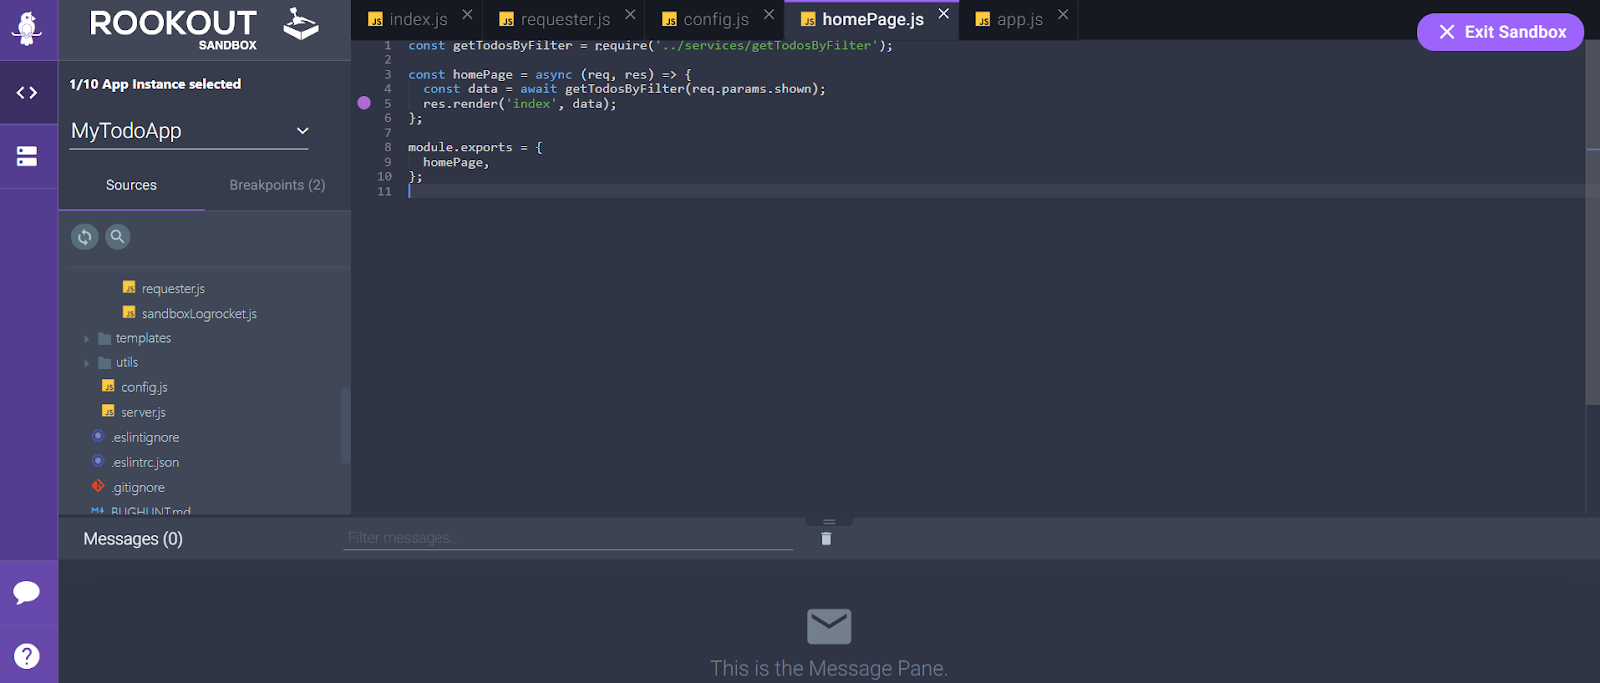
Let’s take this application for example, which is a demo To-Do application provided by the Rookout sandbox.
If, for example, we want to see the entire to-do list, which is sent to the front-end application, then all that has to be done is to set a Non-Breaking Breakpoint (similar to regular breakpoints, these don’t actually touch your code, letting you get data from your code without stopping or breaking your app) at the corresponding line. This is exactly the same action you would take had the code been running on your local machine.
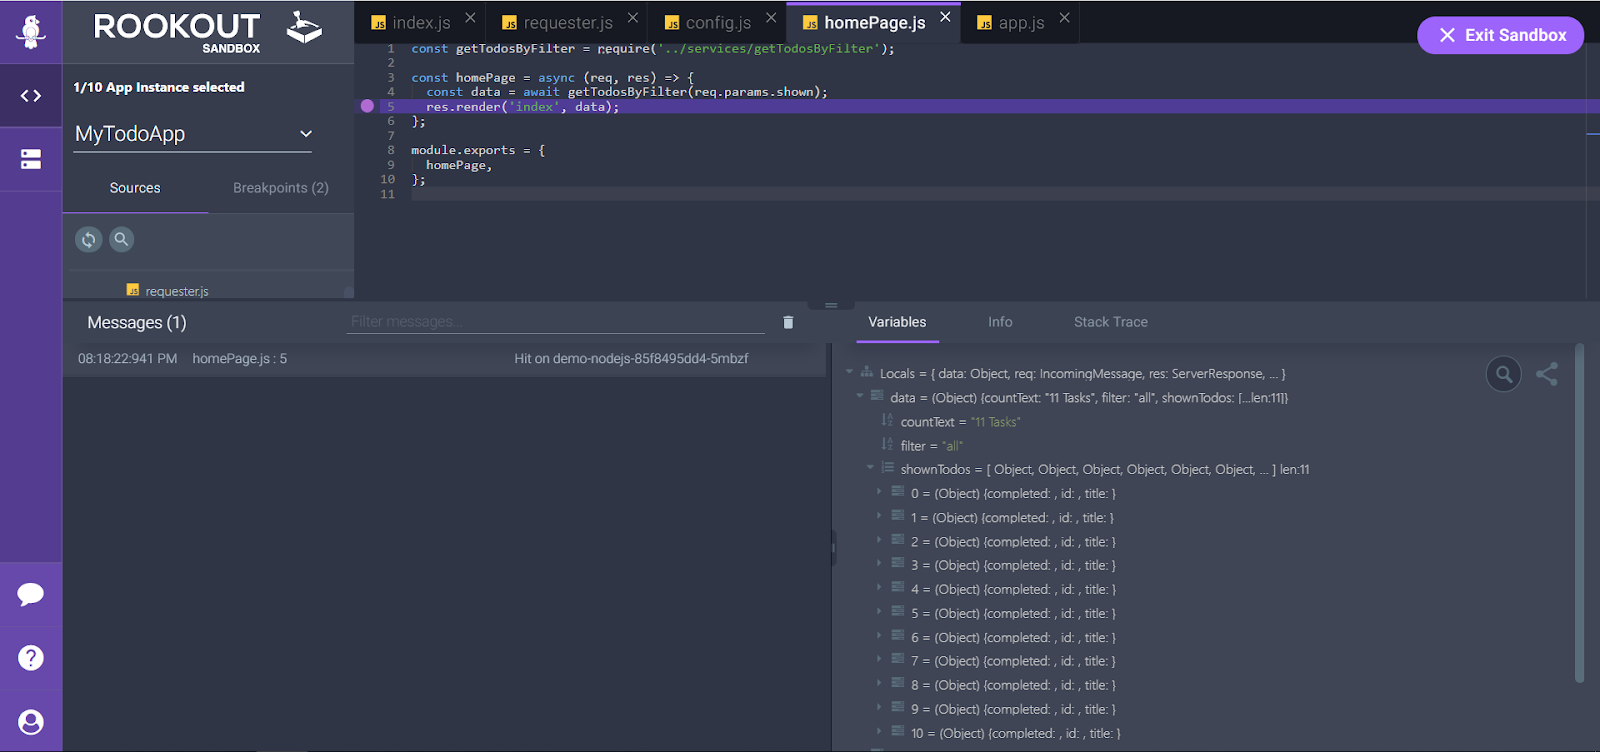
Then, when application’s page is refreshed, inside the Message tab a memo will pop up, notifying you about the data that was collected:
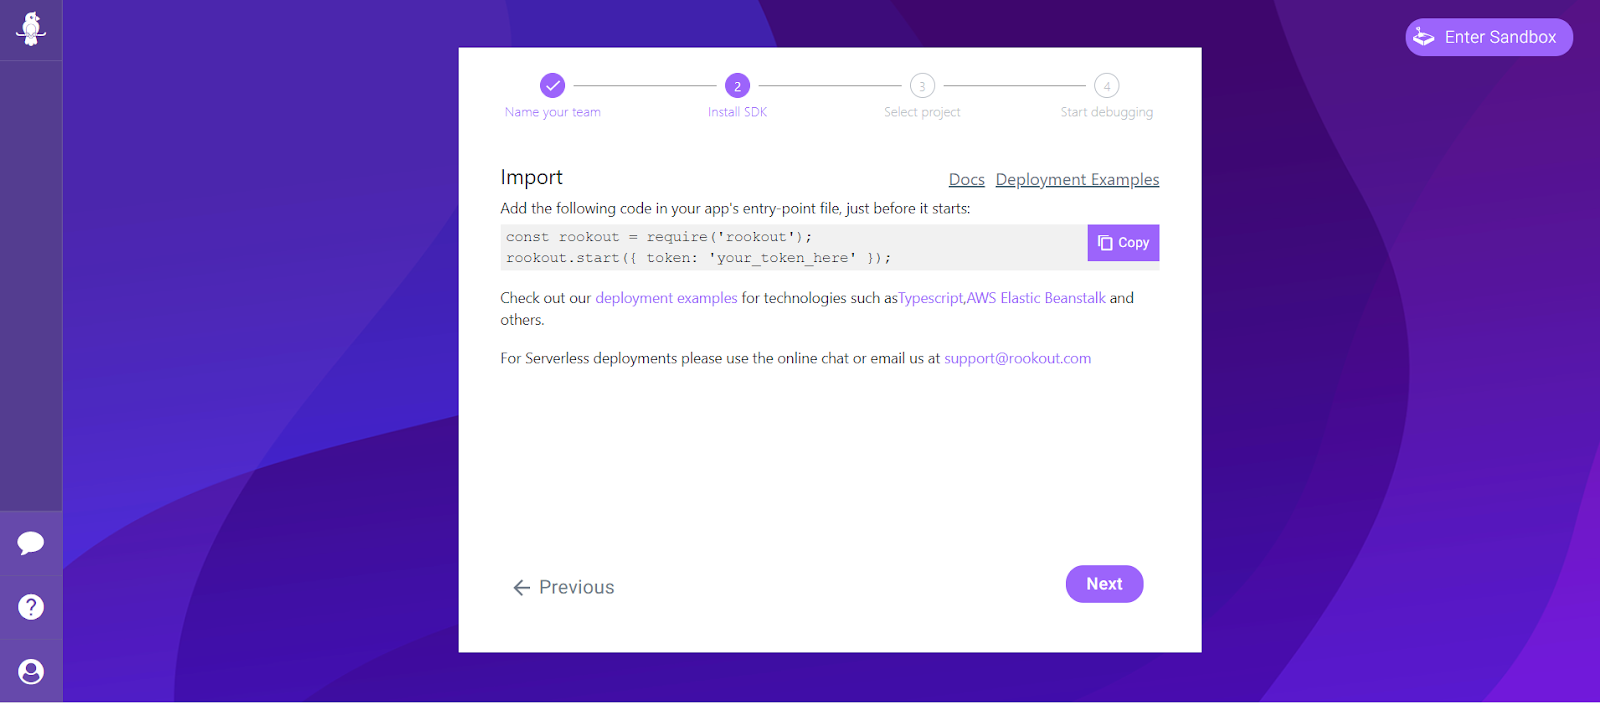
If you want to get started and use it within your application, all that has to be done is to install the SDK for your programming language and include your token (just like the below example).
There are plenty of examples of different types of architectures and languages, including Java, from which you can choose.
A simple solution
As the above examples show, Rookout allows you to debug your software remotely in production. Rookout saves the user a lot of configuration steps by minimizing the configuration needed. All that has to be done is to simply add one line of code to their app’s entry file and – surprise!- that’s it. They are able to connect to their app without changing or configuring anything else.
You will also find that Rookout doesn’t affect your performance. In fact, it adds no more performance overhead than setting your own log line. Even better, Rookout is completely secure and never sees your source code, because the source code sits between your browser and your local file system or your git provider. The sources are only for you to see when you’re setting your breakpoint. It all happens in the Front End, so all Rookout sees is the file name and line number.
Further yet, with the capabilities Rookout affords, such as data extraction, debugging, and data pipelining, hours of work are saved, and debugging and logging times are reduced by 80%. As the saying goes “time is money” and Rookout saves you having to make that compromise. Save time and money with Rookout- no compromise needed.

Debug all day, every day
As the people standing at the helm of the future of technology (okay, yes, as developers of modern applications), remote debugging comes as a handy solution for everyday problems.
We have improved the architecture of our applications, as well as the way we write and distribute code, yet at the same time we must improve the way we troubleshoot these new services or the progress will look like an unprofitable solution.
The key is speed and ease of development. Thus, when it comes to remote debugging, choose a tool that can give you both.
Related posts