
Live Debugging Gets Easier: Announcing New Rookout Plugins for JetBrains IDEs
Every developer has experienced the pain of debugging. We know that you know what we’re talking about. Who hasn’t been lost jumping between different windows troubleshooting their code, log-jammed trying to track bugs in a pile of logs, or been caught screaming at a rubber duck that’s blankly staring back at them?
But it shouldn’t be that way. Being able to troubleshoot quickly shouldn’t involve speaking to inanimate objects, pulling out your hair, or drinking gallons of coffee. It should be efficient and painless and give you the ability to dive deep into your code and understand the source of the issue, no matter when and no matter where.
Rookout’s Live Debugger has always endeavored to painlessly detect and highlight bugs more quickly and efficiently than other tools through its Web-IDE.
We at Rookout are thrilled to debut the brand-new Rookout IDE plugins for general availability. This new set of plugins makes available Rookout’s robust capabilities for debugging cloud-native apps, multiple kinds of architecture, and a swath of languages that will now extend into the JetBrains IDE family.
Now, you can give yourself the freedom to work in whichever environment, runtime, or tool you want – including within your IDE – and give developers a seamless debugging experience.
Rookout inside IntelliJ, PyCharm, WebStorm, and more
The SDLC can be broken down into dev, staging, and production/ops. However, truth be told, that regimented division leads to a false impression that certain things just don’t happen in production like they do in development.
In particular, debugging needs to work throughout an app’s lifecycle, including and especially in production.
That’s where Rookout’s Live Debugger comes in, catering you essentials like troubleshooting and debugging your app, but without editing your code, stopping your application, or having to restart it.
The IDE plugins work in the JetBrains IDE family with the following languages: Java and other JVM languages, Node.js (as well as JavaScript and TypeScript), Python, .NET, Ruby, and Go.
With these plugins, Rookout’s Live Debugger meets a developer’s preferences for their fastest, most optimal workflow. You can use it in IntelliJ, PyCharm, WebStorm, GoLand, RubyMine, and Rider.
Here, we’ll show you how to get started with installing and configuring Rookout for live Java debugging in IntelliJ.
The process is similar in the other JetBrains IDEs. You will need to install the plugin as well as log into or sign up for a Rookout account.
Installing the Rookout’s Live Debugging Plugin in JetBrains IntelliJ
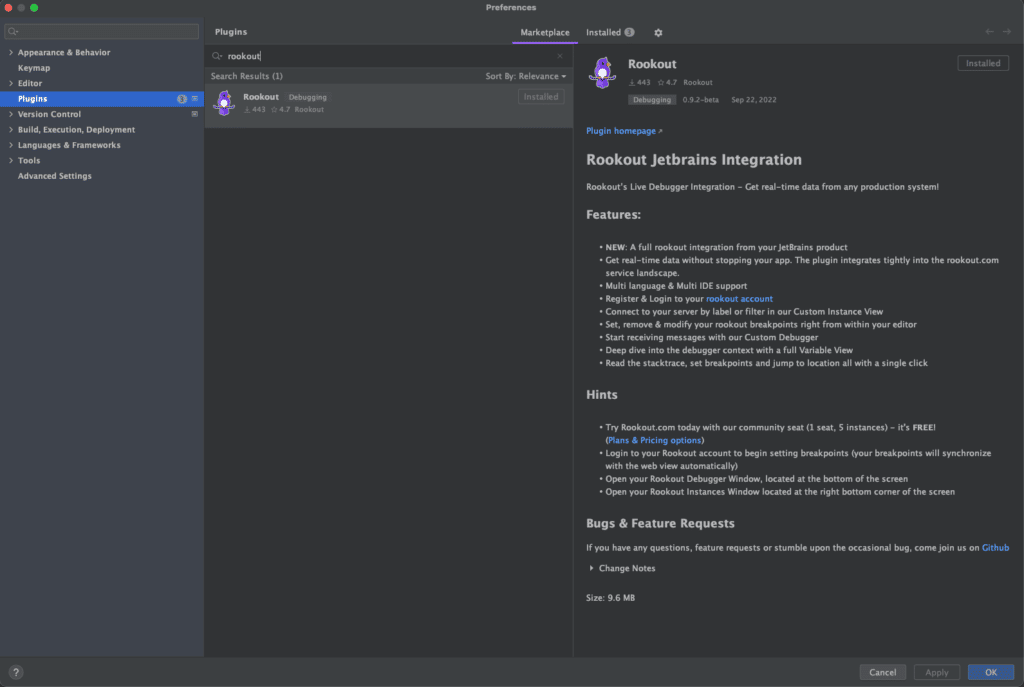
First, download Rookout’s live debugging plugin into IntelliJ. You can do that either directly from the IntelliJ marketplace, or access the JetBrains Marketplace by hitting the ⌘ and , keys. Search for Rookout, and it should pop up:
At this point, your plugin should be active. You’ll see two Rookout logos on your project screen that represent 1) the debugger itself (at the bottom) and your Rookout instances (to the right). Click on either to open their tabs.
Click on one of the tabs to see the Login button options. A browser window will open where you can sign into Rookout. Now you’ll be able to set non-breaking breakpoints.
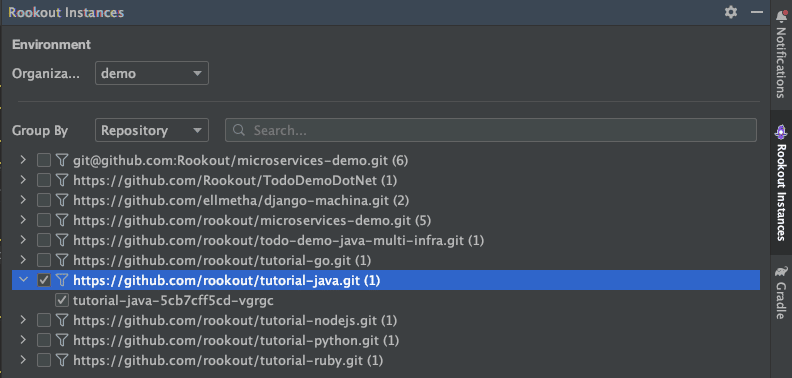
In the Instances tab, you can choose from any of the environments connected to your Rookout account. You can also choose from all the available repositories. From within that repo, pick the instance you want.
Once you pick the instance, any previous data for that instance will show up in the Debugger tab at the bottom of the screen.
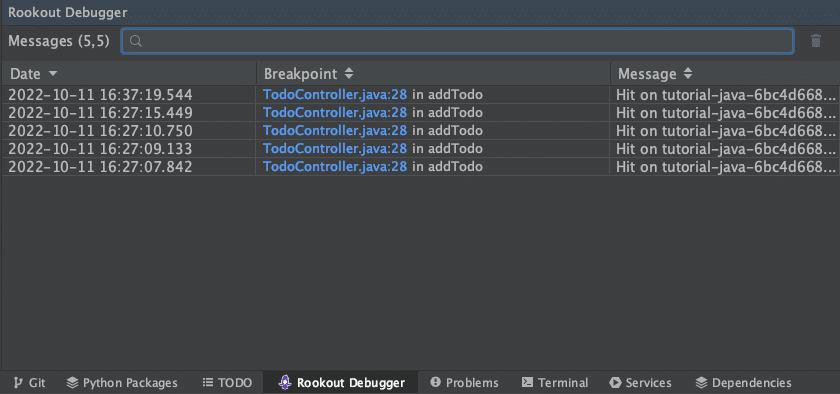
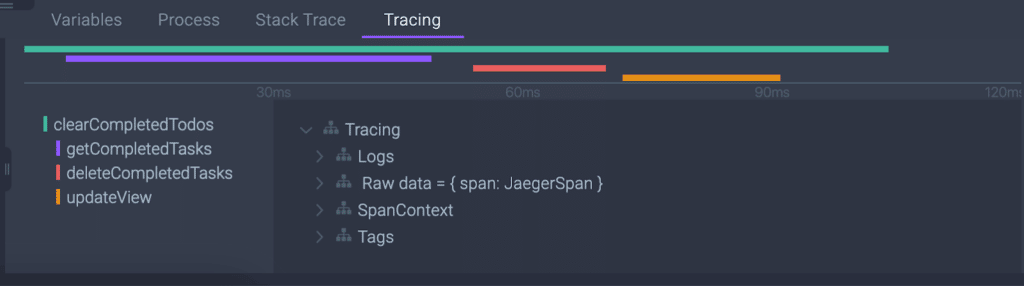
Drill down further by clicking on the breakpoint to open the Variables, Process, Stack Trace, and Tracing tabs to the right.
Configuring Breakpoints
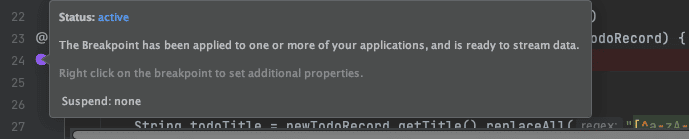
Click the left column to set a breakpoint and hover over the point to see its status.
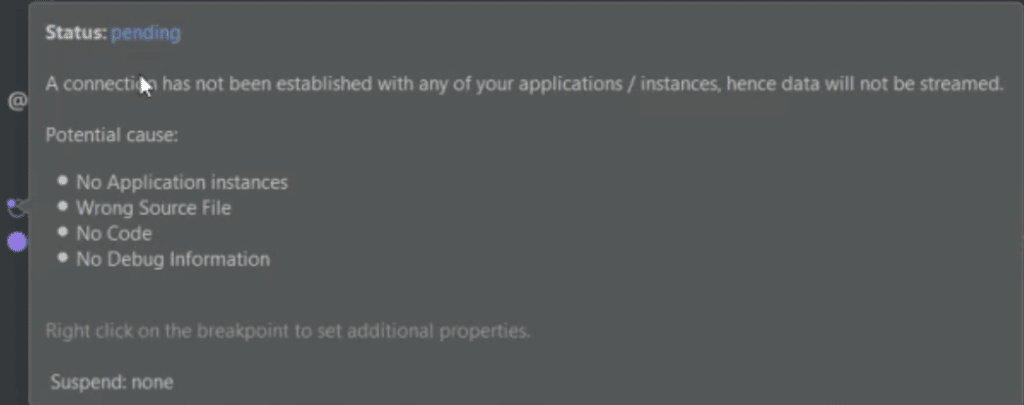
If you set a breakpoint that for whatever reason isn’t available for the Live Debugger, you’ll see an empty breakpoint symbol with a pending message.
You can also set up conditions and variables by right-clicking on the breakpoint to see a new panel. Customize the log message and set the condition.
More advanced settings are also available with more detailed log messages and conditions, hit limits, and access to collection methods for your data.
Go with the Flow into the Rookout Web-IDE
These Rookout IDE plugins extend the Rookout debugging workflow, creating a continuous debugging session from within your JetBrains IDE to the Rookout Web-IDE.
A debug process can be initiated in your IDE and should in need to debug complex, cloud-native deployments like hybrid cloud and serverless environments.
Or, if you need more visualization options, simply continue in the Rookout Web-IDE:
The new set of Rookout IDE plugins offers flexibility for anyone preferring to work within a given IDE without reopening your source code, both during a full Rookout session within our native Web IDE, or within multiple IDEs without having to shift to one specifically.
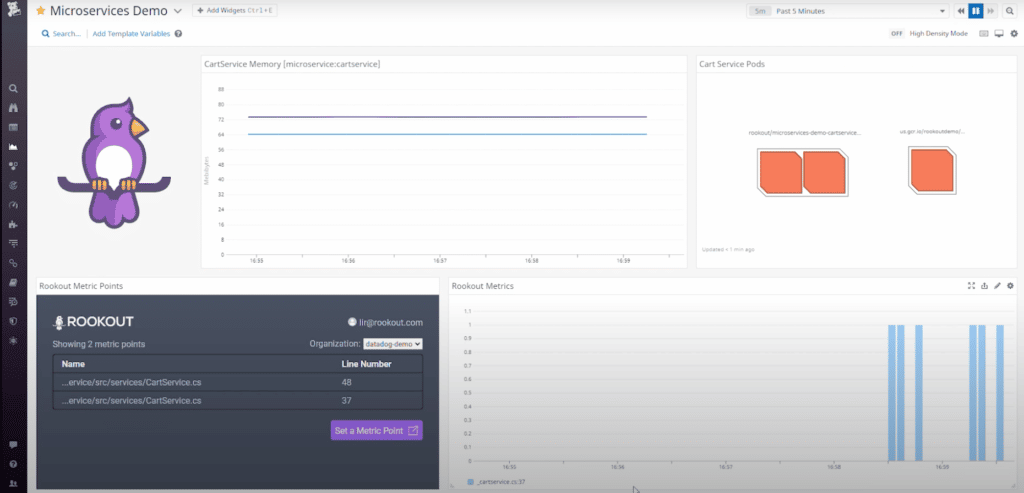
Pipeline your Debug Data to other Observability Tools
In addition, Rookout’s targeted integrations with other observability tools let you pipeline and analyze that new debug data side by side with deeper, more detailed information.
An Integrated Live Debugging Environment
At last, Rookout is available within your go-to IDE. You have the option to access Rookout’s advanced live debugging in IntelliJ, PyCharm, WebStorm, and the rest of the JetBrains library. To get a more guided tour or the new Rookout IDE plugins, checkout the video tutorial below.
With Rookout’s comprehensive and integrated coverage, you have quick and easy access to your code. Try Rookout for Free.
Related posts