
Level Up Your Serverless Debug Experience
The concept of someone else being responsible for your code is a huge relief. As a developer, having someone else handle the burden of managing the entire infrastructure that runs my code gives me more time to deal with the actual development.
Serverless debug technology benefits more than just the sole developer. It reduces cost by automatically adjusting resource allocation, abstracts both network and server management, saves complexity, and improves the overall application performance.
For these reasons and more, serverless technology has taken off in recent years, and its usage is still growing strong.
Overcoming New Challenges
Unfortunately, the adoption of serverless debug technology is not taking off as quickly as it should, according to research by the Cloud Native Computing Foundation (CNCF) in their report The State of Cloud Native Development. This is in large part due to the difficulty of understanding and troubleshooting problems within AWS Lambda functions, which are extremely abstract and highly ephemeral. The median Lambda invocation is less than 60 milliseconds and can happen tens of thousands – or even hundreds of thousands – of times throughout a day at scale.
Abstraction brings the benefit of not having to worry about infrastructure. But it also means you can’t see the servers and don’t always know what’s going on. You need to adopt new tools and methods; you need to adapt to a new way of thinking about how your application is behaving. You have to anticipate more things in advance, incorporating that foreknowledge (which might be sophisticated educational guessing) into your Lambda functions ahead of time.
When used incorrectly, serverless technology could incur unwanted costs. Writing inefficient code could make your serverless functions run too long, costing more money instead of saving it. Misconfiguring memory limitations on your Lambdas could make your functions fail (when not enough memory is allocated), or cost too much (when too much memory is allocated).
Embracing New Debugging Methods
To overcome the emerging challenges of debugging serverless functions, it is necessary to adopt the right tools. Classic debugging methods – such as breakpoints, adding log lines, or SSH-ing into a remote server – are just not relevant anymore when it comes to serverless functions.
What’s more, debugging either Kubernetes or non-serverless cloud deployments focuses on what is currently running. Serverless functions operate too quickly for current debugging data to be relevant. Those functions operate on a ‘SPIN-RUN-TEAR’ protocol: Spin up when you’re triggered → Run your logic → Tear yourself down immediately.
The single-purpose code sections used in serverless implementations run and stop dynamically according to that particular application’s needs. This is event-driven architecture. Its very nature makes it harder to trace – and consequently understand – what is happening in each and every function.
The fact that each function is limited to run for only a very short period of time makes it even harder to use a traditional debugging tactic like viewing relevant data via breakpoints.
Additionally, reproducing an issue locally is a challenge in the most popular serverless frameworks, as deployment and execution flows are quite different from live executions. Serverless functions are distributed and hosted in the cloud by their very nature, which makes it very difficult and sometimes even impossible to reproduce an environment and that is presenting teams with a big challenge to handle when troubleshooting and debugging your application.
Getting By with Just a Little Help
Our job here at Rookout is to help developers adapt to development and troubleshooting in new and emerging technologies. Seeing the limitations of debugging in the cloud, we wanted to make serverless applications more accessible to more familiar debugging techniques.
We see the everyday challenges evolve rapidly as technology and methods keep changing. We’ve been working with customers on transitioning to serverless architectures for a while now, and we’ve seen the special kind of pain debugging a serverless deployment is. With that experience, we’ve been working on attacking those pain points, and our first effort is around adding new visualizations.
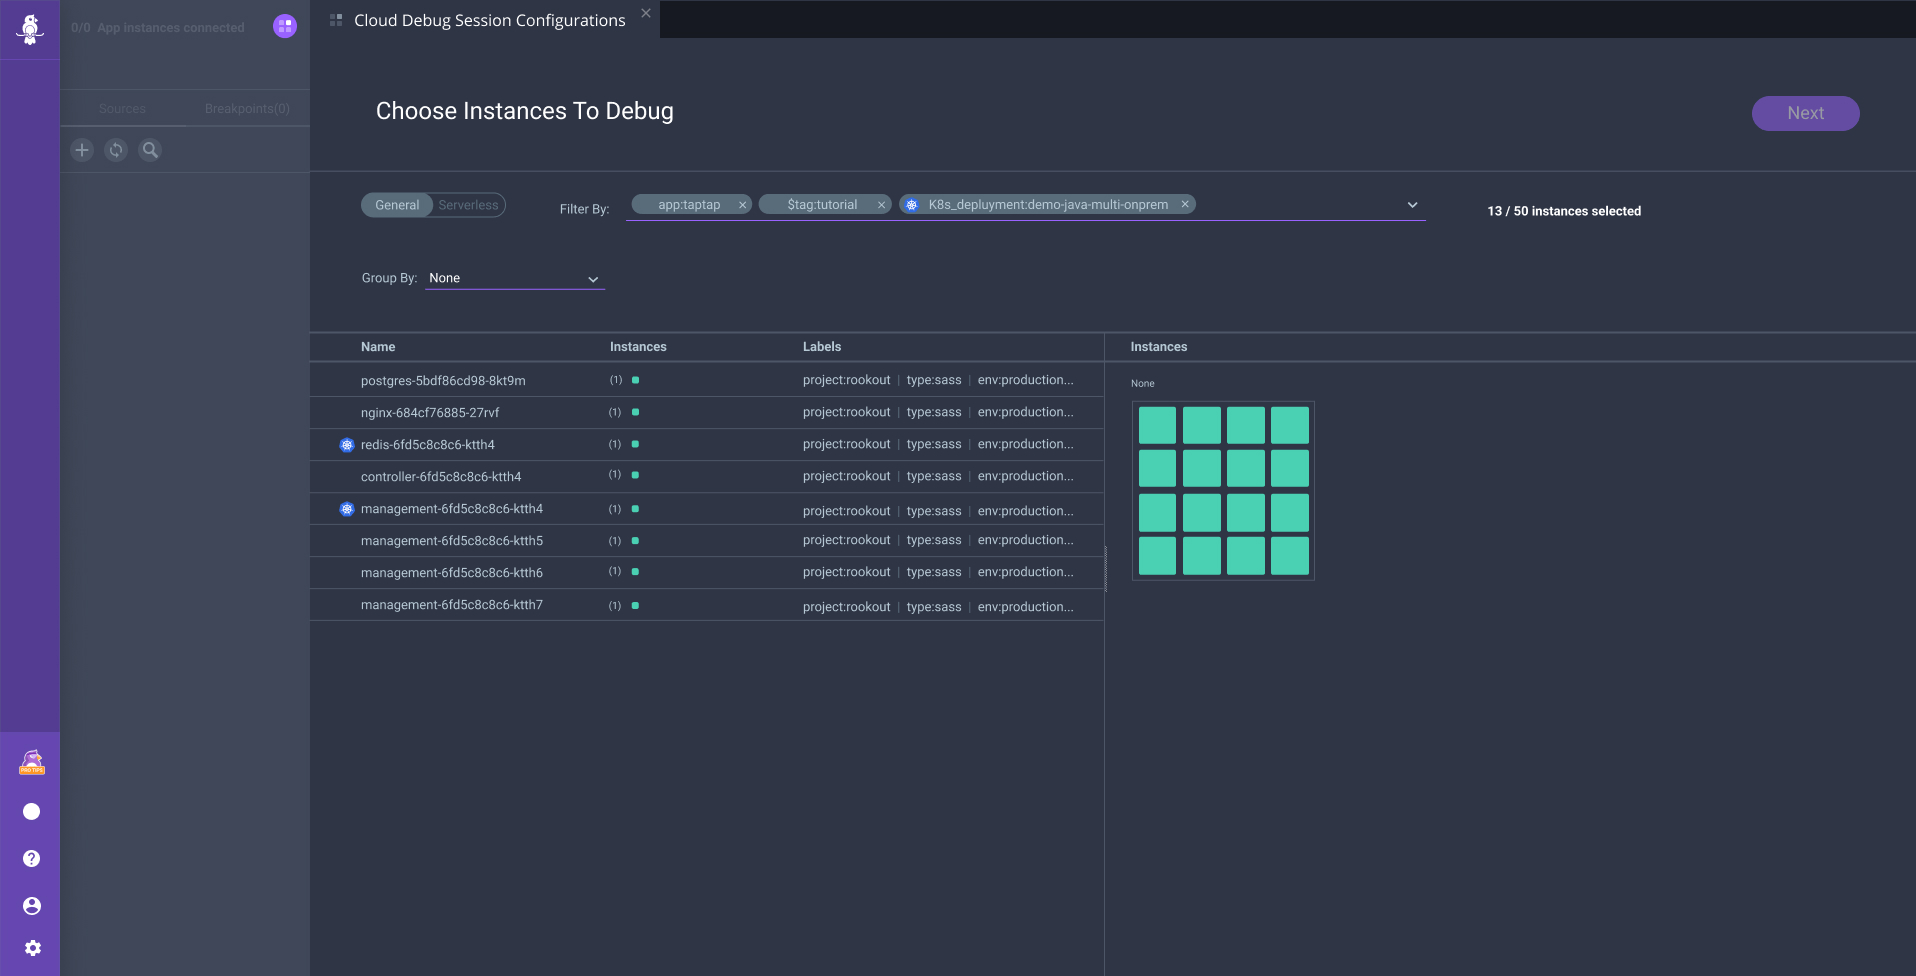
The graphic below charts the upcoming debug session, in a way that is particularly helpful for serverless environments. Instead of showing boxes representing servers or containers, we wanted to show a timeline view that tracks when users invoke different functions and in which environments.
The Rookout Serverless Debug Experience
A Fuller Story
Our motivation was to tell a fuller story of a function’s behavior, allowing developers to identify which problematic functions are invoked too frequently or too little at the time of a production incident. This is the sort of issue that can be compounded when dealing with serverless work. Serverless deployment is all about being hands-off as much as possible, so you expect to save time with such a serverless deployment (and, consequently, troubleshooting them).
If you need to scale resources, your functions will do that automatically. But a bug can throw off those functions, missing points when you need to scale or scaling when you don’t have to, leading either to a loss of revenue or paying too much for your serverless deployments.
Upon initial release of our new debugging capabilities, responses have been overwhelmingly positive. Our customers, who so far were completely unable to debug their serverless environments, now find that it’s almost as straightforward as debugging locally. It’s still not that walk in the park we wanted it to be, but we’re getting there.
For some of our customers, just the fact that we show them what their running environment looks like is miles ahead towards understanding where the problems could be. For others, the full power of Rookout is unleashed upon their code, making it possible for them to fetch full debug snapshots, log lines, and metrics with the click of a button.
Conclusion
The new Serverless Debug Session visualization provides comprehensive coverage to a variety of serverless frameworks, and allows robust scale of thousands of function invocations every day. The new serverless experience provides a coherent workflow. It facilitates Dev and DevOps teams’ response to an alert within their traditional monitoring or observability solution, then drills into the problem at the code level, getting instant insight into areas where they need to focus their investigation efforts.
Related posts