It’s Time To Turn On The Light With Dynamic Log Verbosity
As we recently discussed, many of us are still lost in the darkness, grasping for a log line to shed some light on the issue we are trying to troubleshoot. Many of our customers and colleagues have shared the following challenges with us:
- We print only WARNING and ERROR levels of logs in production, in an attempt to reduce logging cost, performance impact and logging “noise”.
- When a problem occurs we wish we could have the detailed DEBUG and TRACE level of logs we had when developing locally, but increasing log verbosity in a live environment is often considered risky and expensive.
- Changing log level usually requires restarting the application, and it is hard to control the amount of logs added by applying such a change.
- Even if we could print everything without worrying about performance and cost impact – we would still be flooded by a torrent of irrelevant log lines, only a few of them relevant to the issue we are trying to troubleshoot
But what if we didn’t have to make such a choice? What if we could easily and efficiently switch on exactly the logs we needed, without hurting our application? That is the question we had in mind as we started working on the latest offering from the Rookout team: the newly released Rookout Live Logger.
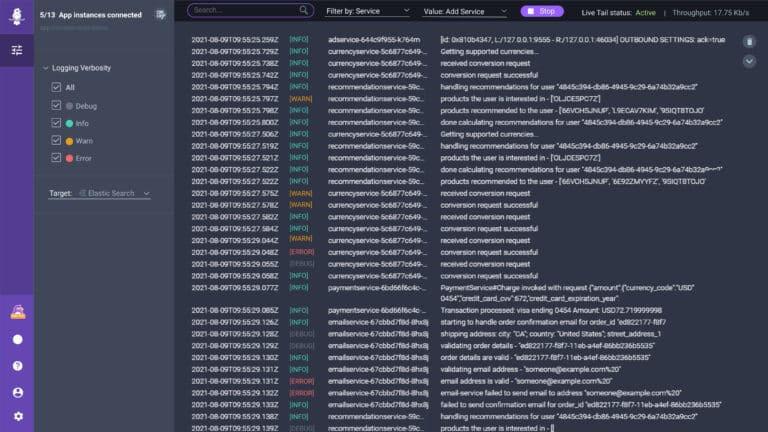
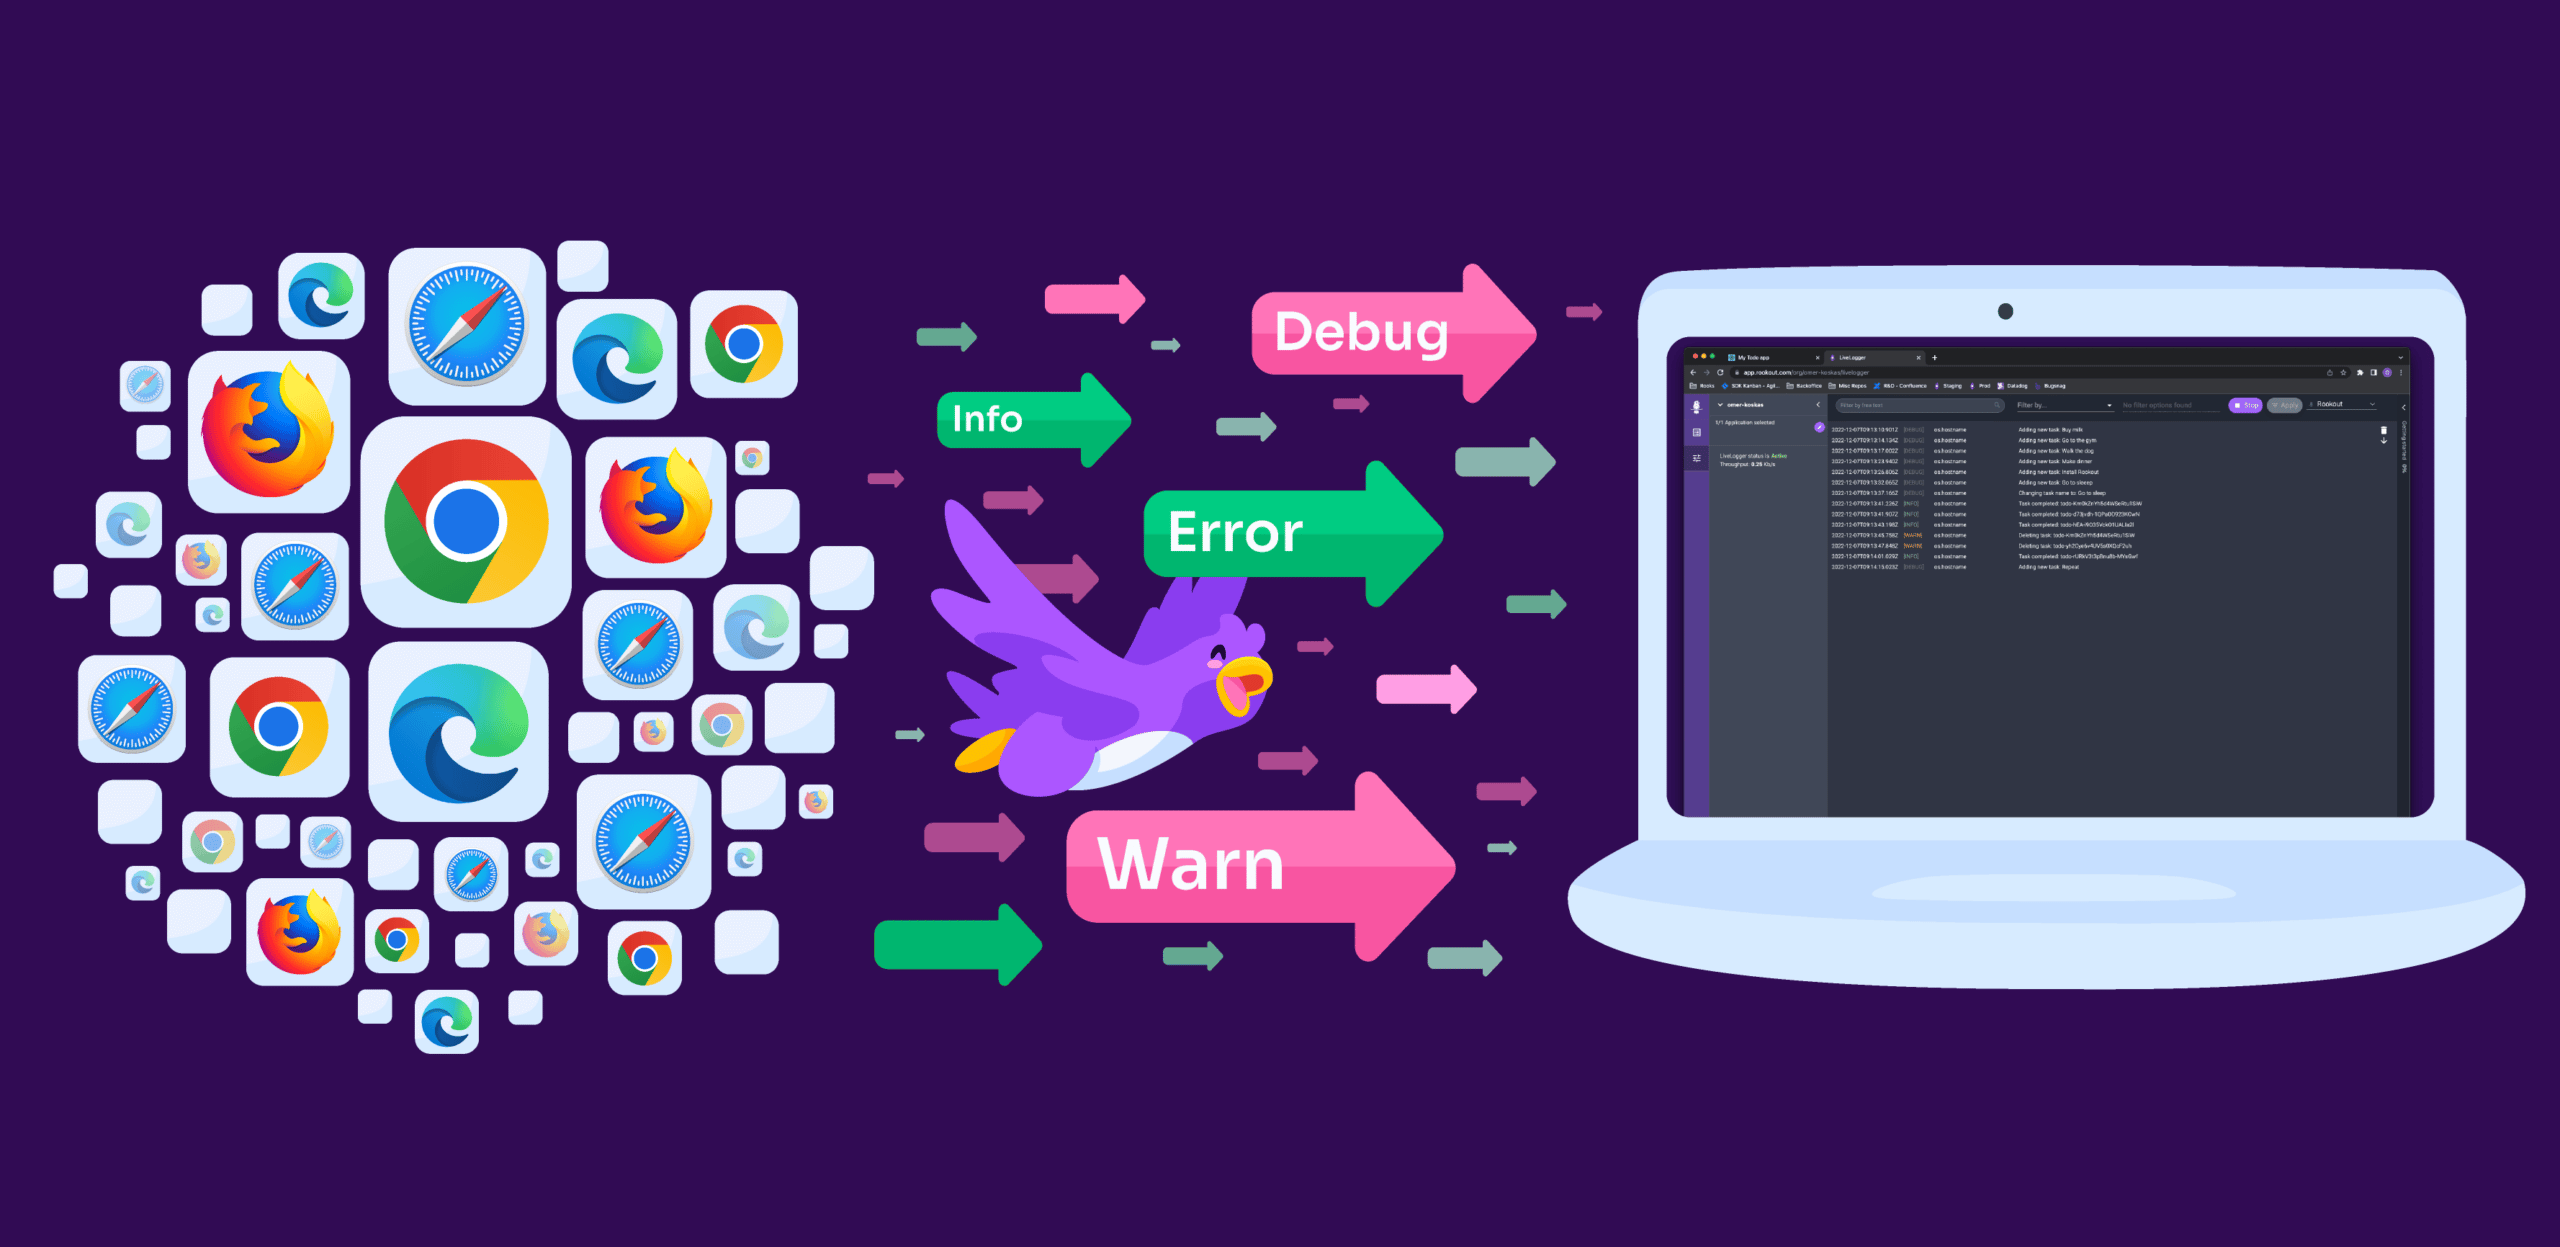
At first glance, Rookout’s Live Logger should look familiar to any developer who has ever used a Live Tail feature in their favorite observability tool. A search box at the top, some filter checkboxes on the left-hand side, a dark background full of log lines front and center. If your go-to method for debugging is using logs, this design should help you feel right at home. But a closer examination of the experience reveals the key difference between Rookout Live Logging and the many Live Tail implementations out there.
Live Tail features in classic observability products, such as Datadog, Logz.io and Sumo Logic, mostly provide the user experience of real time. That is, log lines are shown in real time as they appear, giving the developer a sense of what’s actually happening right now. But when it comes down to it, these features only show logs that were already printed, shipped to the logging service, indexed, and stored.
Rookout Live Logger takes this experience once step further by actually causing new log lines to be printed. By integrating with popular logging libraries such as Log4j, Logback and Winston, the Rookout SDK is able to perform bytecode manipulation and “switch on” log lines that were otherwise hidden. This core capability empowers software engineers to collect real time data with the click of a button, using the insight baked into log lines that were added to the code but were disabled when the code was shipped to production. How does that work? Let’s take a closer look.
![[Let there be logging light]](https://www.rookout.com/wp-content/uploads/2021/08/Yoda-768x474-1.jpg)
[Let there be logging light]
1 – Dynamic log verbosity
The most frequently repeated phrase we hear from our customers is “I wish I could just easily switch on DEBUG logs without worrying about restarting the app and impacting cost”. Taking this sentiment into account, the first feature we baked into Rookout Live Logger was the ability to do exactly that.
Rookout Live Logger lets you gain deeper insight into the behavior of your app by switching on INFO, DEBUG, or even TRACE logs with the click of a button. The fact that you can increase log verbosity for a limited amount of time, and the fact that you can pinpoint your data collection by using the advanced filter capabilities described below, means that you get exactly the extra log lines that you need No more, no less.
2 – Text-based filtering
When searching through a cascade of seemingly identical log lines, perhaps the most intuitive way of getting the information you need is by typing a short string of text. Rookout is able to only “switch on” log lines that contain the wanted string, ensuring that the log lines printed to your screen (and later pipelined to your observability platform) all match the pattern you are looking for.
Printing only log lines that contain a sneaky error message is a no-brainer. Printing only log lines that came from a specific service, or that mention a problematic variable value, is a bit more advanced. However, you use this capability – it will give you a coarse level of control over the logs you are about to turn on using the verbosity filter.
![[Switch a powerful searchlight on to fetch in-context logs]](https://www.rookout.com/wp-content/uploads/2021/08/batman-768x432-1.jpg)
[Switch a powerful searchlight on to fetch in-context logs]
3 – Context based filtering
String filtering is the most intuitive action for a developer, but it has its limitations. First and foremost – we don’t always know what string we are looking for. This is where context based filtering comes in.
Context based filtering leverages Rookout’s built-in integration with tools that implement the OpenTracing and OpenTelemetry standards. By fetching context data from said tools, Rookout Live Logger lets you switch on only log lines that are printed during execution of code relating to specific users, accounts, services, or other transaction related information that will allow you to quickly get to the root cause of an emerging problem.
4 – Log throughput tracking
How many log lines get printed in your app every day? How many I/O resources get spent on shipping these log lines to your log storage provider? If you know these numbers it might be because you already got an urgent call from your DevOps team asking that you reduce overhead and storage costs.
So before shipping additional log lines to your observability platform, you want to check out the additional log lines being printed by increasing log verbosity. Tweak the volume using the above filters, and only then ship your additional log lines to the chosen Target. This will allow you to gain the additional insight and context needed without hurting your application and without adding noise.
![[Light up your observability platform without setting your app on fire]](https://www.rookout.com/wp-content/uploads/2021/08/globe-768x576-1.png)
[Light up your observability platform without setting your app on fire]
5 – Log pipelining
Once you view your newly printed log lines in a Live Tail experience, and once you’ve applied the relevant filters to ensure the increase in throughput is manageable, it’s time to ship the newly printed log lines to your observability pipeline.
Rookout Targets include the most popular log management and APM tools, allowing you and your team to consume the newly printed DEBUG and TRACE data side by side with data collected by other sources.
6 – Enterprise and production ready
Rookout Live Logger is built by the same team that gave you Rookout Live Debugger. That means that the usual Rookout benefits are also baked into our new offering. Live Logger is designed to be a production-grade observability tool. That means that performance impact is minimised, and that secure and compliant data collection are ensured.
It also means that our new solution offers the widest technology coverage available today. In terms of supported languages, cloud vendors and deployment methods, as well as integration with other observability, logging and monitoring tools.

[Light up your observability platform without setting your app on fire]
You may also note that the new solution complements our existing product: Rookout’s Live Debugger. Our Live Logger lets you turn on log lines that already exist in your code, while the Live Debugger lets you create new log lines on the file when these aren’t written in your code to begin with. The Live Logger lets you switch on logs everywhere, while the Live Debugger pinpoints your search to a known line of code. And while the Live Debugger is usually used to fetch a small number of detailed debug snapshots, our Live Logger is designed to generate a larger volume of log lines.
Rookout’s Live Logger is designed to be a powerful, yet focused, searchlight you can switch on with a click of a button, without worrying about setting your app on fire. We believe this searchlight will give software developers the courage they need to investigate production issues without worrying about a missing log line or about stopping the app and waiting for a code change to be deployed. For as we said earlier, it is better to light a candle than to curse the darkness. But turning on a searchlight is even better.
So that fruitless search for missing log lines? Make it a thing of the past with our new Live Logger. And if you’re looking for more information – or want to try it out for yourself! – check it out here.
Related posts