
Using Helm to Improve Software Understandability
As new advances in software development have allowed developers to increase their velocity and push out new software at ever-increasing speeds, one less measured metric is software understandability. Although it probably seems obvious, when building new software the goal should always be to build software that is as simple and easy to understand as possible. While architectural and design decisions play a critical role, oftentimes simply choosing the right tool or framework for the job can simplify things tremendously.
One such tool and our focus for this blog, which has the ability to simplify the management of applications is Helm. Helm is a Kubernetes tool that can improve the ease of use and understandability of software systems by providing a standard approach to how those systems should be packaged and deployed. Helm can improve developer productivity, reduce the complexity of deployments, and bring improved consistency to how organizations build and use cloud-native applications.
In this blog, we’ll take a deeper look into Helm and why it can increase the understandability of software. As part of the discussion, we’ll take a look at a specific example of a Helm chart repository using JFrog’s ChartCenter and will also look at how an application component from Rookout can be installed from the Helm repository.
What is Helm?
Helm is a tool that allows you to manage Kubernetes-based applications by providing a standard approach for defining how you install, upgrade, and uninstall applications. You can think of Helm as a package manager for Kubernetes applications. With Helm, you define Charts, which are YAML-based files that describe a related set of Kubernetes resources. Charts are files that are packaged in a particular directory structure which can be versioned within your source control systems.
Helm is implemented in two key components:
- The Helm Client is a command line tool for developing Charts, managing repositories and releases, and interfacing with the Helm Library.
- The Helm Library provides logic for executing Helm operations (install, upgrade, etc) by interfacing with the Kubernetes API server.
There are also three key concepts to be aware of with Helm:
- Chart: a package of files describing information required to create an application in Kubernetes
- Repository: a place where charts can be collected and shared
- Release: a running instance of a chart within a Kubernetes cluster
A nice description combining these concepts, as taken from the Helm website is as follows: “Helm installs charts into Kubernetes, creating a new release for each installation. And to find new charts, you can search Helm chart repositories.”
Looking at a Helm Repository
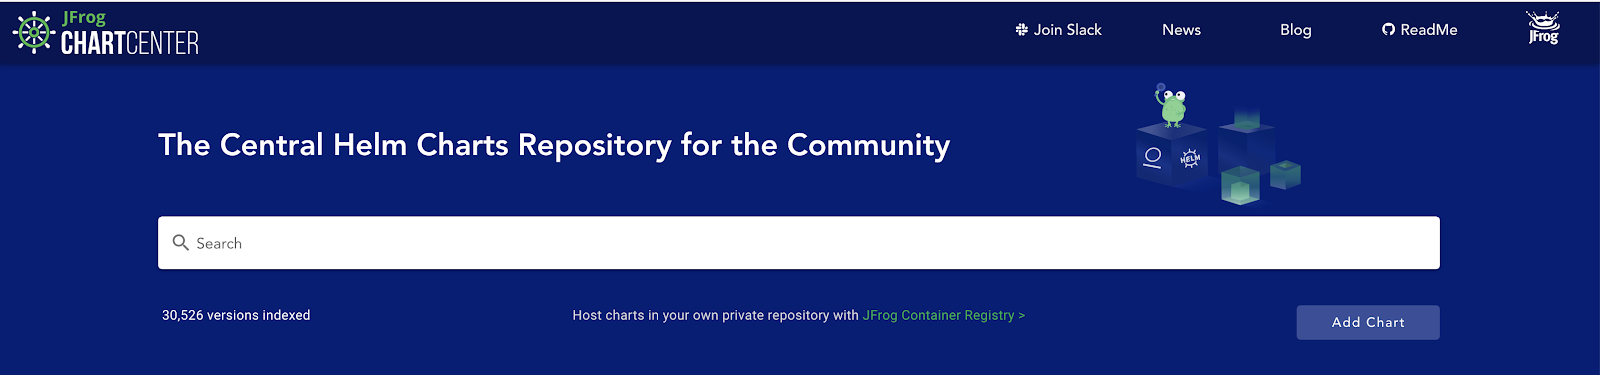
Now that we’ve explored what Helm is and how it works, let’s dive deeper into how you can use a chart repository for hosting and sharing Helm Charts. A chart repository is an HTTP server where packaged Charts can be stored and shared. In this blog, we’re going to be looking at JFrog’s new chart repository, ChartCenter.
ChartCenter is a free chart repository that makes it easy for the development community to upload and share charts with other developers. They have a simple and easy-to-use interface for searching through Kubernetes-ready packages that can be immediately deployed into a cluster. One nice value add is the additional chart metadata that you get from ChartCenter including usage data, dependencies, and security/vulnerability information.
If you would like to add your Helm charts to ChartCenter, there are a few simple steps to follow:
- Visit ChartCenter at https://chartcenter.io/.
- Click on the Add Chart button.
- Add your source URL and maintainer email on their repos.yaml file
- Follow the instructions and guidelines for making a pull request. Once approved your charts will be live on the ChartCenter website.
Let’s Install a Helm Chart
Next, we’ll take a look at and install one of the Rookout charts available from ChartCenter. For those not familiar with Rookout, it’s a debugging and data collection platform for applications written in Java, Python, Node.js, and .NET. To find the Rookout charts, simply navigate to ChartCenter and search for Rookout. In this case, we’ll take a look at the Chart for the Rookout on-prem data controller. This component is responsible for processing application snapshot data from Rookout on-prem so that when using Rookout, all sensitive data stays within your network or VPC.
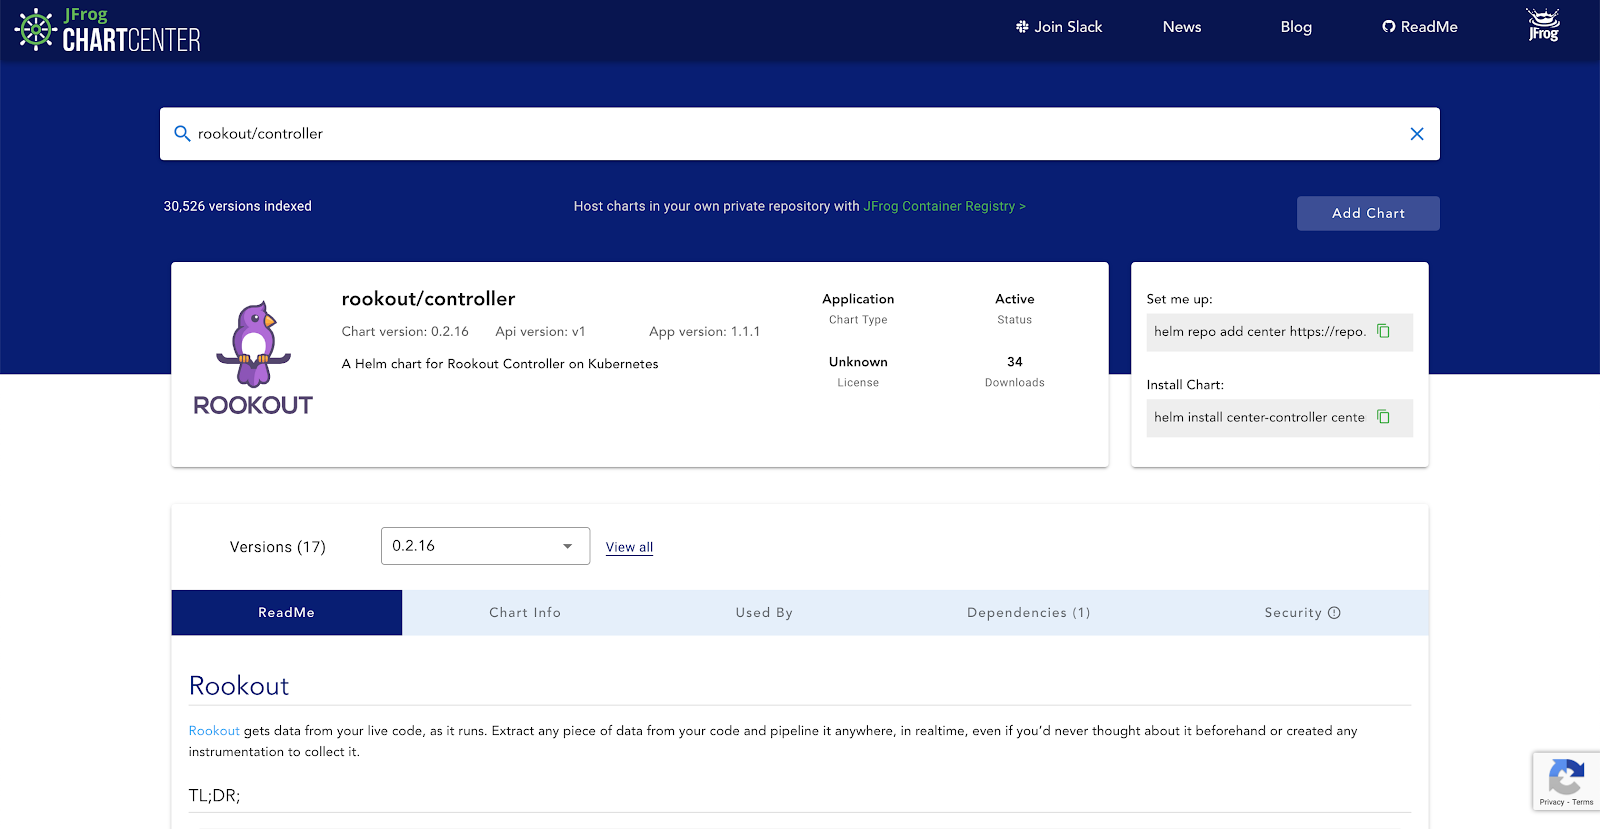
Taking a look at the ReadMe section of the chart, we can find the instructions to install the Rookout chart:
Let’s now take a look at how we can install this chart in a Kubernetes cluster. For this example, we’ll use a cluster spun up in Google Cloud’s managed Kubernetes service GKE.
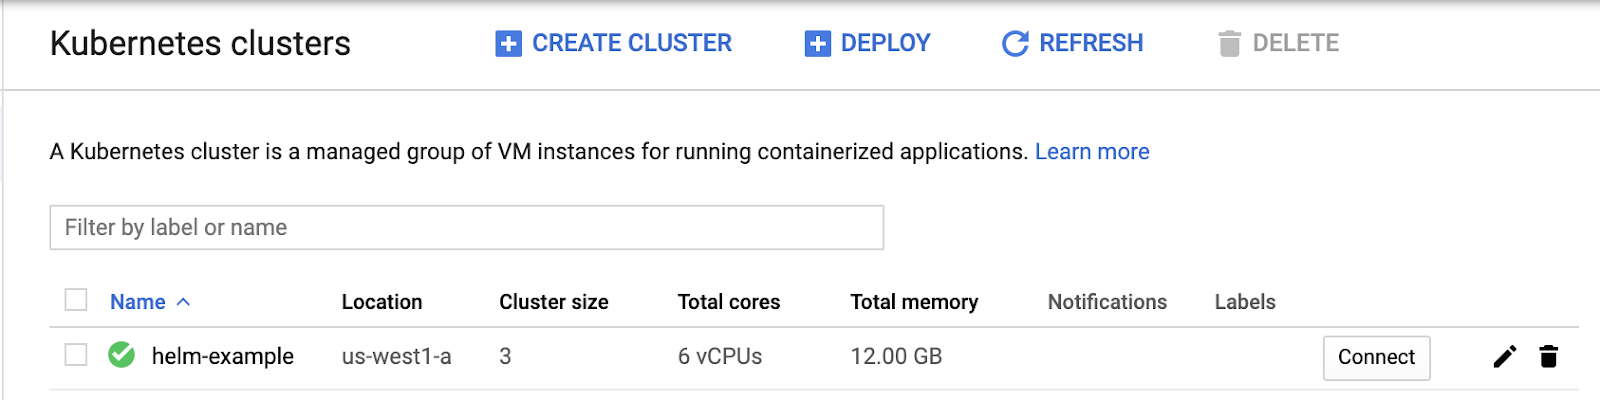
First, let’s connect to our cluster and install the helm charts:
Now we can run the above commands to install the Helm chart:
Taking a look at the running pods in our cluster, we can see that the Rookout controller is now running:
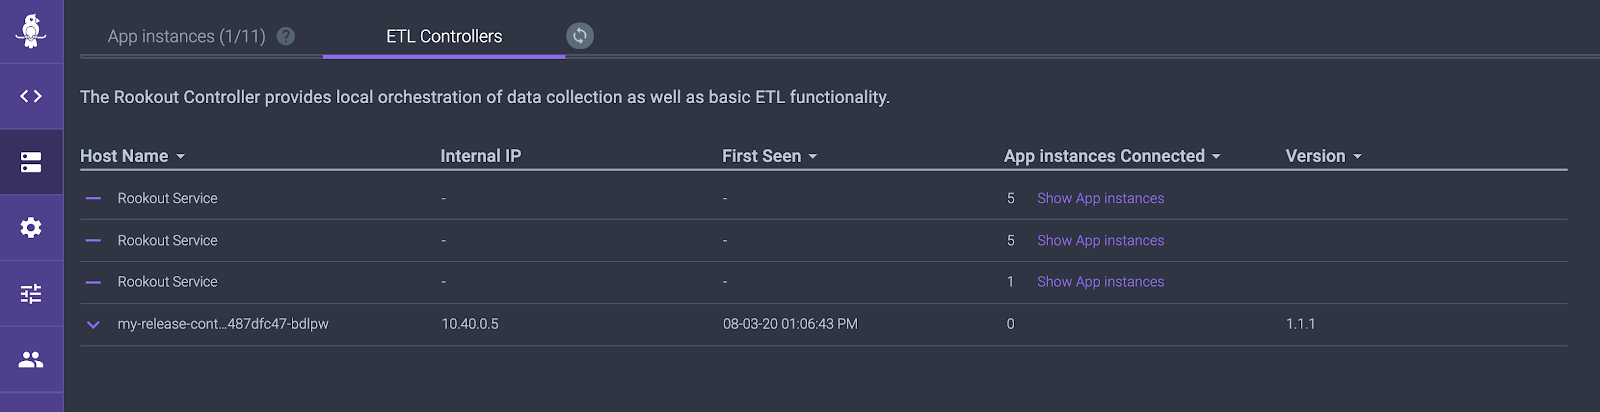
We can also now see our controller available from within Rookout:
And with that, we’ve successfully installed the Rookout controller in our Kubernetes cluster with Helm. How easy was that? If you want to take a deeper look into the Helm chart and supporting files themselves, you can check out this repository here: https://github.com/rookout/helm-charts/tree/master/charts/controller.
Real-Time Application Debugging
Lastly, to continue the discussion of understandability, let’s take a look at how we can use Rookout and our newly installed controller to debug a live-running application! To start, let’s deploy a sample application into the Kubernetes cluster.
For this example, we’ll use a sample To-Do list application which can be found here (feel free to fork it and play around with it in your own environment):
https://github.com/joshRookout/deployment-examples/tree/master/python-kubernetes/rookout-service
To deploy the application, simply follow the instructions from the above GitHub repository. First, we’ll create a secret that will contain our Rookout security token:
Before we deploy the demo application, we’ll need to tell it to connect to the Rookout controller which we installed with Helm. To do that we’ll need to add two new environment variables in the deployment YAML.
Notice we added the environment variables ROOKOUT_CONTROLLER_HOST and ROOKOUT_CONTROLLER_PORT so that when the demo application runs, it connects to the controller in our cluster.
Next, we’ll deploy the application:
Now that the application is deployed, we can get the external IP address of the service:
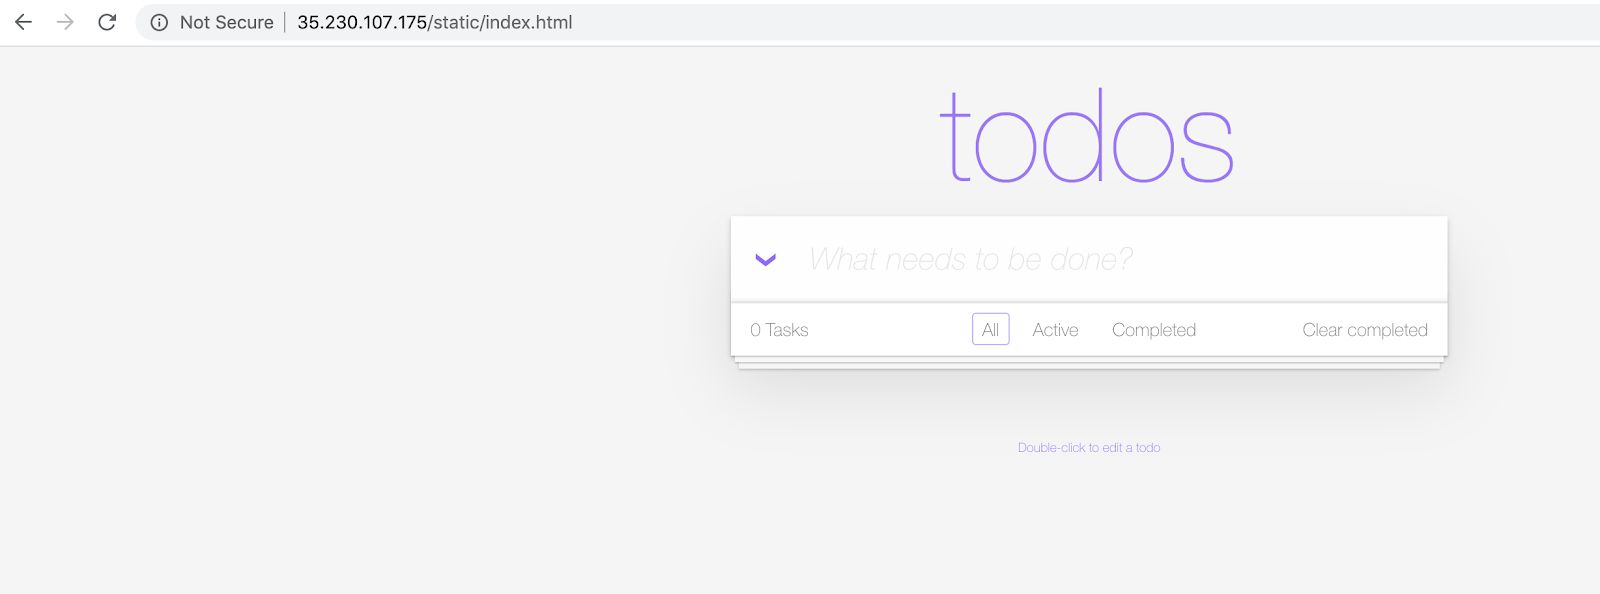
Navigating to the external IP we can see the application running:
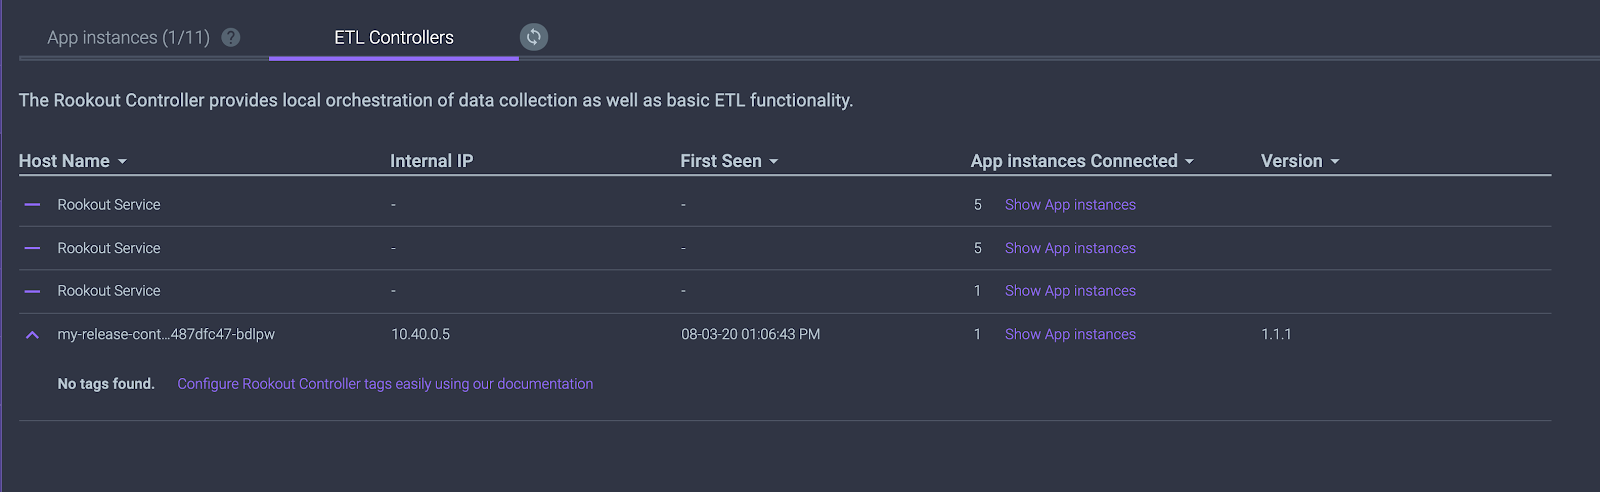
We can now also see our application instance connected to our controller within Rookout:
From here, you are all set to use Rookout to collect snapshots of data from the running application. To finish the setup you’ll need to connect the source code repository and start setting non-breaking breakpoints in your application as described in this video.
Tying it All Together
Hopefully, this blog post gave you a taste of some of the power and ease of use achievable by using Helm charts when doing development in Kubernetes-based environments. By defining and managing your application configurations using Helm charts, you can add to the understandability of your applications by having a consistent approach to packaging those applications.
When looking for packaged applications to install, using applications hosted in a chart repository like ChartCenter makes it quick and easy to get started. As more and more organizations adopt cloud-native technologies, this community is sure to continue to grow.
Technologies like Rookout can be a nice tool in your toolkit for a better understanding of what’s happening within your applications while they’re running without having a need to restart or redeploy them.
And finally, when looking at software understandability, it’s important to not only keep in mind coding standards and source code readability but also to keep close tabs on non-source code-related tools or artifacts produced during the development process. Happy coding!
Related posts