

How To Survive Debugging Cloud-Native Apps
It is no coincidence that “looking for a needle in a haystack” is a popular debugging metaphor. When a single missing `;` can cause problems, and you must go through hundreds and thousands of code lines to find it. That’s when the metaphor becomes all too relevant. So what happens when the problem is a bit trickier than a missing semicolon? When you need to print thousands of log lines just to try and trace it. Or, alternatively, you set a breakpoint and step-by-step your way to the root cause. That’s when the frustration behind this metaphor truly comes to life.
Now, what if we take the needle in a haystack metaphor even further? One could say that debugging cloud-native apps is like going through multiple haystacks that keep on moving. Only this time, you’re trying to figure out if the needle even exists. Of course, we’re probably overusing that metaphor. So maybe it’s time to break it down and replace the old-fashioned problem with a more up-to-date solution.
Who built these Haystacks anyway?
Some of the things that motivate us to build cloud-native apps are the very same things that make debugging these apps such a challenge. We build cloud-native apps so they can easily scale up and scale out. When user traffic is high, or when we need to process a big batch of data, we spin up additional, bigger boxes. Then, when things go back to normal, we tear these boxes down and revert to our smaller-sized machines.
We break our cloud-native apps into microservices to simplify our development, testing and deployment cycles. This ability to dynamically spin up and tear down cloud instances allows us to work on each service separately. It allows us to add features and fix issues in a single box without breaking the other boxes. But what does it mean when we try to debug such an application?
Stop moving my Haystack
The fact that instances are deployed and torn down dynamically means there is no app or process we can “attach” to in the traditional debugging sense. We have learned to live with the fact that the only way around that is adding tracing capabilities. We have accepted that we have to invest significant coding time and CI/CD cycles just to print too-many-logs. Logs we later have to sieve through, logs that impact our app’s performance, logs that take up cloud storage.
Then, there’s the fact that we broke our app into microservices which means we now struggle with new debugging challenges since our code is spread over multiple repositories. Each repository keeps shifting independently of the others, as we intended and worked very hard to achieve. But when we try to debug an app born of these multiple, ever-changing repos, things turn into a nightmare. Which code version(s) should I be looking at? Can I trust that adding a breakpoint or printing a log line will have the wanted result? Especially now that I’m not sure which code version is running in my test/staging/production environment.
Surely, there must be a more elegant solution to the problems I introduced by adopting the previous elegant solution.
Which Haystack should I start with?
One of the first steps towards efficiently debugging or logging a cloud-native app is flipping your perspective. Instead of zooming in, trying to attach to a single process, or printing logs on a specific code version, you may first want to zoom out. Remember: your app is running with multiple instances and code versions, and both are constantly shifting.
Start with looking at a thousand seemingly identical Kubernetes pods, then pick the ones that may be relevant to the problem you are trying to troubleshoot. Can you tell them apart by their environment label? Their app or process name? Or by their age or commit id? Can you pinpoint a specific box where the issue reproduces? Or pinpoint a characteristic that makes the bug more likely to happen?
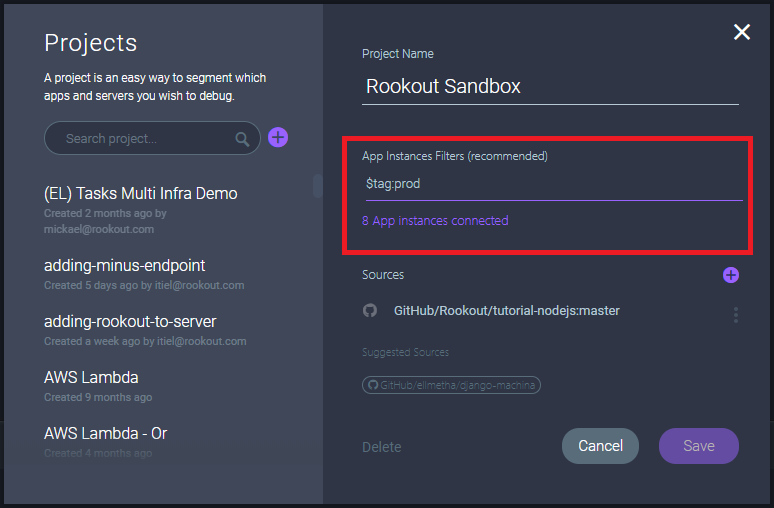
That’s the approach we took when we first introduced Rookout Projects and Filters. Start by looking at every running instance of your application. Then, when you have a clue where the root cause of the issue is, start zooming in on the right haystack. Rookout will also make sure to track the right commit version for you.
This means that the next non-breaking breakpoint you set, or the next log line you add will only apply to the right subset of instances. This will make going through debug messages and log lines more efficient, both for you and for your log aggregator.
Sharpening the good ol’ needle
Now that we’ve narrowed down our search, it’s time to go back to basics. Set a non-breaking breakpoint, add another log line in a matter of seconds, and keep drilling down in search for the problem. But even after we’ve narrowed the search to a few dozen boxes or even one specific customer tenant, it is far from over. We’re down to one haystack but we still need to find that needle.
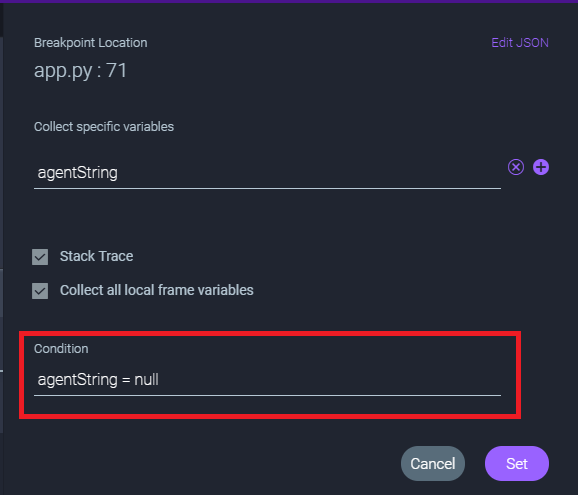
Some of the problems we have when debugging a local monolith still apply here. We may be iterating through the same code snippet hundreds, thousands of times before the issue reproduces successfully. Maybe it has something to do with specific data dependencies. Maybe it’s a configuration setting that affects app behavior. When debugging locally, this is where we would have used the good, old-fashioned conditional breakpoint. Wake me up when X is null or is a negative number, or when it’s a string that contains the substring “needle”.
Making the needle bigger
That was the use case we had in mind when we started working on conditional breakpoints, which we recently introduced into our product. We first introduced the feature to a couple of our customers and design partners. That’s when we learned that this “bread and butter of debugging” feature actually takes on a new form when it comes to debugging dynamic apps. In some cases, it helps our customers do a fine-grain filter to a smaller, dynamic subset of instances. Set a condition to only trigger the non-breaking breakpoint for a given hostname or tenant ID.
For our customers who use Rookout for debugging their production environment, this has another important benefit. By fetching debug data and printing log lines only for hand-picked instances, they guarantee an even smaller performance impact and only a negligible number of unnecessary log lines.
Searching for a new metaphor
As the dev community transitioned into a cloud-native mindset, we shifted our perspectives and adopted some new metaphors. We left step-by-step debugging to local environments, in favor of adding as many log lines as possible and tracing the issue with our log aggregators and APM dashboards. But as the Cloud and DevOps tool ecosystems keep on running forward, new solutions like Rookout allow us to shift our perspective again.
In some cases, you may solve the same problems in a more effective way. Keep adding log lines, but with a click of a button reduce the time and effort required by adding logs. Then, add log lines only for the right subset of environments, applications, and instances.
In other cases, you may find that some of the assumptions you’ve made as you took on the cloud and DevOps challenges, may be re-examined. You can add non-breaking breakpoints, fetching full debug data just as if you were debugging locally. Plus, a new take on conditional breakpoints helps you make sure you only get the relevant debug data.
So if you’re interested, reach out and get an early taste of the brand new conditional breakpoints. And we’ll keep looking for new ways to solve your debugging challenges, as we try to come up with new, more relevant metaphors.
Related posts


