
Getting By With A Little Help From My Visual Tracing
When working with Rookout customers, one of the most commonly heard requests we hear is a plea for “context”. When trying to debug complex applications, setting a Non-Breaking Breakpoint and fetching a full view of local variables and stack trace is a necessary first step. But in a dynamic, distributed environment, this first step is not always enough.
“Give me the ability to see those debug snapshots on a timeline” is one request we hear frequently. “Help me identify specific transactions, users, or accounts when setting a breakpoint” is another. Bringing those requests together led us to dig deeper into Distributed Tracing and to try and bring Distributed Tracing into our cloud-native, production-grade debugger. Here is what we learned along the way.
Debugging is hard. Cloud debugging is harder.
Debugging cloud-native applications is no easy task. Traditional debugging methods such as step-by-step debugging are almost impossible to use in cloud-native environments since there is never a single server to connect to and debug, as the environments are dynamic and containers, pods, and serverless functions spin up and down on the fly. We often fall back to log based debugging, which brings its own set of challenges in cloud-native environments. Logging costs become significant, as does performance impact. And log based debugging means having to add a line of logging code, waiting for a new release, and wasting more precious development time while delaying issue resolution.
Making things worse, debugging cloud-native applications takes away one of the most reliable debugging methods: Debugging Up The Stack Trace. In traditional debugging, when an exception is thrown, we can usually use the stack trace to learn which function invocation led us to the problematic situation. But in a distributed, complex, and dynamic environment, there is no single process, no single app. No single stack trace. And this is where Distributed Tracing comes in.
Distributed Tracing and OpenTracing
Distributed Tracing is a method used to profile and monitor distributed microservices-based applications. By enriching requests and function calls with context data, we make it possible to connect the dots, giving us a complete picture of the behavior of our application.
OpenTracing and OpenTelemetry, the most commonly used frameworks for implementing Distributed Tracing, give developers API specifications that let us define how said context is passed and is later read by Tracing tools such as Jaeger, Zipkin, Lightstep, and many other observability and APM tools used today.
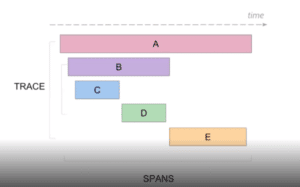
The result of implementing the OpenTracing or OpenTelemetry API in an application is the ability to see a detailed timeline view that shows a breakdown of requests and function calls across distributed microservices. This gives a developer the ability to understand what is going on in a distributed application, where services are running in parallel and function dependencies are impossible to analyze otherwise.
This gives us almost everything we need to troubleshoot a cloud-native application… Everything, that is, other than the local state of the application this context and timeline relates to. In other words – where are my local variables?
Show me the Data
By looking at the Tracing Timeline, you can get a quicker and deeper understanding of your code flow, such as which call happened when, which transaction happened by which process, and what our application state was at the time. It is presented throughout a Time Dimension graph that adds an insightful enrichment layer to your session. Essentially, it’s a map that tells you the story of a piece of code at a specific moment and context. It empowers developers to easily and quickly troubleshoot complex issues, get to the root causes, and ultimately become far more effective.
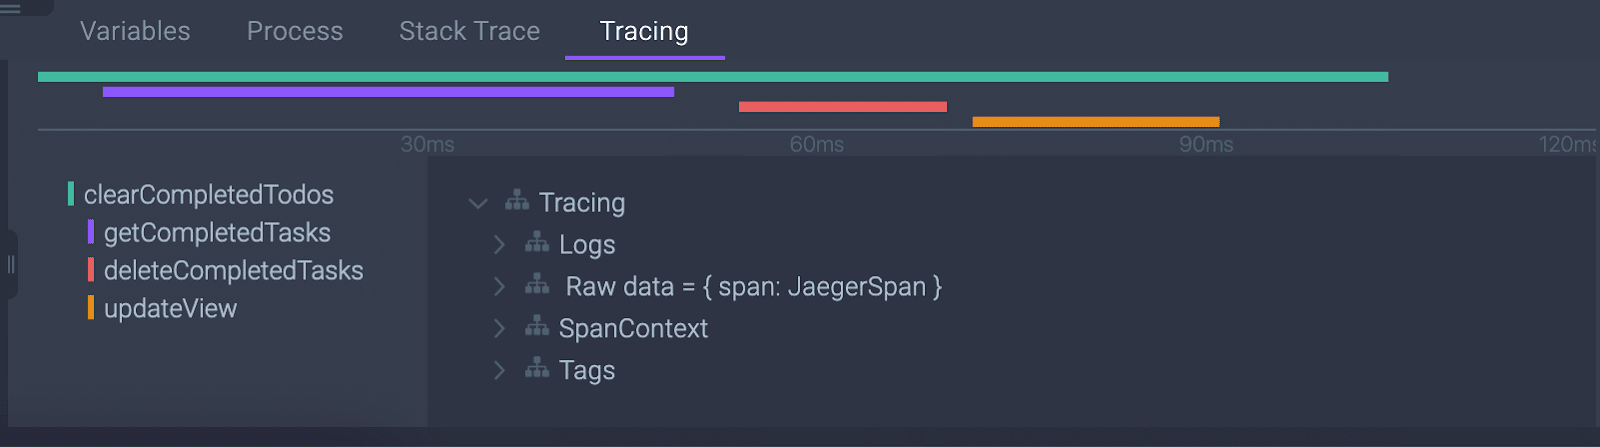
The ability to look at our new Tracing Timeline inside the debug session has opened a unique and powerful layout. Developer teams can create a clean view of every request coming in and out. Using Spans, a named, timed operation representing a piece of the workflow, they can get a timeline view of every transaction that happens, including information that accompanies transactions including when it passes between different services.
Rookout now combines tracing information with code-level, context-specific debug data, both of them side by side and gives developers even deeper insight into application behavior, taking Observability into its next evolutionary step: Understandability (the ability to not just view the internal state of the application, but also to fully understand its structure and function).
Level up your tracing
The next time your team finds themselves in a customer-related troubleshooting session, they can make their lives – and yours – easier in one simple way. By using Rookout’s live debugger and viewing debug data complemented by the new Tracing view. This holistic view ensures a seamless and powerful cloud debugging experience
To be as effective as you can get, you must conclude the debug session and level up with other compliment visualization updates from Rookout such as our Live Debugging Heatmap and Agile Flame Graphs.
Related posts