
Debugging a Node.js Application with a Production Debugger
Production debugging in its current form is a relatively new area of technology that aims to make it easier for developers to solve problems in their code. More often than not, we don’t have all the information we need to solve those hard to reproduce bugs. This leads to long hours of debugging, adding more log lines, and creating separate reproduction environments to try to isolate and reproduce problems. The objective of production debugging solutions is to take much of the pain out of these situations by giving developers direct access to their code-level data in live applications whenever they need it.
As I was sitting down and thinking of all the interesting use cases there are for production debuggers, I thought it would be an interesting experiment to deploy Rookout into an open source project and show how easy it is to start debugging. I wanted a challenge, so I searched GitHub and came across the repository for VSCode. Given that Rookout is a developer centric technology and VSCode is a wildly popular developer IDE created by Microsoft, it seemed like a fun choice to see how easy it would be to configure a third party production debugger that was able to help debug VSCode on the fly.
In this article I will show step by step how I configured Rookout within VSCode, a big portion of which is written in Node.js, and was able to set up a live debug session.
Setting up My Environment
To start I needed to clone the VSCode repository and set up my build environment. The instructions on this page were great for getting started building the project. If you want to follow along, you’ll need to ensure you have all the necessary prerequisites listed.
I simply cloned the repository like so:
git clone https://github.com/microsoft/vscode.gitThis project uses Yarn as the package manager, so to install and build all the dependencies it’s as simple as running the following two commands from the console:
cd vscode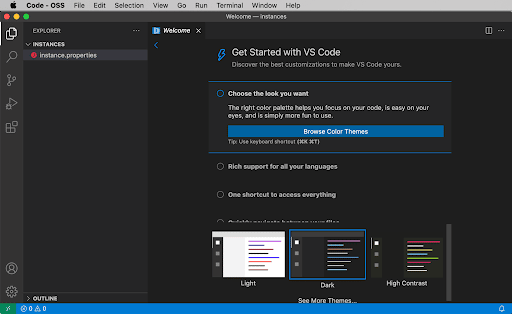
yarn./scripts/code.shIf all goes well you should have a development version of VSCode running:
Deploying Rookout in VSCode
Now that I was able to get the development version of VSCode running, I was ready to deploy Rookout. In order to deploy Rookout into a Node.js application, I followed the setup instructions listed on this documentation page.
When deploying Rookout in a Node.js application, the basic premise is that we’re installing an npm package, essentially another dependency for our application, as well as making a few minor configuration changes. Once Rookout is running within our application, we’ll be ready to start live debugging which we’ll take a look at in the next section.
To start, we can install the npm package into the application:
npm install --save rookoutThen we need to add a few lines of code at the entry point of the application. In this case that’s the main.js file located at src/main.js. I went ahead and added them at the top of the file:
/*---------------------------------------------------------------------------------------------

 *  Copyright (c) Microsoft Corporation. All rights reserved.

 *  Licensed under the MIT License. See License.txt in the project root for license information.

 *--------------------------------------------------------------------------------------------*/
//@ts-check
'use strict';
const rookout = require('rookout');
rookout.start({
token: '<rookout token>',
labels:
{
"app": "vscode"
}
});
/**
 * @typedef {import('./vs/base/common/product').IProductConfiguration} IProductConfiguration
 * @typedef {import('./vs/base/node/languagePacks').NLSConfiguration} NLSConfiguration
 * @typedef {import('./vs/platform/environment/common/argv').NativeParsedArgs} NativeParsedArgs
 */
...
In the above code, first we include the rookout module and start the Rookout SDK passing in our Rookout security token as well as a label so that we can properly filter our application instance when we’re ready to debug. That was simple enough, but we’re not quite there.
The VSCode project uses Typescript which is a superset of Javascript that compiles down into plain Javascript. When using Rookout to debug, Rookout will automatically compare the file you are trying to debug in the Rookout UI with the file that you have deployed in your runtime environment so that it can alert you to any changes between the two files. If the files are different, this would typically mean that you are attempting to debug the wrong version of your code. In the case of Typescript, the .ts files are transpiled into .js files. To ensure that Rookout can intelligently compare these two files, it will need to have source maps generated which provide a way of translating the generated source files back into the original.
Let’s configure the project to generate inline source maps. To do that we can modify the tsconfig.js file located at src/tsconfig.js.
{
"extends": "./tsconfig.base.json",
"compilerOptions": {
"removeComments": false,
"preserveConstEnums": true,
"sourceMap": true,
"inlineSources": true,
"outDir": "../out/vs",
"target": "es2020",
"types": [
"keytar",
"mocha",
"semver",
"sinon",
"winreg",
"trusted-types",
"wicg-file-system-access"
],
"plugins": [
{
"name": "tsec",
"exemptionConfig": "./tsec.exemptions.json"
}
]
},
"include": [
"./typings",
"./vs"
]
}
Following the documentation at https://www.typescriptlang.org/tsconfig#inlineSources, we can set inlineSources to true. It also requires sourceMap to be set to true, so we’ve set that as well. More details on this can be found in the Rookout documentation here. Now we’re almost there.
Lastly, when doing Node.js debugging of Electron applications, the –inspect flag needs to be set which causes the Node.js process to listen for a debugging client. In order to pass the inspect flag, we can modify the VSCode startup script. To do that, we can modify the code.sh script located at scripts/code.sh:
function code() {
cd "$ROOT"
if [[ "$OSTYPE" == "darwin"* ]]; then
NAME=`node -p "require('./product.json').nameLong"`
CODE="./.build/electron/$NAME.app/Contents/MacOS/Electron"
else
NAME=`node -p "require('./product.json').applicationName"`
CODE=".build/electron/$NAME"
fi
# Get electron, compile, built-in extensions
if [[ -z "${VSCODE_SKIP_PRELAUNCH}" ]]; then
node build/lib/preLaunch.js
fi

# Manage built-in extensions
if [[ "$1" == "--builtin" ]]; then
exec "$CODE" build/builtin
return
fi

# Configuration
export NODE_ENV=development
export VSCODE_DEV=1
export VSCODE_CLI=1
export ELECTRON_ENABLE_STACK_DUMPING=1
export ELECTRON_ENABLE_LOGGING=1
# Launch Code
exec "$CODE" --inspect . "$@"
}
In bold above, we can see the place where the –inspect flag has been added. And that’s it, we’re ready to debug!
Let’s Debug a Node.js Application
Now that all the configuration has been done, we are ready to start debugging VSCode in Rookout. First things first, we need to re-compile the project, build the dependencies and then restart VSCode:
yarn compile
yarn
./scripts/code.sh
If everything went well, VSCode should now be running:
Joshs-MBP:vscode jhendrick$ ./scripts/code.sh
yarn run v1.22.10
$ node build/lib/electron
✨  Done in 0.70s.
[20:14:07] Syncronizing built-in extensions...
[20:14:07] You can manage built-in extensions with the --builtin flag
[20:14:07] [marketplace] ms-vscode.node-debug@1.44.32 ✔︎
[20:14:07] [marketplace] ms-vscode.node-debug2@1.42.10 ✔︎
[20:14:07] [marketplace] ms-vscode.references-view@0.0.80 ✔︎
[20:14:07] [marketplace] ms-vscode.js-debug-companion@1.0.14 ✔︎
[20:14:07] [marketplace] ms-vscode.js-debug@1.59.0 ✔︎
[20:14:07] [marketplace] ms-vscode.vscode-js-profile-table@0.0.18 ✔︎
Debugger listening on ws://127.0.0.1:9229/30743951-7f09-4b4f-9d42-ba1329d26c9f
For help, see: https://nodejs.org/en/docs/inspector
[main 2021-08-04T03:14:09.020Z] window: using vscode-file:// protocol and V8 cache options: none
[28010:0803/201414.536367:INFO:CONSOLE(265)] "%c[Extension Host] %cdebugger listening on port 5870 color: blue color:", source: vscode-file://vscode-app/Users/jhendrick/rookout/workspace/vscode/out/vs/workbench/services/extensions/electron-browser/localProcessExtensionHost.js (265)
...
We can now login to Rookout to validate that our SDK connected successfully. Within Rookout we can navigate to the Connected Application page to validate:
From the above screenshot we can see that the SDK connected successfully. Notice that the source origin and revision fields are automatically set. Rookout automatically looks at the .git folder at the root of our application to populate those fields. This allows Rookout to automatically fetch the source code repository when we select our instance and start debugging. Let’s take a look at that next.
Switching to the debugging view within Rookout, we can select the instance to debug:
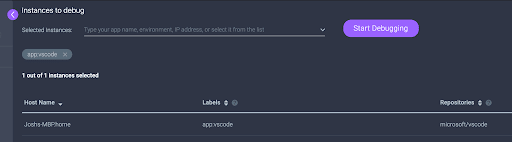
Clicking Start Debugging brings us into the debugging view so we can start setting non-breaking breakpoints within the application.
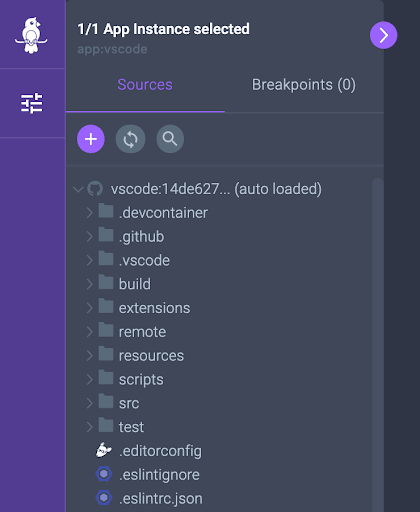
Notice that we see auto loaded in parenthesis next to the repository which means that behind the scenes when we selected the instance to debug Rookout automatically fetched the repository using the GitHub API. This makes it easy to ensure that we’re debugging the same revision of the code which we have checked out locally.
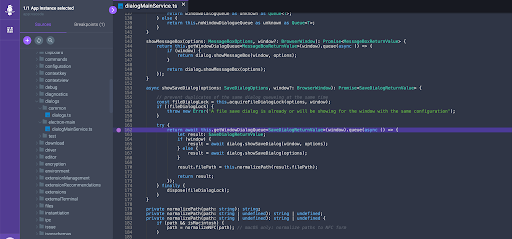
Now we’re ready to set a non-breaking breakpoint. Let’s say we wanted to debug the part of the code responsible for the save dialogue. We can open the dialogMainService.ts file and set a breakpoint:
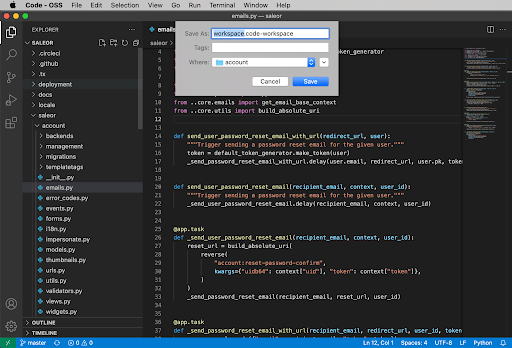
Now we simply need to trigger the code by going to VSCode and saving the Workspace:
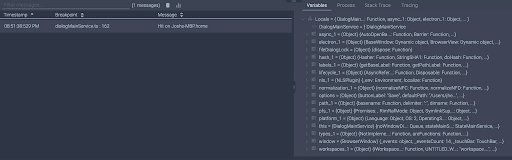
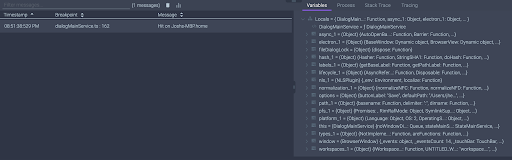
From within Rookout, we can see that we capture a message containing debug data with the relevant contextual information including variables, process information, stack trace, and more:
And that’s it. We’re now able to write code and debug it on the fly using Rookout!
Conclusion
Within this article we showed how easy it is to get started debugging a Node.js application with a production debugger like Rookout. It is a powerful approach to solving issues quickly and efficiently, wherever your application may be running. Even in production.
If you have your own Node.js project, hopefully you can use this as a guide in getting started with setting up Rookout within your project. Rookout not only supports Node.js but also Java and other JVM based languages, .NET, Python, and Ruby. Happy debugging!
Related posts