The Journey To Debugging Other People’s Code
Take a look at your application as it runs on your server or the cloud. You’re so proud of it. Admire it as it’s processing data, interacting with the user, and doing magical things. You should be very proud of it- you wrote a lot of code to make it happen. But, honestly, how much of the code in your application is your code?
You know the answer. Most of the code making the magic happen is third party code, whether that means an npm package you’ve added to handle the JSON parsing, the libraries you use as a part of the runtime, or maybe even you’re running your Java application in JBoss. There is a ton of code that other people wrote, and you’ve added that code to your application or trusted that code to manage your application. But what happens when you have a bug in that piece of code that someone else wrote? How can you debug that which isn’t yours?
Using other people’s code
Looking back 20 years to when you had to write an application, you had two choices. Either you would need to write most of the code yourself or try to scavenge for libraries or open source implementations of what you needed. Since then the open source movement – and with it the world of package managers – has made a giant leap. Nowadays, when you need to perform a certain task in your application or use a framework, the first thing you do is go to your package manager. From veteran tools like the Maven Repository up to the newer ones like npm and pip, you’ll find these package managers everywhere. Installing the package that takes care of business is just a command line away, or even just an edit of a json or xml. In some big enterprises, a different department or team might have even developed a package that you use but are reluctant to share their source code. Even if you don’t explicitly use third party packages, you might eventually run your application on a PaaS such as AWS Lambda or App Engine and your application will be invoked and run by man-made code.
Nobody’s perfect
You might not be aware of it, but the first thing you do when you decide to use someone else’s package or code is to trust it. You wouldn’t install a tire on your car from a manufacturer that you don’t trust, right? You’d want that tire to not melt when it is too hot and not slide when the road is wet. The same logic applies to third-party code. You wouldn’t want it to crash your application or create random unexpected behavior (aka ‘a bug’).
Of course, when you encounter a package that has been downloaded by only a handful of developers or has a repository that isn’t maintained, you’ll likely get suspicious. Yet, when you see a package with a vibrant community and millions of downloads, odds are that you’ll blindly install it. Other times, you might even be forced to use it, as your team might be required to use another team’s package. Whether it be that million of downloads package, or that package that was outsourced abroad, there’s always a chance that it might be buggy.
Yes, you read that right. Even software that has that perfect CI/CD process and hundreds of contributors might be buggy. Or maybe it isn’t buggy, but its API’s documentation is outdated and you’ll end up using it wrong. So what are you going to do when you understand that something just isn’t right about that piece of software?
The blame game
In one of my previous roles, I had the chance of managing what I call a ‘code monster’. This developer was a talent. He wrote amazing code and was a self-proclaimed ‘bugless coder’. At the time, he was writing some complex code for Android, and every time he delivered code that had issues his explanation was: “it wasn’t me, blame Google, they have bugs”. To this day I don’t know whether he was right every time, but I still can’t figure out why he blamed Google. Maybe it’s because he wasn’t using the API properly? And how come he was so confident that the Google developers’ code wasn’t perfect…but his was?

When your application seems buggy, the first thing that you do is start debugging your code. Maybe you’ll re-read your code, add tons of log lines, spin up your application locally and attach a debugger, or maybe even debug remotely like a rockstar with Rookout. However, there often comes a time in which everything seems perfect in your code and you start blaming ‘the other guys’. You tell yourself, “My input to that function is exactly as it should be, but that function keeps outputting nonsense”. In some languages, like Python and Javascript for example, that third party code is usually accessible. You can basically treat it as your own by placing breakpoints with your IDE’s local debugger or even fork it and add custom logs. But debugging those third party codes in compiled languages such as Java and .Net, or even debugging JavaScript’s and Python’s third parties remotely, in production, might be a nightmare.
Non-breaking breakpoints without source code
If this is the first time you’ve heard about Rookout, then let me give you a TL;DR about what we do. We allow developers to place non-breaking breakpoints in their applications in any environment, on-demand. This lets them collect data from the application as if they were using a debugger without pausing or hurting their application’s performance. You tell Rookout to give you a snapshot of the application’s data when the code in file X at line Y triggers and Rookout does it. Rookout collects the local variables, function arguments, tracing data, call stack, and whatever is asked from it to collect. This works amazing with your own code, because you know your code best, and as such from which file and which line you’d like to collect the data.
Rookout’s technology doesn’t really care about the code itself. As far as we care, we can pretty much ignore it. All we really need in order to collect data for you is the file name and the line number and with that, the rest of the magic happens. But how will you know where to point Rookout to collect when it comes to third-party packages that you don’t have the source code, or, if you do have the source code, but don’t have the right revision? You can either try to decompile or simply to guess, as some of our customers do. We decided that we don’t want the task to be so difficult, we wanted to allow you to collect data from other pieces of code as easily as possible.
Giving you a glimpse into the darkness
When our customers told us that they needed our help to debug those third-party packages, we immediately tried to understand where the right place is for them to begin their debugging. We’ve definitely pondered and considered bundling a decompiler with Rookout’s Desktop Application but sometimes that’s too much of a hassle for the user. We also thought about trying to automatically detect and fetch the source code of open source packages, but that only solves the issue for open source scenarios. Eventually, our solution came from asking ourselves where we can pinpoint the places in which we definitely know where the third-party code is executed for our users and where that code has interaction with our customer’s code. That place is the good ole call stack. When you are looking at a call stack (or a stack trace), no matter where it is, you’ll see the code’s execution flow, and it doesn’t matter if that code is yours or not. When you don’t have source code, the light into that darkness can be the stack trace.
Follow the yellow stack trace’s brick road
Let’s take a look at an example stack trace of one of our Java Spring demo applications:
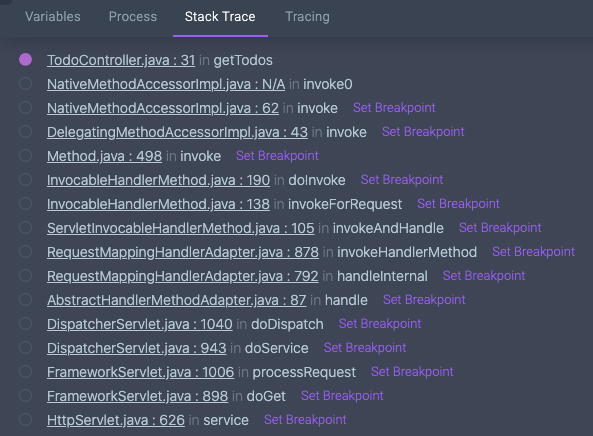
I have a breakpoint set in TodoController.java. I know that that’s my code. Let’s say something isn’t working correctly and I want to see what happens before my code executes. What is all that other stuff in the list? What happens in FrameworkServlet.java in the doGet method? Well, that’s no mystery. I can simply click on “Set Breakpoint” and Rookout will place a breakpoint in that spot for me. I don’t need the code, I just need to look at the information collected from that method.
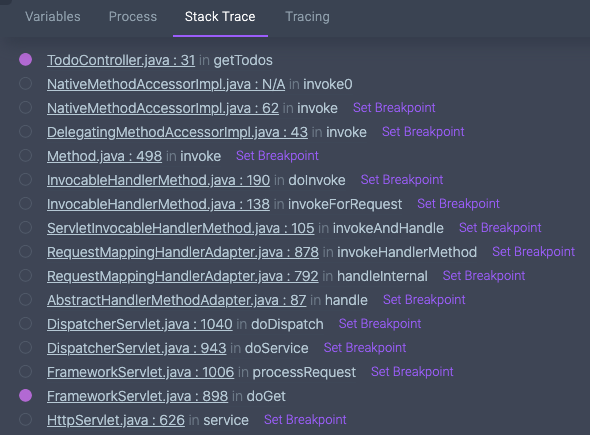
And now, once we have a breakpoint, we can take a look at the data Rookout had collected for me when that method is executed next:
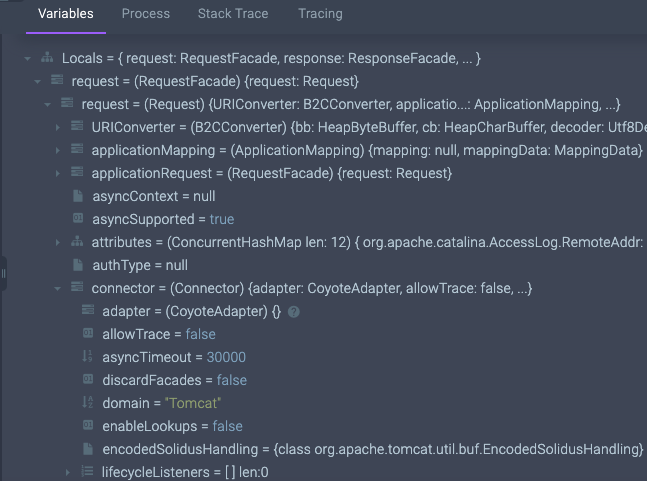
Check it out, I can see the values of locals and arguments in that method, such as URIConverter, ApplicationMapping, and more. These are objects that my web server’s framework is using. I don’t need access to the code in order to get a glimpse into the information the code processes.
Traveling up the stack
Placing breakpoints up the stack isn’t only for debugging other people’s code. We’ve heard our customers ask us to collect all the locals and all the arguments up the call stack once they place a breakpoint. Collecting all that information is very valuable, yet we limit ourselves to collecting variables only in the local scope of where our user places the breakpoint. Our main concern for our customers is to not affect their applications’ performance. Rookout is used as a surgical tool for your code. It collects data in order to solve a specific problem and thus only the information that is needed is retrieved. Collecting too much data can hurt performance. Placing a breakpoint up the stack allows our users to iteratively choose the places where they want to collect the data, making wider data collection possible, but still not blindly and irresponsibly collecting everything.
Good luck in your journey
Debugging code up the stack is open for all of our customers, so go ahead and give it a spin You will find that you will now have a powerful tool that will shed light into those areas that you’ve considered a black box until now.
Related posts