
The Definitive Guide To Kubernetes Application Debugging
Often hailed as a game-changer, Kubernetes has altered the way that organizations deploy and manage their software, making the job of handling larger and more complex workloads easier.
Yet, with its advantages of velocity and scale come new challenges, particularly in how developers approach debugging their code. The highly distributed nature of Kubernetes that makes it so effective for handling cloud-native software means that the traditional approaches to debugging are no longer applicable.
In the hopes of shedding a little light on the challenges faced by developers working with Kubernetes, we explore the factors that make this powerful environment different and offer a number of useful solutions along the way.
Challenges in Debugging a Kubernetes Pod
Even under the most familiar of old school circumstances, debugging can be a frustrating and time-consuming endeavor;
Recreating the bug is often impossible: Long before even attempting to fix a given issue, developers are required to recreate the bug in order to understand what is causing the problem in the first place. This process of running the code in a similar environment is tricky and far from foolproof. There are a wide variety of factors that can impact the code’s behavior and not all of them are possible to truly reproduce. Some of them might even be outside your control.
Customer inconvenience while a bug is fixed: Adding to the stress of attempting to fix the bug, developers are faced with the uncomfortable choice of pushing new builds to gather more information or trying to reproduce the issue in a separate environment. In either case, valuable developer time is spent trying to get to the bottom of the issue while your customers wait for a speedy resolution.
Taking these challenges into consideration, attempting to debug a Kubernetes pod brings with it a whole new kettle of conditions to be contented with. First off, teams must learn how to deploy an application or workload into Kubernetes, which requires understanding how Kubernetes manages your application. The most basic set of Kubernetes resource types to understand includes deployments which describe the desired state of your application, including which pods or ReplicaSets (a set of pods for high availability) to run and which containers should run within those pods. Kubernetes pods are ephemeral, existing for just the period of time that they are needed to do their job. This means that they are often being spun up or spun down, which can make it difficult to pinpoint exactly where an issue may occur.
Whenever possible, developers typically prefer to reproduce issues locally in their own controlled environment. Since running a production replica of your Kubernetes cluster locally is usually not possible, there are a number of approaches that organizations use in order to make debugging easier.
This includes approaches like spinning up local clusters with tools like minikube or even using frameworks like Docker Compose in order to simulate a microservices environment where multiple services are spun up and running at the same time. These approaches are discussed more in depth in this blog post.
Most developers would agree that if issues can be reproduced and fixed by gathering information from the native Kubernetes environment where the issue occurs, it makes life much easier. One potentially improved debugging approach that makes this possible is through a new category of remote debugging tools. These solutions allow developers to collect live data from running applications including local variables and their values, stack traces, profiling data, and even tracing information. To read more about remote debugging see this blog post.
Current Methods for Debugging Kubernetes Pods
Developers currently depend primarily on three categories of methods for how they debug in the Kubernetes environment.
They are:
- Mapping k8s resources
- Logging
- Classic Debugging
Each of these categories could be explored in-depth on their own, but these three provide us with a useful overview of the general framework for thinking about debugging Kubernetes pods.
In the following two posts, we will cover logging and classic debugging. But for now, let’s start off at the beginning with mapping k8s resources using kubectl get pod and kubectl describe pod.
Find and Describe
Everyone knows the feeling of having deployed their pods to only then experiencing that sinking feeling when it fails to run as planned.
The first thing to do is remember to breathe. These things happen and will happen again in the future. The question is how fast can we resolve this issue and get back to running full steam ahead?
The next step should be to get a situation report on the status of the pods. To do this, we want to use kubectl get pods for our high-level status update.
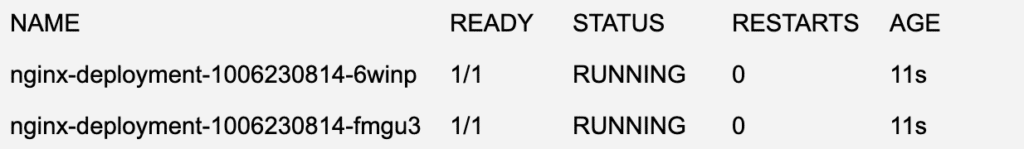
The above kubectl output will let us know if our pods are running as they should be, taking us one step closer to the cause of our issue. Statuses other than RUNNING could indicate a problem with the pods.
With this information in hand, our next step is to dig a little bit deeper into the details with kubectl describe pods.
Name: nginx-deployment-1006230814-6winp
Namespace: default
Node: kubernetes-node-wul5/10.240.0.9
Start Time: Thu, 24 Mar 2016 01:39:49 +0000
Labels: app=nginx,pod-template-hash=1006230814
Annotations:    kubernetes.io/created-by={"kind":"SerializedReference","apiVersion":"v1","reference":{"kind":"ReplicaSet","namespace":"default","name":"nginx-deployment-1956810328","uid":"14e607e7-8ba1-11e7-b5cb-fa16" ...
Status: Running
IP: 10.244.0.6
Controllers: ReplicaSet/nginx-deployment-1006230814
Containers:
  nginx:
    Container ID: docker://90315cc9f513c724e9957a4788d3e625a078de84750f244a40f97ae355eb1149
    Image: nginx
    Image ID: docker://6f62f48c4e55d700cf3eb1b5e33fa051802986b77b874cc351cce539e5163707
    Port: 80/TCP
    QoS Tier:
      cpu: Guaranteed
      memory: Guaranteed
    Limits:
      cpu: 500m
      memory: 128Mi
    Requests:
      memory: 128Mi
      cpu: 500m
    State: Running
      Started: Thu, 24 Mar 2016 01:39:51 +0000
    Ready: True
    Restart Count: 0
    Environment:        <none>
    Mounts:
      /var/run/secrets/kubernetes.io/serviceaccount from default-token-5kdvl (ro)
Conditions:
  Type          Status
  Initialized   True
  Ready         True
  PodScheduled  True
Volumes:
  default-token-4bcbi:
    Type: Secret (a volume populated by a Secret)
    SecretName: default-token-4bcbi
    Optional:   false
QoS Class:      Guaranteed
Node-Selectors: <none>
Tolerations:    <none>
Events:
  FirstSeen LastSeen Count From SubobjectPath Type Reason Message
  --------- -------- ----- ---- ------------- -------- ------ -------
  54s 54s 1 {default-scheduler } Normal Scheduled Successfully assigned nginx-deployment-1006230814-6winp to kubernetes-node-wul5
  54s 54s 1 {kubelet kubernetes-node-wul5} spec.containers{nginx} Normal Pulling pulling image "nginx"
  53s 53s 1 {kubelet kubernetes-node-wul5} spec.containers{nginx} Normal Pulled Successfully pulled image "nginx"
  53s 53s 1 {kubelet kubernetes-node-wul5} spec.containers{nginx} Normal Created Created container with docker id 90315cc9f513
  53s 53s 1 {kubelet kubernetes-node-wul5} spec.containers{nginx} Normal Started Started container with docker id 90315cc9f513
This should give us the full rundown of the state of the pod when the describe command was run. The top sections tell us meta data-related information about the pod including when it was started, labels, and annotation. Below that, we start to see information on the status of the running containers as well as memory, CPU limits, and requested amounts.
Finally, at the bottom is where we can see relevant events that took place within this pod. This could include any potential issues with pulling the container from the container repository as well as issues with starting or scheduling the container to be run in the cluster. You may see statuses such as Waiting, Terminated, or even CrashLoopBackOff which can point you in the right direction as to why Kubernetes could not run your containers.
Logging
Once you are comfortable that your pods are up and running successfully in your cluster, Kubernetes will handle all of the dirty work of scaling and managing the state of your containers based on your deployment files. Kubernetes is an amazing platform for orchestrating your containers and running at scale, but what happens when something goes wrong within your application code and you need to dive in to debug the issue? Although logs don’t always have all the information required to fix a bug, the first place developers typically start is diving into the application logs to find more information about the root cause of the issue. To do this, we can use the kubectl logs command to get more information from our container logs. Running kubectl logs <your-pod-name> will dump the pod logs to the command line.
In real world scenarios, components are often installed across different namespaces as a way to isolate clusters into logically separated spaces within a single cluster. For example, let’s say you had installed nginx within your cluster within the ‘nginx’ namespace. You could access it’s logs with the ‘-n’ flag as follows:
$ kubectl logs -n nginx nginx-ingress-controller-68267cf76e-fy69t
-------------------------------------------------------------------------------
NGINX Ingress controller
  Release:    0.14.0
  Build:      git-734361d
  Repository: https://github.com/kubernetes/ingress-nginx
-------------------------------------------------------------------------------
....


10.118.72.128 - - [5/Jul/2021:14:52:16 +0000] "GET /api/user HTTP/1.1" 200 84
127.0.0.1 - - [5/Jul/2021:14:52:17 +0000] "GET /server-status?auto HTTP/1.1" 200 918
10.4.51.204 - - [5/Jul/2021:14:52:19 +0000] "GET / HTTP/1.1" 200 3124
10.118.72.128 - - [12/Jul/2021:14:52:21 +0000] "GET /api/register HTTP/1.1" 200 84
100.102.130.187 - - [12/Jul/2021:14:52:22 +0000] "POST /api/stats HTTP/1.1" 200 122
Since pods can run multiple containers, you may want to explicitly mention the container that you want the logs for by using kubectl logs <your-pod-name> -c <my-container>.
When viewing logs while debugging an application, it can be helpful to stream logs to the command line in real-time similar to how the “tail” command works in linux. To stream logs you can add the “-f” flag to your log command:
$ kubectl logs -f -n nginx nginx-ingress-controller-68267cf76e-fy69t -c nginx
[Output]
…..
10.118.72.128 - - [5/Jul/2021:14:52:16 +0000] "GET /api/user HTTP/1.1" 200 84
127.0.0.1 - - [5/Jul/2021:14:52:17 +0000] "GET /server-status?auto HTTP/1.1" 200 918
10.4.51.204 - - [5/Jul/2021:14:52:19 +0000] "GET / HTTP/1.1" 200 3124
10.118.72.128 - - [12/Jul/2021:14:52:21 +0000] "GET /api/register HTTP/1.1" 200 84
100.102.130.187 - - [12/Jul/2021:14:52:22 +0000] "POST /api/stats HTTP/1.1" 200 122
……
It can also be helpful to take advantage of Kubernetes labels in order to dump log output from pods with a specific label, such as kubectl logs -f -l name=myLabel –all-containers
Another nice logging utility that can aid developers in gathering log information simultaneously across multiple pods is a tool called Stern. Stern allows you to tail multiple pods running on Kubernetes and multiple containers within that pod. The output and results are nicely color coded to make it easier to identify which logs come from which pods and containers. This is a nice improvement on the standard Kuberentes logging capabilities since in the world of microservices, more often than not you will want to gather logging information across multiple services at the same time. When wanting to tail logs from multiple pods and containers at the same time, Stern’s regular expression syntax for it’s queries makes life much easier.
Classic Debugging
As we’ve seen so far, kubectl allows us to interact with our Kubernetes cluster in various ways from getting information about our deployments and running pods to gathering log data. When diving deeper into debugging a running container, it can be helpful to gather more information by interacting with the running container in your cluster. The kubectl exec command can help with that by allowing you to remotely run any arbitrary command inside your running container in your pod.
kubectl exec ${POD_NAME} -c ${CONTAINER_NAME} -- ${CMD} ${ARG1} ${ARG2} ... ${ARGN}As an example, let’s say you wanted to validate that you can reach a specific server or website from inside your running container. It might look something like this:
$ kubectl exec my-pod-name -- curl -I https://kubernetes.io


HTTP/2 200
cache-control: public, max-age=0, must-revalidate
content-type: text/html; charset=UTF-8
date: Sat, 26 Jun 2021 17:09:09 GMT
etag: "82e2722096cbf73d1cd34ec421afd204-ssl"
strict-transport-security: max-age=31536000
x-frame-options: DENY
x-xss-protection: 1; mode=block
age: 5388
content-length: 26193
server: Netlify
x-nf-request-id: 0d3c5b38-628b-4309-8dd5-5f3953ad6f43-371025130
Or even better, when debugging it can be helpful to get an interactive command-line to your running container so that you can run any sequence of commands to help in debugging your issue:
$ kubectl exec -it nginx-deployment-1006230814-6winp -- /bin/bash
root@nginx-deployment-1006230814-6winp:/#
In cases where you don’t have a shell to exec into, or in cases where a process in a running pod crashed which won’t allow you to exec into it, Kubernetes created a tool called kubectl debug which was introduced in Kubernetes v.1.18. With kubectl debug, Kubernetes injects a container called an EphemeralContainer into a running Pod which allows you to troubleshoot potential issues. In order to use kubectl debug there is some setup and configuration that needs to be done first. Martin Heinz did a great job describing all the setup required to use the debug tool in this blog post.
One additional tool that can be helpful in debugging remote systems locally is the kubectl port-forward command. This could be especially useful when debugging databases, for example. Just as the name suggests, kubectl port-forward allows you to tunnel traffic from your running Kubernetes cluster to your local system where you have access to a wider array of debugging tools.
kubectl port-forward <pod-name> remote-port:local-port $ kubectl port-forward nginx-deployment-1006230814-6winp 27017:27001
Forwarding from 127.0.0.1:27017 -> 27001Once port forwarding is set up from your cluster to your local system, you can start your debugging tool of choice listening on the forwarded port in order to start debugging with the traffic received from your cluster. While this can be a handy tool to use in dev or test environments, this debugging solution isn’t typically practical for debugging production environments due to security risks.
Keeping Your Options Open for Kubernetes Debugging
In this post we have sought to explain some of the out-of-the-box Kubernetes application debugging and logging capabilities that you can take advantage of today. While definitely useful, some of these tools come with their own set of challenges and don’t always give you all of the flexibility you would typically have when debugging and application locally.
When debugging Kubernetes applications, it can often make sense to invest in off-the-shelf solutions that can give more powerful debugging capabilities that can help you get to the bottom of issues faster. Remote debugging solutions like Rookout allow you to instantly collect debug data from applications running in your cluster without having to compromise on security or spend excessive amounts of time in setup of debugging environments.
You might want to read more in our existing resources on how Rookout can help you debug Kubernetes applications.
Stay tuned and see you next time 🙂
Related posts