Adding a Real-Time Layer to Datadog Observability
We all know Datadog. It’s a powerful and established tool that developers, DevOps, and SREs use for anything ranging from monitoring their application’s performance and searching their logs to having an end-to-end understanding of the environment. The nature of cloud-native applications makes the three pillars of observability – (Metrics, Logs, Traces) – needed more than ever to get visibility into your application.
Datadog enhances that by enabling developers to visualize everything in a user-friendly manner that helps them to immediately understand the situation they are in. Unfortunately, developers find themselves in a frustrating position when they don’t have a specific variable, logline, or metric needed to investigate an issue. This is the time when real-time capabilities are needed – and this is where our datadog integration story begins.
Rookout’s newly introduced integration with Datadog adds a layer of dynamic observability to a developer’s day-to-day Datadog usage, thus greatly extending their debugging capabilities. Having the ability to debug applications on the fly, on top of the existing visibility, Datadog provides, increases productivity and adds valuable insights for developers and DevOps teams.
The new Rookout integration for Datadog uses the newly announced Datadog UI Extensions, enriching the user experience with additional features provided on the Datadog’s user interface.
The integration lets you easily collect custom metrics from your code (leveraging Rookout’s Non-Breaking Breakpoints), and send them directly to Datadog. It does so using two components:
- A context menu item for your dashboard widgets that lets you start a debugging session in Rookout, while keeping the context of your Datadog dashboard.
- A custom Datadog dashboard widget for showing all the Non-Breaking Breakpoints that have been set in Rookout and send metrics to Datadog.
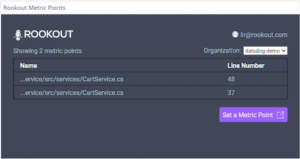
The new custom dashboard widget by Rookout
Adding the integration to your Datadog environment is quite easy.
First, make sure you are already using Rookout and have deployed it to one of your applications. If you haven’t, see our docs or contact us to get it up and running.
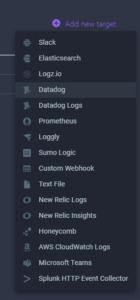
Once you have Rookout deployed, go to your Datadog integrations page and search for ‘Rookout’, then click ‘Install’.
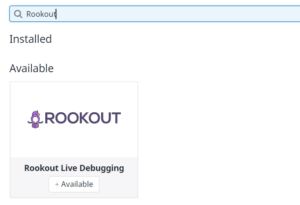
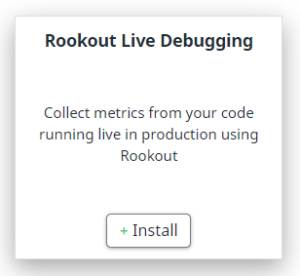
Installing the integration
In order to configure Rookout to send metrics to Datadog, go to your Rookout ‘Targets’ settings page under the Settings menu (cog icon). Then, click ‘Add new target’, choose Datadog, and fill in the required fields.
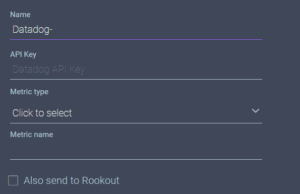
Adding the Datadog target
Now that Rookout is ready to send data over to Datadog, let’s choose a Datadog dashboard in which the new data will be shown. In Datadog, choose any time-series graph you would like to show new data in, and add a corresponding label to its title. For example [env:production]. This label will tell Rookout which services to automatically choose for you once you start debugging from this graph. For more information about Rookout’s labels and filters, see this docs page.
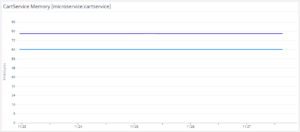
Adding the Rookout label to the title
You should be all set by now. From now on, every time you need to troubleshoot something using Datadog, all you have to do is click the graph, click ‘Set Metric Points’ and place some Non-Breaking Breakpoints with “Datadog” as their target and you’ll find the source of your issue in no time.
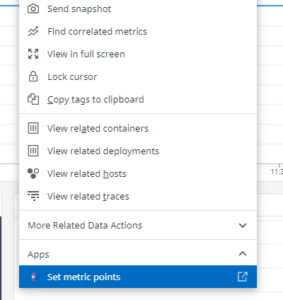
Rookout’s context menu item
In Rookout we believe that every engineer should be able to gather any data point from their application in real-time and be able to provide real-time answers about any issue in their production, dev, or staging environments. The newly introduced integration caters this capability to Datadog users and takes their Observability capabilities one step higher by adding dynamic layers to it.
For more information about the integration and debugging process, watch this video. And you have any further questions, don’t hesitate to contact us.
Happy Debugging!
Lir Locker
Product Manager
Rookout
Related posts