Enter the Metrics: Measure App Performance In Real-Time, On-Demand
When it comes to understanding what’s happening in your code – and your service health, specifically – business and code-level metrics are key. While most developers are experts in their own code, that doesn’t mean that they’re also experts on the app metrics, statistics, or distributed tracing from the code they’re working with.
The code-level metrics they need are tough to set up and it’s something that no one else can do for them. Instead, developers must go through the motions, iteration after iteration, testing new metrics, and learning what works. And then go through all of that again. Not only is this extremely frustrating, but it’s expensive. We’re talking cloud costs, wasted developer time, and more.
Well, all of these costs, lost time, and unnecessary code aren’t just a glitch in the matrix that you seem to be caught in. They’re real. And they hurt. I think we can all agree that we’ve felt it.
So what can they do to get the answers they need and dive deep into their code to understand precisely what’s going on?
The simple answer is having a tool that will enable developers to get the metrics they need, on the fly, in real-time. This should be a basic capability when developing software. Even more so, you should be able to do this intuitively and quickly when dealing with application performance in your production environments.
That’s why we’re now introducing Rookout’s new Live Metrics capabilities.
Live Metrics For Your App Performance
With Live Metrics, app developers can now measure the response of their application in real-time, on-demand, from any point in the code, in any environment. They can track how many times a specific line of code is reached, without stopping execution or losing state.
Developers are given comprehensive visibility into their application’s performance, including rate metrics. This allows them to troubleshoot across various platforms and environments, including cloud, serverless, and on-premise.
Developers might also want to be able and connect the different metrics into the code lines and analyze them together to get the most valuable insights. Now they can do it with Live Metrics.
We know this might sound too good to be true, but it’s not. Live Metrics isn’t just useful, it’s also performant, read-only, and safe.
How Does It Work?
Let’s dive in:
- Effortless metrics collection
Traditionally, connecting code to business value requires spending many engineering cycles instrumenting code by hand to experiment and test various metrics. Rookout builds on our patented, ground-breaking Dynamic Observability technology to allow users to instrument any line of code, on the fly, with a click of a button.
It’s very simple. With our new Live-Metrics tool, all you need to do is use the Live Metrics mode and add the desired non-breaking breakpoints on any line of code. Once your code lines are triggered, you will see its custom metrics per code line, in a real-time graph. Each breakpoint will receive a unique color, and you will be able to easily define the specific code line to the specific metric, with a very simple view.
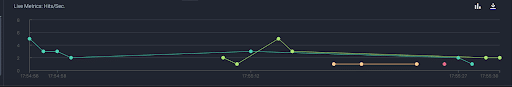
- Real-time application performance monitoring
Live Metrics will give you the opportunity to understand your relevant metrics in real-time, by using a live graph that tracks your code activity and shows it on the fly. All you have to do is lean back and wait for your code to be triggered.
Once it is, we will collect your custom metrics, and you will be able to watch it appear live.
- Free customizable metrics data
At Rookout, the core of our business is orchestrating data collection rather than processing the data being collected. This gives us the benefit of not having to worry about that annoying conflict of interest where we charge extra from users who collect more data.
- Visualization on the fly
To help developers make the most of Observability data, we believe in keeping it simple and tying it directly to the code. This ensures that developers are familiar with the data through tight integrations with the deployment processes and Git providers.
Developers can set the desired custom metrics in their code, and visualize them on the fly with a live graph. You can also change the view and quickly jump from one view to another.
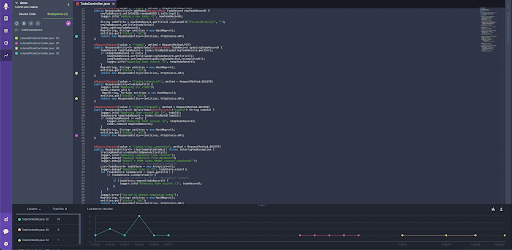
- Side-by-side analysis
With Live Metrics, you can see the data alongside the code, taking away the guesswork, tab-switching, and, worst of all, Git history diffing from the process of analyzing metrics.
Better Together
Live Metrics is but one part of the efficient troubleshooting and debugging puzzle. It works seamlessly with Rookout’s other tools, the Live Debugger and Live Logger, to provide a complete view of an application’s performance and behavior.
Gone are the days of waiting for long deployment cycles and wasting resources. Together, these three tools form the perfect solution for any dev workflow, allowing developers to identify and resolve issues more quickly, effectively, and ultimately, at a much lower cost with much less pain.
So if you’re tired of wasting resources and endless deployment cycles, give it a try. It’s free, so no excuses. Let us know what you think.
Related posts