Pinpoint Application Failures with Distributed Tracing
When building modern software architectures there can be many moving parts that while adding to the flexibility of software, can also make them more complex than ever before. With software now being built in smaller, more discrete components, issues can occur at many different layers across the stack, making them more difficult to track down. For this reason, it’s important to integrate modern observability practices into software development in order to get better insights into what’s happening behind the scenes while your software is running. Traditionally there have been three main pillars of observability which include logs, metrics, and traces. While all three of these areas add value to an observability stack, in this blog we’ll focus on distributed tracing and the value that it provides when tracking down the root cause of issues.
Distributed tracing allows teams to understand what happens to transactions as they pass through different components or tiers of your architecture. This can help to identify where failures occur and where potential performance issues might be occurring in your software. While tracing by itself can provide valuable insights, when combined with logs, metrics, and other event-based information, you’re able to understand a more complete picture of what happened as a transaction traveled throughout a software system.
How Distributed Tracing Has Evolved
Distributed tracing has come a long way over the years and has evolved into a key pillar of observability in a very short period of time. In 2012, Twitter open-sourced their internally built distributed tracing system Zipkin, which they initially built to help gather timing data for services involved in requests to the Twitter API. Zipkin included APIs to instrument your code for trace collection as well as a UI to visualize tracing data in an intuitive manner and was widely adopted by the community.
A few years later, Jaeger, another tracing platform for monitoring and troubleshooting microservices, was released by Uber and subsequently donated to the Cloud Native Computing Foundation. Jaeger was released with inspiration from Zipkin and another distributed tracing project from Google called Dapper. With three major players in the technology industry releasing open-source support for distributed tracing, it was off to fairly wide adoption very quickly.
Introducing Standards
Anytime that new and widely adopted technology comes to market there are often many different or even competing implementations that can differ slightly making interoperability a challenge. Looking at teams that have adopted the microservices architectural approach, different services may be handled by different teams who can potentially be using different tooling. When adopting tracing technologies this potentially means that unless all teams are using the same tracing tools and observability approach, there may be challenges in tracking traces across all tiers of the architecture in a consistent way.
This led to an increasing need for standardization on tracing approaches. OpenTracing was the first major standard to try to consolidate guidelines for tracing implementations. OpenTracing focused specifically on tracing standards by providing a set of vendor-neutral APIs and was widely adopted. OpenCensus then came about as a standard introduced by Google and focused on standards for both tracing and metrics. Finally, around 2019, OpenTelemetry was introduced in attempt to combine both OpenTracing and OpenCensus into a single project focused on standards for telemetry data including logs, metrics, and traces. As of this blog, OpenTelemetry has launched version 1.0 of its specification.
Understanding a Trace
If you’re not familiar with tracing, some of the terminologies can be confusing at first. I’ll break down a few of the terms you’ll see mentioned in the context of tracing here.
Transaction or Request
This refers to a message or communication sent between services or components in your architecture that you may wish to track
Trace
A trace is a collection of performance data about a transaction as it flows through different components or tiers of your architecture. The goal of a trace is to collect performance information that can be used to pinpoint where failures or performance issues occur in your software.
Span
A span is a building block of a trace and represents a single segment of a transaction’s workflow through a service or component in your software.
Trace or Span Context
Information that is passed between segments of a trace in order to propagate details about the trace that are required to build a complete end-to-end trace. This includes things like trace ID, parent span ID, and potentially other information.
How Does Distributed Tracing Work
Now that we’ve reviewed some vocabulary in the prior section, let’s look at how distributed tracing works as a request passes through an application. Consider a microservices-based architecture where a request passes through one service and then on to many other services in the course of a typical interaction with the application. When that initial request enters the system that has been instrumented with tracing libraries, it’s assigned a trace ID which can be used to identify the trace and its associated spans. As that request moves along to additional microservices, additional spans (or child spans) are created and attached to the same trace ID. This makes it easy to see the flow of that request from service to service using the tracing tools web interface when doing later analysis.
Each tracing span can provide additional information which helps in the diagnosis of performance issues within the application. This includes things like the operation or service name, a start, and end timestamp, tags to annotate spans, logs and events which can capture logging or debug information from the application, and other metadata. Using the tracing provider’s front end, you can view all of this information in a simple tree-like structure in order to follow the flow of a transaction across different services in your application.
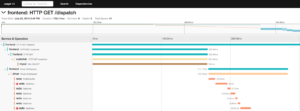
A sample trace may look something like the screenshot below. Looking at the details of the trace, notice the first transaction comes through the frontend service followed by a call to the ‘customer’ service and so on. As part of this trace, you not only see the sequence of events that occurred for this specific transaction, but we also see timing data associated with each service call. Clicking into any specific span within a trace may also give more detailed information as discussed above such as timestamps, tags, and even log data.
Conclusion
Modern software architectures are becoming increasingly complex and issues can often be difficult to track down. Having a complete observability stack incorporating logging tools, metrics, and traces can ease the burden on developers when tracking down those hard-to-find bugs. Over the past decade, tracing has become a staple in most well-rounded modern observability stacks. Standards are beginning to take shape and large enterprise organizations are starting to adopt them as they look to maintain their ability to stay vendor-neutral.
At Rookout, we support distributed tracing by enhancing your debugging session with contextual tracing information. Viewing Rookout debug snapshots side by side with your application tracing information gives a more complete picture of what’s happening when you’re looking to troubleshoot complex issues. The tracing space has evolved and grown heavily in a short period of time, but will have many more new innovations coming in the future that can make your troubleshooting practices more effective and help you get to the bottom of issues faster!
Related posts