Rookout is now a part of the Dynatrace family!

Table of Contents
Get the latest news

Shifting Right in Software Development: Adapting Observability for a Seamless Development Experience

Liran Haimovitch | Co-Founder & CTO

Table of Contents

You’ve probably heard of the “shift-left” mantra as it echoes throughout the tech industry. And if you haven’t, let me be the first to update you that you’ve been living under a rock. Like a real rock, not even a figurative one.

In all seriousness, ‘shift-left’ has shaken things up quite a bit in the tech industry, bringing with it a paradigm shift in how we approach software development. 

The shift-left approach aims to make it so that bugs and other issues are discovered and addressed early in the development process, leading to improved software quality and lower costs associated with late-stage troubleshooting. This has also somewhat shifted the burden of software quality, no longer confining it solely to the realm of QA teams. Developers, project managers, and even business stakeholders are now more involved in maintaining and enhancing the quality of the software, creating a sense of shared ownership and facilitating better organizational efficiency.

Despite the immense benefits of the shift-left approach, a fascinating counterpart is emerging in the industry – the shift-right. Today, engineers are spending an increasing amount of time developing and testing code in production-like environments. This movement towards the right, so to speak, has its implications. From navigating through the complexities of the development environment to troubleshooting software in production-ready stages, the challenges are different and often more complex. However, by integrating effective Observability tools throughout the SDLC, we can overcome these challenges and ensure smoother sailing.

Challenges in the Development Environment

One of the biggest issues when shifting right is the increased complexity within the development environment. Developers, normally confined to the cocoon of the coding stage, are finding themselves thrust into production-like environments rife with intricate dependencies and broader-scale issues. 

And let’s be real; these environments aren’t as forgiving as the sandbox playgrounds we’re accustomed to. They’re replete with real-world variables and anomalies, making debugging a complex endeavor, even for the bravest of developers. For developers, the familiar luxury of single-step debugging is replaced by multi-factor interactions, making it harder to identify the root cause of issues.

Navigating this environment requires a refined toolset. Developers need Observability tools that can deal with the intricate layers of production-like environments, illuminating their path through the dense forest of code. These tools need to be resilient and versatile, capable of providing insights throughout the software development lifecycle. This allows developers to examine the full lifecycle of code, from inception to execution, and efficiently troubleshoot any arising issues.

Challenges in Testing Environments

Testing is no longer just a standalone phase sandwiched somewhere in the middle of the development process. Instead, it’s making its way through the entire lifecycle. It’s like a surprise party guest popping up when you least expect it – only this time, it’s less about the surprise and more about ensuring that the software we’re crafting is as robust as possible.

The testing environment is becoming more real-world-like, more dynamic, and way more complex. It’s no longer just about testing isolated bits and pieces of code. It’s about seeing how the whole jigsaw fits together in a production-like setting. The goal? To create a mirror-like reflection of the final stage, allowing us to see the potential mishaps and fix them, hopefully, before they crash the party.

Why the sudden change in tune? Well, it’s simple. Modern software development is striving for software that’s not just great on paper but truly shines when it hits the real-world stage. This shakeup is a step in that direction, ensuring that development teams are not just building but building right. But as with all good things, this comes with a fresh set of challenges, especially when it comes to debugging and troubleshooting software. Thankfully, the right Observability tools are coming to the rescue, helping us keep pace and stay in sync with the new rhythm.

Challenges Launching New Code/Features

The cherry on top of software development is the actual launching of new code or features, akin to launching a rocket into space. Maybe in actuality, it’s not as dramatic, but it pretty much feels that way. It’s a big deal.

This stage is exciting but can also feel quite stressful. On one hand, you’re excited about the new possibilities and enhancements. On the other hand, well, we’ve all seen how many bugs can pop out when you least expect them to. 

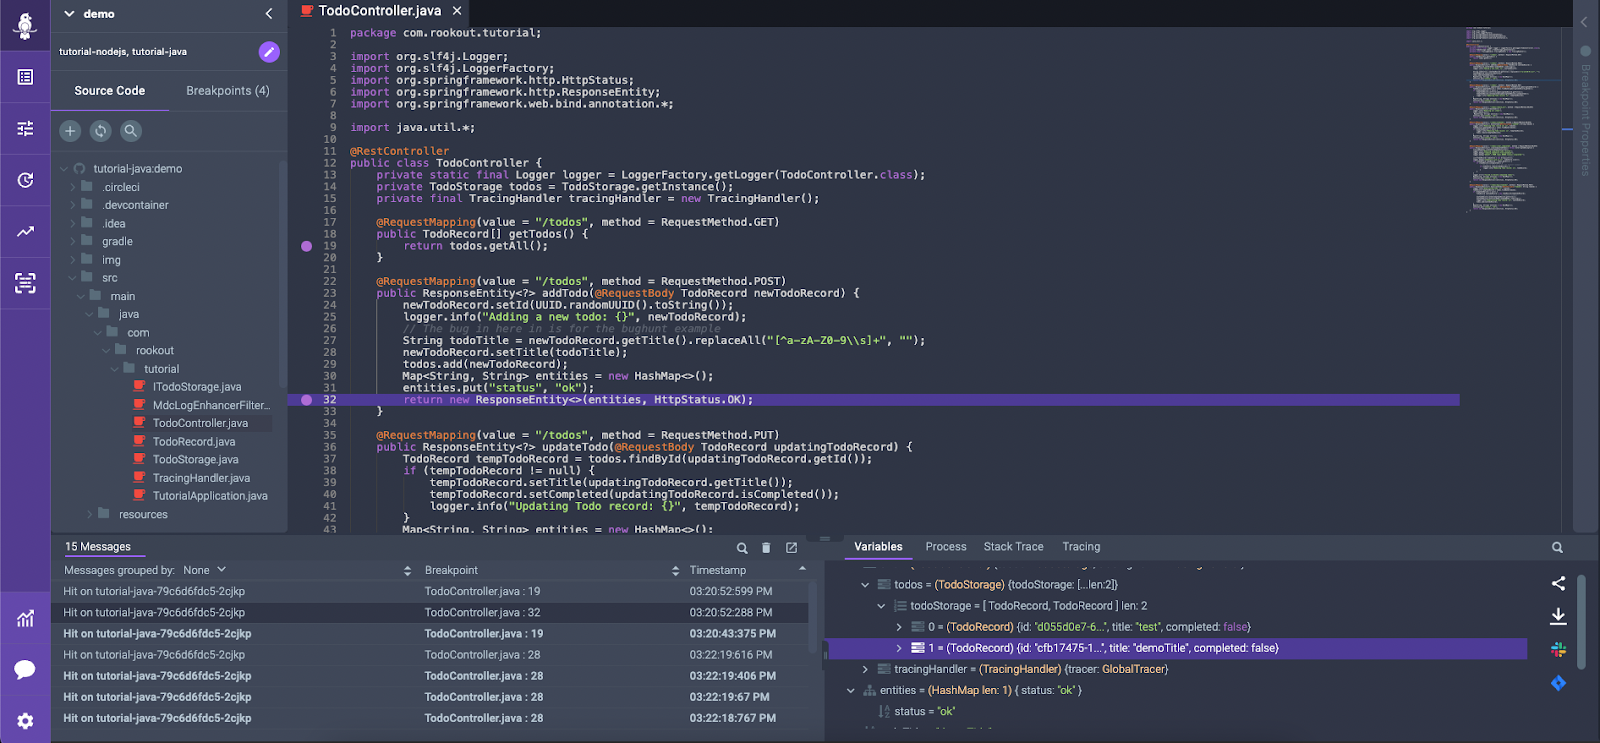
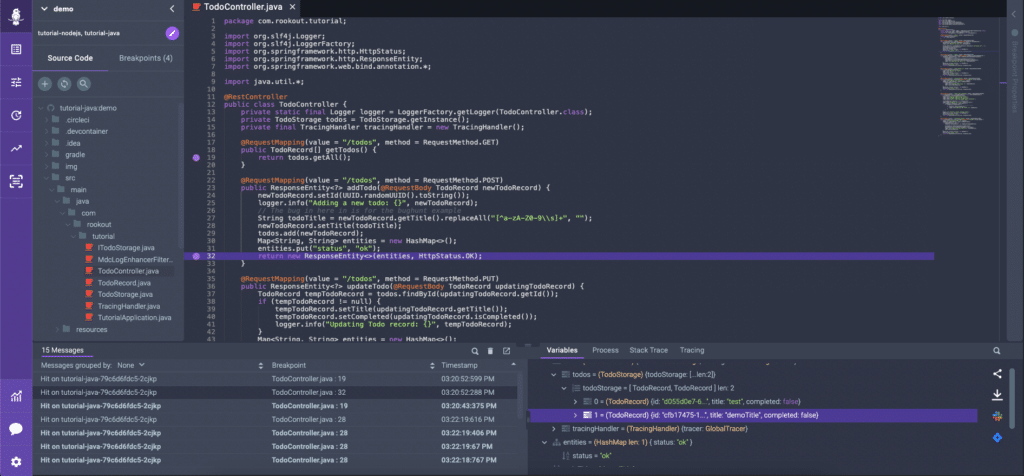
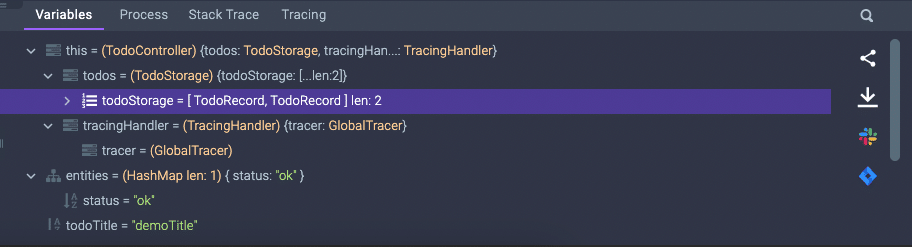
So how can we ensure a smooth release? Take it a step further and ask yourself how we can do that and minimize customer impact, too. The answer is pretty simple: get your team the proper dynamic Observability tools. With these, you’ll be able to illuminate your path through your code, giving you a clear view of your code’s performance in the real world, and allowing you to find and squash those pesky bugs before they cause any harm. You’ll be able to understand exactly what’s happening in your code at any given moment.  It gives you a high-resolution, real-time view of your code as it runs. You know, like having x-ray vision, but for your code. 

And one such tool that provides exactly these capabilities is Rookout. With Rookout, you can see what’s wrong, fix it, and get back to doing what you do best – creating awesome code and new features. 

Smooth Sailing and Seamless Deployments

The shift-right in the software development lifecycle is a reality that can’t be ignored. It presents its challenges, from debugging in complex environments to troubleshooting software in real-world conditions. But it also brings us closer to the reality of our end-users, allowing us to deliver higher-quality software.

Observability tools are our allies here, equipping us with the means to navigate these intricate landscapes. They provide the necessary visibility into the SDLC, transforming the daunting task of debugging and software troubleshooting into a manageable – dare we say even enjoyable? – part of the development process.

So, while the industry is still humming the shift-left tune, it’s time we embrace this shift to the right. After all, it’s in these real-world, production-like environments that our software truly comes to life. And isn’t that what we, as developers, live for? The thrill of seeing our code in action, making a tangible difference in the world? That’s the magic of software development, and with the right tools, it’s magic we can master, regardless of where we are in the software development lifecycle.

If you’re interested in diving further into this topic, check out my full webinar with SD Times. 

Rookout Sandbox

No registration needed

Play Now

Table of Contents
Get the latest news

Observability Tools: Cutting Costs Without Compromising on Quality

Liran Haimovitch | Co-Founder & CTO

Table of Contents

In software development, striking a balance between cost and quality can sometimes feel as tricky as finding a bug in a spaghetti code. Observability tools face a similar dilemma, often consuming a significant portion of the budget and growing significantly year over year. The irony? The vast majority of the data gathered is never used. 

As is often the case, the driving force behind this trend is not an emotional response. It’s one that’s more commonly seen in social circles than in software engineering. If you’re assuming that we’re speaking about FOMO (the Fear of Missing Out) you’re correct. Specifically, here we’re speaking of a very specific type of FOMO called ‘Logging FOMO’.

This ‘Logging FOMO’ creates an atmosphere where data is endlessly collected and stored, much like my wife’s collection of “just in case” items (I love you, hon!). Engineers, driven by the apprehension of missing out on a critical log that could hold the answer to some future doomsday bug, continually log data, leading to a surplus of irrelevant information. The fear of the unknown has a prominent role in this dynamic. The notion of the missed log being the key to preventing some hypothetical armageddon encourages engineers to cast an overly broad net with their observability tools. However, this leads to a paradox of plenty – too much data, too little time, and often too few useful insights. 

Jokingly, we often compare logs to Schrödinger’s cat – they’re simultaneously extremely useful and utterly useless until you observe them. But what if we could ensure that engineers can get the data they need, when they need it, without this looming fear? Enter dynamic observability – a possible solution to break this cycle of fear and wastage.

What Is Dynamic Observability?

We can all agree that the traditional approach to observability often leaves engineers overwhelmed and organizations over budget. Attempting to collect everything needed to answer every possible question in a cost-effective manner is a fool’s errand. Dynamic observability is an evolution of static observability and has been created for the needs of the modern, fast-paced world of software development.

Dynamic observability is about creating tools and processes that allows engineers to interrogate their applications and get answers to their questions in real-time. Rather than continuously collecting, storing, and sifting through endless data points “just in case,” developers are able to collect the needed data at the appropriate time. It gives engineers the power to investigate and understand their software systems in-depth at any given moment.

This shift from a static, always-on data collection to a more intelligent, on-demand data retrieval is the core of dynamic observability.

This method has changed how engineers interact with their organization’s systems and data, tackling every question with prime data of choice rather than wading through an ocean of (useless) logs. It’s about working smarter, not harder, and turning the fear of missing out into confidence in finding out.

Cutting Back on Logging: The Secret To Cost Reduction

If you look at most logging aggregation environments out there, you’ll quickly see that developers are responsible for a disproportionate slice of the logs. After all, ops and support tend to stick to the high-level logs they are familiar with, while developers are diving deeper into those obscure, debug-level logs nobody is familiar with.

If your software engineers are now relying on dynamic observability, you’ll probably find that 80% (or more) of your logs are not needed anymore. Not even for those pesky “just in case” scenarios.

The easiest and first step to cost reduction is to turn down log verbosity. After all, if you have live logging and snapshots at your fingertips, what are you really missing out on? 

Next, you can confidently apply a more aggressive log management strategy. This can include steps such as removing (or converting to metrics) noisy, frequent, or large logs. You can read all about it right here. You’ll find that once developers are no longer as attached to those individual log lines, those very difficult tradeoffs you’re weighing will be made so much easier. 

Not Ready to Go Cold Turkey?

Changing people’s habits can seem a bit of a daunting task at times, and quitting on your continuous dose of logs in favor of a promising new replacement might be too much for the faint of heart. This is where a recent paradigm shift in logging comes to the rescue.

Your log pipeline and/or provider most likely offers ways to easily archive logs to cold storage and load them on demand. This will often result in 90% of the aforementioned cost savings while still offering you a safety net. If something goes wrong, if you do end up needing one of those logs for whatever reasons, they are just a few clicks away.

Static Observability is Inherently Overpriced

The fear of the unknown should not drive your cloud observability strategy nor balloon your costs out of control By giving engineers alternatives to overlogging, you will not only make them happier and more productive, but you’ll also see your Observability costs drop.

This is where Rookout’s Developer-First Observability tools come into play. Designed to answer the questions software engineers ask day in and day out, Rookout provides a dynamic observability solution that cuts through the noise. Its live debugging and live logging capabilities allow engineers to understand their code’s behavior without the need for additional coding, redeployments, or restarts.

So what are you waiting for? Empower your engineers. Reduce your logging costs. Embrace the future of Observability. It’s really that easy.
If you want to hear more on this topic, check out my webinar with SDTimes here.

Rookout Sandbox

No registration needed

Play Now

Table of Contents
Get the latest news

The Collaboration of Code: JavaScript, TypeScript, and CoffeeScript

Liran Haimovitch | Co-Founder & CTO

Table of Contents

In the vast universe of coding, JavaScript has earned itself a reputation of being a dynamic, high-level, interpreted language, often employed for building user experiences on the web. However, as the complexity of web applications increased, developers craved more structure, static typing, and syntax variations. 

Enter the JavaScript dialects. They can be seen as extensions of the original JavaScript, with each one providing alternatives suited to diverse needs and preferences. However, these dialects are more than just mere add-ons. Rather, they are powerful tools designed to cater to modern development needs, address JavaScript’s idiosyncrasies, and bring a fresh perspective into the coding world.

Understanding JavaScript

Since JavaScript was introduced in 1995, its versatile nature has allowed it to accommodate different styles, making web pages interactive and dynamic. Its syntax, influenced by Java and C, is easy to grasp, and its features, such as first-class functions and prototype-based inheritance, make it delightfully flexible. 

However, JavaScript has often drawn criticism for its loosely typed nature and unpredictable behavior (like its infamous coercion rules). Its execution speed, while impressive for a high-level language, may lag behind more performance-optimized languages. Despite this, JavaScript’s universal browser support and immense community backing make it a beloved language across the globe.

The Structured Approach of TypeScript

Think of TypeScript as a more formal and structured version of JavaScript. Launched by Microsoft in 2012, TypeScript is a statically-typed superset of JavaScript, adding a layer of formality to the dynamic JavaScript. 

TypeScript’s syntax is a slightly stricter, classier version of JavaScript’s. It introduces static types, interfaces, and classes (even before ES6 did). This structured approach makes TypeScript a knight in shining armor for large-scale applications, where static typing prevents many potential bugs at compile-time. 

However, the TypeScript dance isn’t as fast-paced and agile as pure JavaScript. The extra step of compilation can slow down the development process. Furthermore, TypeScript’s community, although growing, is not as large as JavaScript’s, and its browser support is indirect – TypeScript code needs to be transpiled to JavaScript for execution.

With that being said, TypeScript shines in the enterprise world, where its type safety and auto-completion features are greatly valued. Learning and using it may require more effort, but many developers find the enhanced tooling, better structuring, and safer coding practices worth the extra steps.

The Streamlined Syntax of CoffeeScript

CoffeeScript, introduced in 2009, is a more streamlined, simplified variant of JavaScript. It was created to improve JavaScript’s readability and conciseness, and it does so while maintaining its essential functionality.

CoffeeScript’s syntax is heavily inspired by Ruby and Python, favoring the ‘everything is an expression’ principle. This results in a clean, minimalistic code that’s a breeze to read and write. It introduces syntactic sugar like array comprehension, destructuring assignment, and classes, making your code look like a well-choreographed dance sequence.

However, like TypeScript, CoffeeScript needs to be transpiled to JavaScript for execution, adding an extra step to the development process. Also, debugging can be a bit tricky as the generated JavaScript might not resemble the original CoffeeScript code.

In terms of adoption, CoffeeScript had its moment of fame but has been shadowed by TypeScript and modern JavaScript (ES6+) in recent years. Despite that, its influence on JavaScript development is undeniable, and it continues to maintain a loyal following in the community. It may not be everyone’s cup of tea, but for those who prefer a Pythonic syntax and a more concise way to write JavaScript, CoffeeScript hits the sweet spot.

So, JavaScript, TypeScript, or CoffeeScript?

Choosing between JavaScript, TypeScript, and CoffeeScript isn’t a matter of good or bad, but a question of needs, preferences, and project requirements. JavaScript is well-suited for most web development tasks. TypeScript is great for large-scale, enterprise applications where type safety is crucial. CoffeeScript, adds a dash of fun and simplicity to coding, making it a good choice for those who value readability and conciseness. 
No matter which one you choose, Rookout has you covered with Dynamic Observability and Live Debugging throughout the software development lifecycle from development all the way to production. Sign up right here.

Rookout Sandbox

No registration needed

Play Now

Table of Contents
Get the latest news

Top 5 Python Web Frameworks: Unlocking the Power of Python for Web Development

Liran Haimovitch | Co-Founder & CTO

Table of Contents

Welcome to the exciting world of Python web frameworks. Python, which is known for its simplicity and readability, has gained immense popularity in web development. But what exactly are Python web frameworks, and why do you need them? If you’re a developer – or an aspiring one – settle in and read on. 

Let’s begin with the basics. Python web frameworks are powerful tools that simplify and streamline the process of building web applications. They provide a structured approach to development, allowing you to focus on writing your application’s logic rather than dealing with low-level details. With a plethora of frameworks to choose from, rest assured that you can find one that suits your development style and project requirements. However, that may be a bit overwhelming. That’s why we chose the top 5 frameworks for you. 

In this blog post, we’ll explore the top 5 Python web frameworks, each with its own unique strengths and features. We’ll delve into their histories, syntax, key features, adoption rates, community support, and performance. By the end of this journey, you’ll have a solid understanding of the Python web landscape and be ready to embark on your next web development adventure. And if you don’t, well…

Flask: Lightweight and Flexible 

Imagine you’re building a web application, and you want a framework that’s as light as a feather, yet powerful enough to meet your needs. Enter Flask. It’s a delightful microframework that doesn’t impose unnecessary complexity. This makes it a perfect choice for small to medium-sized projects, allowing you to get up and running quickly.

Flask was created by Armin Ronacher in 2010 as a simpler alternative to more feature-rich frameworks. Its elegant syntax and minimalistic design make it quite enjoyable to work with. Additionally, Flask encourages simplicity and gives developers the freedom to choose their preferred extensions for features like database integration, form validation, and authentication.

With a thriving community and extensive documentation, Flask is well-supported and widely adopted. Its ease of use and flexibility make it popular among both beginners and experienced developers. However, due to its minimalist nature, Flask may not be the best fit for large-scale applications requiring built-in functionality and robustness.

Django: The Batteries-Included Web Framework 

Once upon a time, a web framework emerged that promised developers a complete package for building complex web applications effortlessly. That framework was Django. Developed in 2003, Django quickly gained popularity for its pragmatic design philosophy and powerful feature set.

Django follows the “Don’t Repeat Yourself” (DRY) principle, emphasizing code reusability and reducing boilerplate. Its syntax, inspired by Python’s elegance, allows developers to express complex ideas concisely. With built-in modules for database integration, URL routing, user authentication, and more, Django provides a comprehensive toolkit that accelerates development.

With a strong and passionate community, Django has become one of the most popular Python web frameworks. Its adoption is widespread, especially in larger applications requiring scalability and security. However, Django’s all-inclusive nature can sometimes be overwhelming for small projects or developers who prefer a more lightweight approach.

Pyramid: Scaling the Pyramids of Web Development 

Imagine you’re constructing a grand project. Of course, when doing so, you’ll need a web framework that can handle the weight of your ambitions. Enter Pyramid, a versatile and scalable framework that’s built to handle projects of any size.

Introduced in 2010, Pyramid was born from the merger of two popular Python web frameworks, Pylons and Repoze.bfg. It combines the best of both worlds, offering powerful features while maintaining a flexible and lightweight structure. Pyramid’s syntax is intuitive and expressive, allowing developers to focus on writing clean and maintainable code.

One of Pyramid’s standout features is its ability to scale effortlessly. Whether you’re building a small application or a complex enterprise system, Pyramid handles it all. It provides a modular architecture, allowing you to easily plug in additional components and libraries as your project grows. This extensibility makes Pyramid a great choice for projects with evolving requirements.

Pyramid boasts an active and supportive community that provides comprehensive documentation, tutorials, and examples. Its adoption has steadily increased, with many developers appreciating its flexibility and scalability. However, due to its flexibility, Pyramid may require more initial configuration compared to some other frameworks, making it less suitable for developers looking for an out-of-the-box solution.

Bottle: Small, Yet Mighty

Bigger doesn’t always mean better, as Bottle has shown the software development world. Don’t be fooled by its size, though. This compact framework packs a powerful punch. If you’re looking for a lightweight and minimalist framework that gets the job done without fuss, Bottle should be your go-to choice.

Bottle was created in 2010 and designed with simplicity in mind. Its syntax is concise and easy to grasp, making it an excellent option for developers who prefer straightforward and minimalist frameworks. Bottle comes with built-in support for routing, templating, and accessing databases, allowing you to quickly build functional web applications.

Bottle’s small footprint makes it an ideal choice for small projects, APIs, and microservices. It’s also a great option if you need to embed a web server within your Python application. The framework’s performance is impressive, and its simplicity allows for rapid development and deployment.

Although Bottle has a smaller community compared to some other frameworks, it has a dedicated user base that appreciates its simplicity and efficiency. It may not be the best fit for large-scale projects requiring extensive functionality or advanced features. However, if you value simplicity and lightweight design, Bottle could be the perfect framework for your next endeavor.

Tornado: A Storm of Asynchronous Power

Imagine a framework that can handle asynchronous web development with ease. Enter Tornado, a high-performance web framework built for speed and scalability. If you’re looking to build real-time applications, chat servers, or high-concurrency systems, Tornado is the framework you need.

Born at FriendFeed in 2009 and later open-sourced by Facebook, Tornado is known for its non-blocking architecture, making it highly efficient in handling a large number of concurrent connections. Its syntax, inspired by the simplicity of Flask, is easy to learn and work with.

Tornado shines in scenarios where asynchronous programming is crucial. It provides an event-driven model, allowing you to write scalable and responsive applications. Tornado is widely adopted in areas such as real-time analytics, social media platforms, and websockets-based communication.

Tornado’s community is active and supportive, providing resources and guidance for developers. While it excels in high-performance scenarios, Tornado may not be the best fit for every web application. Its asynchronous nature adds complexity to development, and it may not provide the same level of convenience and ease of use as more traditional frameworks.

TL;DR

It’s been quite the journey through the top 5 Python web frameworks. On the off (or probable) chance you merely skimmed through to get to this point, we’ll sum it up for you: Flask offers lightweight flexibility, Django has a batteries-included approach, Pyramid is known for its scalability, Bottle offers significant minimalist power, and Tornado has asynchronous prowess.

Python web frameworks have revolutionized web development, empowering developers to create robust and feature-rich applications with ease. They provide a solid foundation, allowing you to focus on building your application’s logic rather than reinventing the wheel.

Now that you’re equipped with the knowledge of the top Python web frameworks, it’s time to dive in, unleash your creativity, and build amazing web applications. And a quick pro tip: don’t stop at choosing the best framework for you. Go further and find the best debuggers (we recommend checking out Rookout), loggers, etc. You know, every tool that can make your – and your team’s – life easier and simpler when writing awesome features.

Happy coding!

Rookout Sandbox

No registration needed

Play Now

Table of Contents
Get the latest news

A New Dawn of Proactive Problem Solving: Dynamic Software Observability and Dynamic Logging

Liran Haimovitch | Co-Founder & CTO

Table of Contents

Let’s talk about the world’s currently trending topic for a second: AI. Now, before you click out of this blog, sighing to yourself that this is yet another blog that wants to tell you how to write code with ChatGPT; bear with us. As almost everyone has used some form of AI – especially ChatGpt – to help them with some form of a task, we can all agree that it’s quite an interactive experience. You ask it to do something for you, it does it, and then you respond with what else you’d like from it – an edit, a tweak, a completely new answer, whatever it is. Essentially, you are using a dynamic tool that interacts and evolves. Wouldn’t it be great if your Observability tools knew how to do that?

In the fast-paced realm of software development, the ability to swiftly identify and resolve issues is vital. Dynamic Observability is a transformative force in this arena, emphasizing a proactive approach that empowers developers with real-time insights.

Traditional observability is akin to a rearview mirror, offering a view of the past that is fixed and unchangeable. It provides insights into the system’s state at a specific moment but lacks the ability to adapt to changing circumstances. This static nature is restrictive in the dynamic world of software development, limiting a developer’s ability to troubleshoot and resolve issues quickly. In contrast, agile Observability, characterized by tools like dynamic logging and live snapshots, is more of a “remote controlled” live video feed, furnishing up-to-the-minute insights into your application’s state and performance.

Embracing real-time observability tools is a step towards a future where software teams are not just reactive problem-solvers but proactive custodians of their software systems. Building upon our previous discussion on the fourth pillar of observability and Snapshots, this blog delves deeper into the impact of real-time observability on software development through a series of use cases.

So grab a coffee, take a sip, let those synapses start firing, and join us as we dive into a few examples of how you can make your software development – and software observability – as reactive and up-to-date as an AI tool itself. 

Use Case #1 – Non-Breaking Breakpoints: The Next Step in Debugging Evolution

Let’s begin by exploring the integration of non-breaking breakpoints and snapshots within the realm of software observability. Non-breaking breakpoints are a developer’s secret weapon, allowing them to probe into the behavior of their code in real-time without disrupting its execution. 

Non-breaking breakpoints represent the future of debugging, ushering in an era of real-time observability and dynamic insights. The revolutionary aspect of these breakpoints lies in their non-intrusive nature. Developers can inspect the application state at any point in execution without disrupting its flow. This immediate, in-context insight equips them with the information they need to proactively identify and solve potential issues.

But how can these be leveraged within an observability software framework?

Snapshots elevate this concept to a new level. They are like high-definition photographs of your software’s state at any given moment. Still, unlike traditional static logs, they are dynamic and able to adapt to the ever-evolving nature of your codebase. Using an advanced observability platform (such as Rookout, for instance) allows you to create non-breaking breakpoints that instantly generate these dynamic snapshots, helping to swiftly isolate and troubleshoot anomalies. 

Furthermore, they both cater to the unique challenges faced by modern developers, who must manage increasingly complex and distributed systems. By providing real-time visibility into these systems, non-breaking breakpoints facilitate proactive problem-solving. Developers can take informed actions based on real-time data, reducing the time and effort required to debug and optimize applications.

Use Case #2 – Live Logging and Dynamic Log Verbosity

Logs have been the backbone of software debugging for years. However, traditional logs often fall short of providing the flexibility needed for real-time observability. Their static nature has been a hurdle when dealing with complex, distributed software systems. Enter dynamic logging. This approach not only aids in proactive problem-solving but also reduces the noise in your logs, keeping them focused and actionable.

Dynamic logging is more than just a tool; it’s a paradigm shift in the way developers interact with their systems. Traditional logging mechanisms are often inadequate to handle the complexities of modern, distributed applications. They tend to generate a high volume of data, which can obscure the most relevant insights. To put it simply, finding logs is challenging, depending on their structure and content. When it comes to structure, it’s difficult to create the same for every log line. Regarding content, even if the log exists and the develoepr can find it, it doesn’t mean that it contains the information the developer needs. 

The introduction of live logging, a core component of observability in software, facilitates dynamic log verbosity, allowing you to adjust the level of detail in your logs on-the-fly. Imagine you have an elusive bug that only manifests intermittently. With traditional logging, you might miss it entirely, or you’d need to restart your application with a higher log level, hoping to catch the anomaly. However, the power of live logging allows you to increase the log level at the first sign of trouble, providing you with the crucial insights you need without any interruption to your application. The essence of dynamic logging lies in its ability to adapt and is an invaluable tool for developers in their quest to maintain high-performing, reliable systems. 

Use Case #3 – Live Metrics:

Traditional metrics can feel rigid and inadequate in dealing with the volatile nature of modern software systems. While metrics offer another valuable dimension to software observability, providing quantitative data about the program’s operational characteristics, they often fall short when it’s important. 

By offering real-time performance insights, live metrics allow developers to be proactive in their problem-solving approach. Developers can identify potential issues based on current performance data and take preemptive action to mitigate these issues before they impact the system’s performance or the end-user experience.

This is the point where you say, “great, sounds good – but how does it work?”. Well, we’re glad you asked. Here’s a quick look deeper into live metrics:

  1. Effortless metrics collection

It’s very simple. Once you set a non-breaking breakpoint and trigger your code lines, you’ll be able to see its custom metrics per code line, in a real-time graph. 

  1. Real-time application performance monitoring

By using a live graph that tracks your code activity, you’ll be able to understand your relevant metrics in real-time. 

  1. Free customizable metrics data 

Data collection is orchestrated instead of being processed, which gives users the benefit of not being charge extra if they collect more data. 

  1. Visualization on the fly

Observability data is kept simple by being tied directly to the code, ensuring that developers are familiar with the data through tight integrations with the deployment processes and Git providers.

  1. Side-by-side analysis

Live metrics allows you to see the data alongside the code, taking away the tab-switching, guesswork, and Git history diffing from the process of analyzing metrics.

The dynamism and adaptability of live metrics make them an essential part of an effective observability strategy, empowering developers to move beyond pre-set thresholds and static dashboards. With tools (like Rookout, for instance) developers can create custom live metrics tailored to their specific needs. They can define what data to collect, how often to collect it, and how to visualize it, ensuring they always have the most relevant and actionable insights at their fingertips.

Furthermore, live metrics are designed with the unique needs of developers in mind, giving them the power to customize what metrics they track, how they track them, and how they analyze the resulting data. This helps developers identify and address performance bottlenecks promptly, enhancing user experience and overall application efficiency.

Use Case #4 – Live Profiling

In the world of software development, a profiler is a tool that measures the performance characteristics of your software, helping you identify bottlenecks and optimization opportunities. Traditional profilers are beneficial but often require stopping or slowing down your application – a significant inconvenience in a production environment.

Live profiling is a powerful tool in the arsenal of a modern developer. Unlike traditional heavy-duty profiling that comes at a significant performance cost, live profiling allows developers to assess their software’s performance in real-time. It’s the experience of coding in timers (within or across functions and services), but without any coding, and with built in graphs!

By providing real-time detailed insights into system performance, it empowers developers to optimize their applications proactively. They can identify performance bottlenecks and inefficiencies in real-time, enabling them to take immediate corrective action. Take our word for it. It’s a game-changer when it comes to dealing with production issues.

Proactive Problem Solving With Real-Time Observability

As we continue to navigate through the complexities of modern software development, tools that offer real-time insights and adaptability will become increasingly crucial (for instance, the ones mentioned above). Observability software like Rookout empowers development teams to leverage these capabilities, offering a new level of agility and adaptability that keeps up with the ever-evolving digital landscape we live in.

Interested in exploring more about software observability and dynamic logging? Continue delving into our Rookout blog to uncover how our advanced observability tools can revolutionize your software development and debugging processes (and don’t forget to check out the second episode of our microwebinar series with SD Times on the same topic here). Let’s conquer the world of software development, one line of code at a time.

Rookout Sandbox

No registration needed

Play Now

Table of Contents
Get the latest news

Diablo 4: A SaaS Masterclass in Launch Strategy

Liran Haimovitch | Co-Founder & CTO

Table of Contents

If you’ve ever been enraptured by the magical world of gaming, you’ve likely encountered Blizzard Entertainment. Known for its high-octane, immersive games, Blizzard has long been a beacon of quality in the gaming universe. Their latest offering, Diablo 4, has taken the gaming community by storm, breaking records and setting new standards for commercially and technically successful game launches. 

What’s truly exciting, though, is not just the thrilling gameplay Diablo 4 offers, but the remarkable strategy behind its launch. 

In the world of Software as a Service (SaaS), there’s a sweet spot where commercial success and technical stability coexist. Achieving this balance is no small feat – it requires careful planning, a deep understanding of the audience, and the ability to flexibly adapt to unexpected circumstances. Blizzard’s launch of Diablo 4 demonstrated a masterful grasp of this delicate equilibrium, turning potential pitfalls into opportunities for growth and customer satisfaction.

The Persistent Issue of Server Load

Online games come with an array of challenges, but one stands tall above the rest: server load. The initial rush of users eager to dive into the game at launch has been the downfall of many a promising title. Blizzard, like all game developers, ran rigorous open and closed beta testing for Diablo 4. However, such tests rarely capture the full intensity of a live launch scenario, where server load spikes can be monumental and unforgiving.

Blizzard took a different approach to this challenge. Rather than attempting to simulate the pressures of launch, they instead designed their release strategy to mitigate the impact of these pressures in a real-world environment.

A Slow and Steady Release Strategy

What did this strategy look like? Well, instead of a traditional “all-at-once” launch, Blizzard decided on a gradual release of Diablo 4. This meant only a subset of users got access to the game in the initial stage. The subset was not just random users, but the ones who showed their faith in Blizzard by pre-ordering the Deluxe and Ultimate editions of the game. This strategy served multiple purposes.

Firstly, it provided a more controlled environment to monitor the server load, enabling Blizzard’s engineers to understand where they could optimise and how they could gradually scale their infrastructure. This live testing in a real-world environment with actual users proved to be more effective than any closed or open beta testing.

Sweetening the Deal: The Power of Pre-orders

Blizzard didn’t stop at clever server load management. They decided to bake extra value into their strategy. Those gamers who got early access were the dedicated fans who pre-ordered the Deluxe and Ultimate editions. This incentive served to push pre-orders, creating an additional revenue stream before the official launch.

This approach to pre-orders is a departure from standard industry practice. Usually, pre-orders might offer exclusive in-game content or merchandise, but rarely the promise of early access. Blizzard turned this concept on its head, delivering palpable value to their most committed fans and offering them a taste of the Diablo 4 universe before the rest of the world.

Four-Fold Benefits

This phased launch strategy proved beneficial on multiple fronts. The Diablo community felt appreciated as their loyalty was rewarded with early access. For the engineering team, this strategy was a blessing, allowing them to manage the server load effectively, avoiding the dreaded crashes and server overloads that can ruin a game launch.

On the commercial side, Blizzard’s approach was equally ingenious. The sales team was able to identify and cater to gamers willing to pay a premium for early access, thus maximizing revenue potential. Additionally, the marketing team scored big with the sustained excitement around the launch. The anticipation built up over the phased rollout ensured that buzz around the game remained high for an extended period, bringing in more potential buyers.

The Blizzard Playbook

In essence, Blizzard’s launch strategy for Diablo 4 was a SaaS masterclass. It showcased the power of combining technical prowess with smart business strategy, producing a game launch that was not just successful but also remarkably smooth. Through thoughtful planning, Blizzard was able to turn traditional challenges into advantages, forging a stronger bond with their community, and setting a precedent for future game launches.

And let me tell you – I wasn’t immune to the charm of this strategy. Seeing the care and thought put into not just the development but also the launch of Diablo 4, I couldn’t help but join in the early-access party. Blizzard didn’t just sell me a game; they sold me an experience. An experience that I, like thousands of other gamers around the globe, was more than willing to pay for.

Rookout Sandbox

No registration needed

Play Now

Table of Contents
Get the latest news

The All-Star Lineup of JavaScript Testing Frameworks

Liran Haimovitch | Co-Founder & CTO

Table of Contents

Unless you live under an actual rock and haven’t hauled yourself into modern times, I’m sure you know – and most likely use – JavaScript. You know, the versatile and dynamic programming language that powers the web and beyond. From client-side scripting to server-side computing, and even robotics, JavaScript is everywhere. 

However, like any good craftsperson, a JavaScript developer knows that their work is only done once it’s been tested. That’s where testing frameworks come into play. These tools make it easier to ensure your code is behaving exactly as you’d expect, taking the guesswork out of releasing new versions. 

So let’s get to the point of why you’re here, reading this blog, and dive into the top 6 JavaScript testing frameworks that are making waves in the development world.

#1 – Mocha: The Full-bodied Framework 

Mocha came into existence in 2011 and has matured beautifully, much like a fine wine. Its syntax is simple and straightforward, offering developers an easy-to-use platform for asynchronous testing. Mocha’s flexibility is one of its key strengths. It doesn’t assert any specific style of tests, letting you pair it with assertion libraries like Chai and Sinon. 

Mocha is popular among developers for its detailed error reports, making debugging a breeze. It’s widely adopted, with a large, active community that contributes to its continuous development. IDE support is extensive, and the development speed is rapid, thanks to asynchronous capabilities. Notable projects like Brave Browser and Web3.js have taken advantage of Mocha’s robustness. However, its flexibility can also be a weakness, as it may require additional libraries for assertions and spies (a way of recording function arguments).

#2 – Jest: The Jester of JavaScript Testing

Jest, introduced by Facebook in 2016, is another heavyweight in the testing realm. It’s matured quickly and is now favored for its simplicity and zero-configuration setup. Its syntax is intuitive and user-friendly, which, combined with rich, detailed documentation, makes Jest incredibly easy to use. 

Jest’s main strength is its comprehensive nature. Unlike Mocha, it includes a complete set of testing utilities (such as DOM snapshots and testing), eliminating the need for additional libraries. Parallel test execution is built-in to speed up the development process. The community is vibrant, and IDE support is strong, with projects like React and Airbnb using Jest. However, its large API can be a double-edged sword, potentially overwhelming new users.

#3- Jasmine: BDD for JavaScript

Jasmine has been around since 2010, giving it a long history and a high level of maturity. Its syntax is clear and readable, making it simple to use for both new and experienced developers. 

Jasmine is a behavior-driven development (BDD) framework with features like spies and async support. It’s been adopted by projects like AngularJS and is popular among developers who prefer a comprehensive, out-of-the-box solution. The community is stable and supportive, and the development speed is impressive. However, the lack of an assertion library and manual mocking can be a downside for some.

# 4- QUnit: The Quantum Leap in Testing

QUnit, the oldest in our lineup, was developed by the jQuery team in 2008. Despite its age, it’s maintained a reputation for stability and reliability. Its syntax is straightforward but may seem a bit archaic compared to newer frameworks.

QUnit shines in its simplicity, offering basic functionalities without the frills. It’s ideal for testing jQuery projects and has a dedicated, albeit smaller, community. IDE support is decent, and the development speed is satisfactory. However, there might be better choices for complex applications due to its lack of advanced features.

# 5- Cypress: The Evergreen Testing Framework

Cypress, a newcomer in comparison, was launched in 2014. It’s gaining traction quickly due to its unique end-to-end testing approach. Cypress’s syntax is simple, and it excels in its ease of use. It enables developers to write tests in a real browser environment, making it a great tool for testing complex frontend applications.

Cypress stands out with its automatic waiting feature, which means you don’t have to manually add waits or sleeps to your tests. Its real-time reloading feature boosts development speed, making it a hit among developers. The community is rapidly growing, and IDE support is solid. Despite its relative youth, it’s been adopted by organizations like NASA and DHL. However, it only supports Chrome-based browsers, which may be a hindrance for some.

# 6- Puppeteer: The Master of Web Manipulation

Puppeteer, released by Google in 2017, is a high-level API over Chrome DevTools Protocol. Its syntax is modern and fairly easy to grasp, particularly for those familiar with async/await.

Puppeteer’s primary strength lies in its ability to perform actions that emulate real user interactions, making it excellent for end-to-end testing. With its headless browsing capabilities, it can automate virtually anything in a browser. The community is robust, and Puppeteer enjoys direct support from Google, bolstering its development speed. It’s been adopted by notable projects like Angular and GoogleChromeLabs’ tooling report. However, similar to Cypress, its browser support is limited.

Wrapping Up The Code

JavaScript testing frameworks are the unsung heroes of the development process. They help to catch bugs, reduce errors, and ultimately deliver a better product. Whether you’re drawn to the full-bodied flexibility of Mocha, the jester-like comprehensive nature of Jest, the allure of Jasmine’s BDD style, the quantum simplicity of QUnit, the evergreen automatic waiting feature of Cypress, or the masterful browser manipulation of Puppeteer, there’s a framework for everyone. 

Keep in mind that chooing the right frameworks depends as much on project needs as on personal preferences. When faced with this kind of technical choices, it’s important to note they can be very difficult to reverse down the line. It’s a great idea to try out a few options, even going as far as writing a couple of tests with each framework, to get some hands on experience.
Happy coding, and may your tests always pass! You can learn more about how Rookout intergrates with testing frameworks right here.

Rookout Sandbox

No registration needed

Play Now

Table of Contents
Get the latest news

The Fourth Pillar of Observability: Your Developers’ Must-Have Observability Tool

Liran Haimovitch | Co-Founder & CTO

Table of Contents

A paradigm shift is overdue in the realm of software observability. While Site Reliability Engineers (SREs) have been having fun with metrics, traces, and logs, software developers have been left in the lurch, shackled to the conventional, low-fidelity tool of logs. Why should SREs have all the fun, right?

Welcome to the dawn of a new era. An era where developers, too, can enjoy superior observability engineering. That’s where the fourth pillar of observability comes in: Snapshots.

Logs: Low Fidelity vs. Snapshots: High Fidelity

Traditionally, logs have been the mainstay of debugging for developers. They provide insight into the system’s behavior and serve as the primary source of data during issue investigation. However, their information is often limited, sometimes irrelevant, and quite noisy. This ‘low-fidelity’ nature makes them less efficient in capturing the full picture of a system’s status, hindering quick problem resolution.

Snapshots, on the other hand, are the antithesis of logs in terms of fidelity. A snapshot is a high-fidelity, contextual image of your application’s state at any given moment. It can contain variable values, stack traces, and other metadata, making it a richer and more informative source of data. The high fidelity of snapshots provides an in-depth view of the code execution, facilitating more efficient debugging and reducing the time to resolution.

The Pain of Optimizing Logs

Let’s be honest. Working with logs is a nightmare, isn’t it? They require a great deal of optimization, necessitating constant tinkering with the code to ensure that the logs capture the right data. It’s a time-consuming process, fraught with challenges, and the end result may still not be optimal.

To make it even more difficult, logs are often not ‘developer-friendly’. Developers have to carefully choose what to log, balancing between log verbosity and performance impact. Too little logging and there might not be enough data to diagnose an issue. Too much logging and the system could be bogged down with the performance cost, not to mention the hassle of sifting through mountains of irrelevant log entries. This often leads to an iterative, try-and-fail process of determining the right amount of logging, significantly impeding the development cycle.

Additionally, developers often have to anticipate which data will be required for future debugging sessions, which is inherently problematic. As we have yet to encounter any developers who can see the future, this makes predicting future issues accurately a difficult, if not impossible, task. Thus, developers often find themselves in situations where the logs don’t contain the necessary information to diagnose an issue, thereby leading to more time lost in log augmentation.

Last but not least, making changes to logs, whether adding new ones, removing outdated ones, or updating existing ones, involves modifying the code, testing, and then deploying the updated service. Each of these steps consumes a significant amount of time and resources, slowing down the overall software development process.

From a financial perspective, these inefficiencies translate to real costs. The time and resources consumed in log optimization not only slow down the development cycle, leading to delayed releases, but also represent labor hours that could have been spent on feature development, enhancements, or innovation. Additionally, extensive logging results in high storage costs. As data generation accelerates, managing and storing these logs can be a severe financial burden. 

Snapshots: Contextual Data in Real-time

In contrast, snapshots offer a more seamless, efficient solution. They allow you to see data in the context of the code, eliminating the tedious back-and-forth involved in decoding logs. With snapshots, there’s no need to manually map log data to code, as they are designed to give you the relevant information right where you need it.

Snapshots provide a context-rich view of your application’s state in real-time, offering a more granular and detailed understanding of your code’s behavior. They make it easier to identify and address problems, significantly reducing the time spent on resolving issues. They are not just a stand-alone tool but a piece of a larger observability engineering puzzle, complementing and enhancing the effectiveness of the other three pillars – logs, metrics, and traces.

While logs are the fundamental basis for observability, providing raw data about system events, metrics offer a high-level overview of system health and performance, and traces give insight into request flows across services. However, even with these tools, developers often grapple with the question: “What exactly is happening inside my code at this moment?”

This is where Snapshots truly shine. Snapshots provide a contextual, real-time view of your code’s execution, bridging the gap between these high-level statistics and the granular detail of specific code execution. They complement metrics by providing detailed context for changes in system behavior. They supplement traces by offering a deep dive into specific function calls or service interactions. And they enhance logs by providing a rich, detailed picture of your code’s state at any point in time, eliminating guesswork and assumptions.

Snapshots: Reliability and Relevance

Logs, by nature, are based on a plethora of assumptions and can quickly become outdated. This results in a situation where you might base your analysis and decisions on inaccurate or obsolete information.

Snapshots, however, are highly reliable. They capture the exact state of your application at a specific point in time, ensuring the data’s relevance and accuracy. This allows developers to make informed decisions based on up-to-date, precise information, significantly reducing the chances of errors.

Snapshotting without Redeployments

One of the best things about snapshots is the ability to add them in real-time without requiring code changes or deployments. This is a game-changer for developers as it eliminates the cumbersome, time-consuming process associated with log optimization, enabling a more streamlined approach to observability. By combining snapshots with logs, metrics, and traces, developers can gain a comprehensive view of their software – from macro performance metrics to micro-level code execution details.

Let’s not stop at the three pillars of observability; let’s raise the bar and embrace snapshots and give developers the observability tools they deserve and need to make their jobs easier. Snapshots promise a future where high fidelity, real-time, and context-rich data are not luxuries but norms in software debugging. Get ready to say goodbye to the limitations of logs and welcome the powerful capabilities of snapshots in your developer toolkit.

So, here’s the takeaway: logging sucks. But with snapshots, we’re hoping to change that narrative. Let’s elevate our observability game. Together.

If you’re intrigued by this new way of approaching observability software, be sure to stay tuned. We’ll be diving deeper into the power of snapshots in our next blog post. And if you want to learn more about the fourth pillar of observability, watch Liran Haimovitch’s webinar on SDTimes on this exact topic. Enjoy!

Rookout Sandbox

No registration needed

Play Now

Table of Contents
Get the latest news

It’s time to look into the future of logging solutions: cut logging costs with snapshots

Irit Angel | VP Product

Table of Contents

Logging is ancient history. You know – old and outdated. At one time, it was the best method – like sending carrier pigeons to convey messages – but we live in an ever-changing world. 

Long gone are the days in which logging was the primary method when troubleshooting and debugging. Any developer who was written millions of log lines can attest to the fact that they’ve probably needed to access maybe 1% of those. And even more so, have had difficulty finding those same logs when they need to understand what’s going on.

It’s simply an antiquated method of working. It isn’t dynamic. It isn’t efficient, and even worse, it comes with a considerable cost.

A better solution didn’t exist – until today. Welcome to the blog that will change your {logging} world –  both time and spend – and how developers work in the development cycle.

Let’s talk about the old logging solutions 

Back in the day, the only way for a developer to understand what was happening in their code was to write copious amounts of log lines. These log lines – whether ERROR, WARNING, INFO, etc – gave them the information they needed regarding what was happening in their running code when an issue occurred. Without these logs, developers were essentially blind. They didn’t have the proper information to understand what was going on in their environment. This caused them to write more logs in the vain hope that the more logs they wrote, the deeper view they’d get. 

However, that process doesn’t take into consideration a few key challenges and difficulties:

  1. Developers rarely know what they will need – so they write everything. They only use some of their logs when an issue occurs, meaning they end up writing a lot of data that is rarely used. Yet, they need to write them because they don’t know if they will need it in the future. That is what we call Logging FOMO – the fear of missing out on logs and the information they’ll provide.
  1. They can’t always get what they want – we’re talking about finding the relevant logs. Often, developers find themselves hunting for that veritable needle in a haystack. Finding logs is challenging, depending on their structure and content. Structure-wise, creating the same one for every log line is difficult. Parsing them to look the same is a significant pain, and searching in unstructured data is even more so. Content-wise, even if the log exists and the developer is able to find it, it doesn’t always contain the information they need. 
  1. Astronomic costs. That’s the whole reason you’re reading this article, right? Because you know you’re paying through the roof for your log storage but have no idea how to reduce it. Let’s explore this a bit further.

Logging Costs

Let’s call a spade a spade. Logs are the most expensive telemetry in the observability world. The costs are hard to control, as every developer can add a log line that has the ability to send your logging bill through the roof. Organizations can pay millions of dollars annually for log storage/usage. And to what end?

That would be due to the need for immediate data. Log storage is divided into two parts – hot storage and cold storage. Hot storage is the more expensive option of the two, and cold storage is only a tenth of the cost. As a quick refresher, hot storage is fast, easy-to-access data storage. On the other hand, cold storage is archival data that’s rarely accessed and usually consists of security and compliance data. Due to developers’ need for immediate data when an issue arises, most of their logs go into hot storage to be easily accessible when needed. However, the costs that hot storage generates are considerable. 

Reducing these costs is difficult. Not only does all the data that is sent need to be analyzed, but hard decisions need to be made regarding which logs can be removed, pushback from the developers needs to be handled, and to top it all off, all of this decision-making and execution is time-consuming.

If you yourself are paying through the roof for those log storage costs, take a moment to consider. How many log lines do you write on an hourly basis? How many of those need to go into hot storage to be easily accessed? And how often do you actually need those logs? Insane, right?

Step into the future: the 4th pillar of Observability

The new method of troubleshooting and production debugging is a game-changer. Get rid of the old, inefficient methods that are tying organizations down, wasting time, and making them bleed dollar bills left and right. Instead, look into the future with the tool that will get developers everything they need throughout the development cycle in one click.

Let’s explain. What we’re talking about is a tool like Rookout that allows developers to access the data they need, in real-time, wherever, whenever. More specifically, we’re talking about Snapshots. 

Snapshots offer comprehensive information that encompasses all the necessary details. Variables are recorded in their entirety, preserving their type information and exact representation. Objects are captured by individual attributes, and collections are all appropriately enumerated, alongside the stack trace and other global variables that are easily accessible.

As you can see, Snapshots give developers so much more information than logs do. By capturing the most relevant application state, they give developers a detailed, clear, high-fidelity image of what’s happening. Truly, snapshots are worth a thousand log lines. 

Rookout and its Snapshots are there for developers throughout the whole development life cycle. It doesn’t matter if they’re developing in a remote environment, running tests through their CI pipeline, monitoring a deployment, or handling a production issue. With snapshots, they get the information they need, in the right place, at the right time. 

There’s no more need to store logs for the convenience of hopefully receiving the necessary data. Now, get the exact data needed immediately when it’s needed. Do yourself a favor and see how your bills shrink dramatically by keeping only your ERROR logs and doing away with the rest, while, of course, keeping the minimum needed for compliance and security in cold storage. Throughout the software development lifecycle – and especially when you need to resolve an issue immediately – you have Rookout to give you a hand. Logs shouldn’t be your old tried-and-somewhat-trusted fallback solution anymore. Now, whenever you need to get a glimpse ‘under the hood’ of your software, no matter the place or time – Rookout is there for you.

Let’s zoom in to see:

TL;DR

Don’t be stuck in the old ways. Step into the future and save yourself tons of money along the way.

It’s time to save development time and frustration. Let’s look to the future and the new wave of tools that allow real-time data, anytime, anywhere. 
Want to hear more? Check out Irit’s interview, where she goes more in-depth on this exact topic.

Rookout Sandbox

No registration needed

Play Now

Table of Contents
Get the latest news

Revolutionizing Cloud Logging: Say Goodbye to Limitations and High Costs

Sharon Sharlin

Table of Contents

Cloud logging services have long been plagued by limitations and high costs, hindering companies’ ability to achieve true flexibility in their operations. One of the primary obstacles is the lack of flexibility in traditional cloud logging services, which often require companies to make upfront decisions about log levels and storage capacity, locking them into fixed plans for extended periods. This leads to inefficient resource allocation, as companies either overpay for excessive log capacity they don’t fully utilize or face log shortages during critical moments.

However, these limitations go beyond the cost of logging. It impacts the developers themselves, with the sheer volume of logs generated in modern applications overwhelming developers, hampering their ability to troubleshoot and debug effectively. This, when coupled with a developer’s fear of missing out on logging data (or Logging FOMO, as we like to call it), can increase the time and effort required to identify and resolve issues, impacting developer productivity and slowing down the software development lifecycle. Navigating through vast amounts of logs becomes a daunting task, often resulting in critical information being overlooked.

However, a recent breakthrough has introduced a new tool to combat these long-standing challenges: the ability to dynamically access your logs, wherever, whenever. No more storage. No more FOMO. Let’s take a look.

The Need for Flexibility in Cloud Architecture

Companies operating in a cloud architecture – or planning to migrate to one – have a clear expectation: they are looking for the ability to consume technological services on demand, aligning with their actual usage patterns. This flexibility empowers organizations to efficiently scale their utilization of cloud resources during periods of high data loads and promptly reduce it when necessary. 

By leveraging this dynamic approach, businesses can effectively manage costs and gain a competitive edge. Unfortunately, it isn’t that simple or easy, and what you require isn’t always what you receive.

The Inflexibility of Traditional Cloud Logging Services

Unless you’ve been living under a rock, you’re sure to know – and have probably felt yourself – how most traditional cloud logging services fail to provide the desired level of flexibility and instead impose exorbitant prices on organizations.

One of the primary limitations is the rigid structure and predefined schemas imposed by these services. Traditional logging solutions typically require a predefined log format, limiting the types of data that can be logged and the level of customization that organizations can achieve. This inflexibility makes it challenging to capture and store diverse types of logs in a unified manner, such as application logs, system logs, and security logs.

If that isn’t enough, traditional cloud logging services are also limited in scalability. These services often have predefined storage capacities and processing capabilities, which can become a bottleneck as data volumes increase. Scaling these services to accommodate higher log ingestion rates or larger storage requirements typically involves complex configuration changes and may result in downtime or disruptions to the logging infrastructure. This lack of scalability hampers organizations’ ability to effectively handle sudden spikes in log data, such as during periods of increased user activity or when dealing with security incidents.

A Trade-off Between Access and Costs

Oftentimes, to mitigate performance issues and high expenses associated with maintaining and accessing logs at high levels, companies opt for printing only a subset of logs. By selectively choosing log levels that suit their requirements, businesses strike a delicate balance, enabling them to resolve bugs efficiently while keeping costs manageable.

Planning for Future Logging Needs

Immediate log-level expansion is a complex process that necessitates application redeployment. To avoid this challenge, many organizations opt to purchase larger log packages in advance. This proactive approach allows them to have the necessary information readily available, quickly resolve bugs, and restore normal service and product functionality. Yet, it comes with the obvious downside: an increased cost.

Yet, what if there were another option? One in which organizations were not bound by decisions made in advance regarding their production and other environments’ log levels. Fortunately, there is. Specifically, there is the option to use one of the innovative, flexible, and cost-effective solutions that have emerged in the market, enabling dynamic consumption of logs on demand. These solutions empower companies to reevaluate their log management strategies, ultimately reducing fixed costs.

These new solutions enable developers to instantly access the logs and information they need to expedite bug resolution in any runtime environment. Key features to consider when evaluating such solutions include the ability to easily adjust verbosity levels, even in a production environment, and receive logs at the Info, Debug, or Trace levels. These logs play a crucial role in resolving bugs promptly as they occur. Even more so, these solutions optimize log printing costs and enhance application performance, benefiting the organization as a whole.

Rookout, for example, does all of that. With the introduction of Snapshots, Rookout has given developers the ability to unlock peak efficiency and effectiveness. They are now provided with everything they need to know, as Snapshots capture the most relevant application state and give a clear, detailed, high-fidelity image of what’s happening. No longer do developers need to experience Logging FOMO or waste time sifting through logs. Instead, they can get the data they need to understand what’s happening in their application, exactly when they need it, wherever they need it.

Reduce Those Cloud Logging Costs

It’s time to stop complaining over logging costs and jump into the future of logging. We fully understand the importance of investing in tools that enhance developer productivity, and that’s why we advocate for solutions that offer maximum value for your money. Instead of wasting precious time scouring through logs or crafting new log lines, empower your developers with instantaneous insights into their live applications.

Rookout’s Dev-First platform equips R&D teams with the ability to effortlessly access logs and code-level data, enabling them to swiftly pinpoint root causes and resolve issues on the fly, all while minimizing costs throughout the entire software development lifecycle. Thanks to our innovative live Snapshots, you can capture a detailed, context-rich picture of any incident and gain invaluable code-level insights. 

Bid farewell to exorbitant log storage expenses, as the real-time snapshot of your application state is just a click away. Embrace the logging revolution and unlock a world of efficient, cost-effective development.
Sounds good? Talk to us. Let’s make it happen for you.

Rookout Sandbox

No registration needed

Play Now

Table of Contents
Get the latest news

Observability and Ownership: The Path To Faster Issue Resolution 

Maor Rudick

Table of Contents

As digital transformation and the consequent move towards cloud-native continues to accelerate, and customer demands increase, traditional approaches to debugging and troubleshooting are limited and insufficient. Developers must quickly understand the relationships between user sessions, topology, and end-to-end transactions during incidents. This is made all the more difficult when they encounter the complexity of cloud-native environments and makes working in their production environments much more difficult. 

And yet, it’s not just the team that’s impacted. It’s a domino effect. While it might start in the code with an issue or a bug, it could escalate and impact your customers and bottom line. Which, of course, can’t happen. 

That’s why most organizations have already implemented various methods of coping with these challenges, whether it’s the shift-left methodology, ownership, or onboarding of new tools for better visibility. But what happens when you combine all of those? This blog will explore exactly what you should do to ensure your R&D team can fix issues faster.

Common Observability Challenges of Cloud-Native Architectures

Observability in cloud-native architectures is complex due to the distributed nature of microservices and containerized environments. Identifying and isolating the root cause of issues that may arise in the system can be difficult, as numerous moving parts and dependencies are involved. Traditional monitoring solutions are often not enough to capture the full picture. Additional observability tools such as tracing, logging, and metrics must be leveraged for a holistic view of a system’s performance. If that wasn’t enough to deal with, it’s essential to ensure that these tools are designed for cloud-native environments and can keep up with the scale and complexity of the system.

Shift-left practices aim to catch issues early in the development cycle by shifting quality and testing activities left in the software development lifecycle. This allows developers to detect and address issues before they become problems in production environments, which is crucial in cloud-native architectures where fast iteration and continuous deployment are common. 

When developers have access to production environments, they can better understand how their code behaves in the actual environment and make informed decisions that optimize performance and reliability. They can get real-time feedback on code changes by building observability into the development process and proactively addressing potential issues. Observability and shift-left practices go hand-in-hand, as they both contribute to creating more resilient and reliable cloud-native architectures. But without ownership of production environments, they’ll still be limited in what they can do.

So What Does Ownership Look Like?

When developers have ownership, they are responsible for the health and well-being of the code they have written. This means they have a vested interest in the success of their code and take accountability for any issues that arise. But we can all be honest; not every company and management team is comfortable giving developers that level of access. 

But we’re here to tell you that while we understand your fear, it’s wrong. Giving your devs production access will only benefit you. You’ll find that you’ll have better quality code and faster issue resolution. 

Start by providing clear expectations and guidelines. Define what it means to have ownership, what responsibilities come with it, and what metrics are used to measure success. Provide training and support to help your team understand the production environment and the available tools. One common example of ownership is through on-call rotations, a model in which developers are responsible for monitoring and addressing any issues that pop up in production environments during a specific time period. 

The Observability Tools For Success

Unfortunately, ownership on its own isn’t enough. Observability is essential to detect and diagnose problems in modern cloud-native applications. However, the specific observability needs depend on the role. For instance, developers need it to understand the behavior of their code during development and testing, whereas SREs require it to maintain service-level agreements in production environments. And to do so, both of them need the proper tooling. Let’s take a look at classic examples.

Enter Dynatrace (for end-to-end visibility across cloud-native applications) and Rookout (for debugging and troubleshooting production-level code). 

The Dynatrace APM platform is a powerful tool that provides end-to-end visibility across cloud-native application stacks. The APM can detect and diagnose problems across complex microservices, containers, and serverless architectures. Dynatrace automatically maps out all the components of an application and visualizes the dependencies between them. This helps detect anomalies and diagnose problems quickly, minimizing user impact.

Rookout, on the other hand, enables developers to debug and troubleshoot code in production environments. Unlike the APM, Rookout focuses on providing developers with real-time visibility into their code with no code changes required. This is especially helpful when bugs must be fixed quickly, but access to the source code is unavailable, or the problem cannot be reproduced.

But these aren’t stand-alone tools. For maximum effect, Dynatrace and Rookout (or other similar tools) can be used together to provide full observability for both developers and SREs. With both tools, developers can identify and troubleshoot issues faster, as well as proactively identify performance issues and optimize code for better performance. SREs can use APM to identify issues with infrastructure and dependencies and Rookout to identify issues with code.

This is probably the part where you ask yourself, “Okay, these tools sound cool – but so what? Where is my complete view of what’s going on in my code?”. 

That’s where the fourth pillar of observability – snapshots – comes in. Snapshots allow developers to capture a complete view of an issue, including application code, infrastructure, dependencies, and runtime data. This provides a more holistic view of the issue and enables faster troubleshooting. For example, a developer using Dynatrace APM and Rookout might notice that a particular function is taking longer to execute than usual. With Rookout, they can inspect the code in real-time to identify the root cause of the issue. They can then capture a smart snapshot that includes the code, runtime data, and infrastructure data, and share it with the SRE team. The SRE team can use the smart snapshot to identify any infrastructure or dependency issues that might be causing the problem. The developer and SRE team can resolve the issue quickly and minimize user impact. Awesome, right?

Python ∙ Java ∙ Go ∙ .NET ∙ Ruby ∙ Node.js & MORE. Rookout covers it all.

Try Rookout for free!

The TL;DR of Observability and Ownership

As we’ve seen, traditional observability and troubleshooting approaches are no longer sufficient in today’s complex production environments. R&D teams need access to the methodologies and tools that provide end-to-end observability and allow them to identify and resolve issues quickly. Ownership of production environments will give you better-quality code and faster issue resolution. End-to-end visibility across cloud-native application stacks will help your team detect and diagnose problems. By capturing metrics, log lines, and debug snapshots from a running application, they can troubleshoot faster and get instant insight into their app. 

So that’s it. No need to complicate it – we all have enough complicated code as is. For faster issue resolution, give your team the gift of ownership, observability, and the proper tooling to get both.
Talk to us to learn more about how you can level up your observability and ownership! We’ve got you covered.

Rookout Sandbox

No registration needed

Play Now

Table of Contents
Get the latest news

Why there needs to be a 4th pillar of Observability

Liran Haimovitch | Co-Founder & CTO

Table of Contents

Logs are the core of the human-machine interface for software developers and operators. Historically, they are very much like caveman paintings. They were our first attempt to express and understand how our software was working.

For several decades, logs were an island of calm in a rapidly changing technological ecosystem. Logs remained the same even as software services became web-based and grew in scale. We added context to make them easier to search through, moved them to a structured format, and over the past decade or two, started to aggregate and index them for ease of use.

And yet, at some point, that wasn’t enough. Thus, the three pillars of Observability were born: Logs, Metrics, and Traces.

Why do we need Metrics?

One of the most common questions we ask ourselves while monitoring the web server is, “how many requests for that URL did we get over the last minute?” To answer this question using logs, we must collect logs from all servers, parse individual lines, filter the relevant URLs, and count the results.

Whether we build a dedicated pipeline for this metric or calculate it by querying a fully indexed logs database, it’s a long and arduous process for both man and machine and unlikely to give us results in real-time.

Think of metrics as a way to efficiently aggregate multiple log lines of the same instance at the source application. By counting (or using other forms of aggregations such as summing) each event, you can efficiently get a real-time value of the behavior of your application as a whole.

A much more efficient way to get high-quality data is to create a counter inside the application and export it to the Observability stack, which will aggregate it and produce the relevant reports.

So where does Distributed Tracing come in?

Modern web applications are running on a much grander scale than ever before. We shifted our engineering paradigms and have adopted new architectural patterns, such as microservices and reactive programming.

Unfortunately, this has fundamentally broken the unwritten promise of logs: that we can tell the story by connecting the dots one log line at a time. One can no longer assume that two consecutive log lines are part of the same request, or even use process and thread IDs to build the timeline.

Distributed Tracing is a way to generate the timeline of individual requests and other processing tasks. This way, we can easily keep track of each step within the flow, even as it crosses service and functional boundaries.

What’s still missing?

By adding Metrics and Distributed Tracing, the three pillars of Observability significantly improved the operational paradigm of modern cloud-native applications.

Metrics allow us to bind log lines vertically and see how the system behaves over many requests. Tracing allows us to bind log lines horizontally and know how the system behaves through the lifespan of a single request. Both tools are super valuable for understanding the system as a whole and excite SREs and architects across the globe.

And yet, for most software organizations, the software developer is the most common engineering role-those poor souls who spend most of their time writing and debugging code.

We shift responsibility left and want engineers to own their code across the whole software development lifecycle, all the way to production. They don’t care about the number of requests or how requests cross service boundaries. What they want to know is how the code behaves.

What does it take to understand the code?

The incredible power of modern code is that the sum is way more than the value of its parts. Each variable is an abstraction, combining code and data to provide superb power with only a few characters of text. The layers stack on top of each other.

The code in question might be your code, or it might be first, second, and third-party packages and services, many of which are open-source. The data comes from various configurations, databases, caches, user settings, user inputs, feature flags, and more. Add to that the current state of the application, which often brings its own set of caveats, especially for long-running processes.

Squeezing that invaluable context into a single log line is no picnic. When stringifying primitive values into a log line, you lose some of the finer points, such as type information. When stringifying complex objects, the challenge is even greater.

Will you take a lean approach and miss out on invaluable information? Or will you take a deeper capture and impact the application’s performance? Chances are, you won’t bother in the first place, and pray that whoever built the library provided a decent stringification flow that won’t do too bad on either front.

Even worse, the current line is only a tiny part of the application state. What about the stack trace, the request context, or other valuable information?

Smart-Snapshots

What’s better than logs? Snapshots.

Snapshots as the fourth pillar of Observability that meets that need. By capturing most of the relevant application state, you get a clear, detailed, high-fidelity image of what’s happening. To paraphrase: a Snapshot is worth a thousand log lines.

Snapshots provide everything you need to know. Variables are captured with full fidelity, maintaining type information and exact representation. Objects are captured by individual attributes, and collections are appropriately enumerated. The stack trace and other global variables are readily available.

As is often the case with software engineering, Snapshots are not a new concept. Operating systems such as Linux and Windows had snapshot tools (core dumps) for years, used to analyze kernel and application crashes. Error monitoring tools such as Sentry or Bugsnag utilize (limited) snapshotting capabilities focused on errors. For more recent examples, developer Observability platforms such as Rookout are heavily focused on Snapshots.

How do we use Snapshots?

To meet the needs of modern development, we need to put snapshots at easy reach for every developer.  We need to give them the ability to decide ahead of time which obscure edge cases to snapshot for ease of reproduction and fixing. We must allow them to snapshot unexpected events in real-time to understand and remediate them. Therefore, we should build monitoring tools that intelligently identify and snapshot interesting events for easy analysis. Lastly, we must build automation engines that correlate data from other sources and automatically collect snapshots.

Snapshots are the key to unlocking peak efficiency and effectiveness for engineering organizations in these turbulent times. Even more important is the potential impact on engineering culture. By empowering engineers to witness how their code runs in production, we promote a true shift-left culture and create day-to-day ownership of their code across the software development lifecycle.

After all, developers deserve a pillar too.

Rookout Sandbox

No registration needed

Play Now