Rookout is now a part of the Dynatrace family!

Table of Contents
Get the latest news

Announcing Smart Snapshots

Liran Haimovitch | Co-Founder & CTO

Table of Contents

If you were to wake me up at 3 am and ask me how Rookout differs from logs (or other pillars of Observability, for that matter), my answer would have focused on the agile nature of live debugging. I would have explained that Non-Breaking Breakpoints empower you to decide in real-time what data you need. 

Traditionally, you would use whatever logs (or metrics and spans) happen to be in the code and work backward from there. With Rookout, you get to choose what data you want with a click of a button and instantly get it. Whether investigating a production bug or exploring through the code, you can iterate at your leisure, asking questions and immediately getting answers.

However, as it turns out, that’s only the half of it.

Logging is not enough

With Rookout, you can instantly add new logs, metrics, and spans to every running application (they can also tweak log verbosity, but that’s a different story). While those are powerful tools and heavily employed by our users, we discovered they are nowhere near as popular as Live Debugging.

A bit shocked, we decided to dig deeper. Discussing this with our users, we relearned how challenging it is to write high-quality logs. It goes way beyond determining where to put them. 

Take, for example, this logline:

Function foobar called with value: 5

What was the input for foobar? It was `5`, right? Or was it `”5”`? In your language, is that the same as `’5’`? Would `5.0` also be the same? And that’s before we even discuss encoding, rounding, and other edge cases.

When trying to log non-primitive variables, things get even messier. More often than not, simply stringifying objects is rather useless. Shall you print specific attributes? Can you write all of them? What about non-primitive attributes? Do you want to recurse? How deep?

Don’t even get me started on collections.

Getting all the data you need

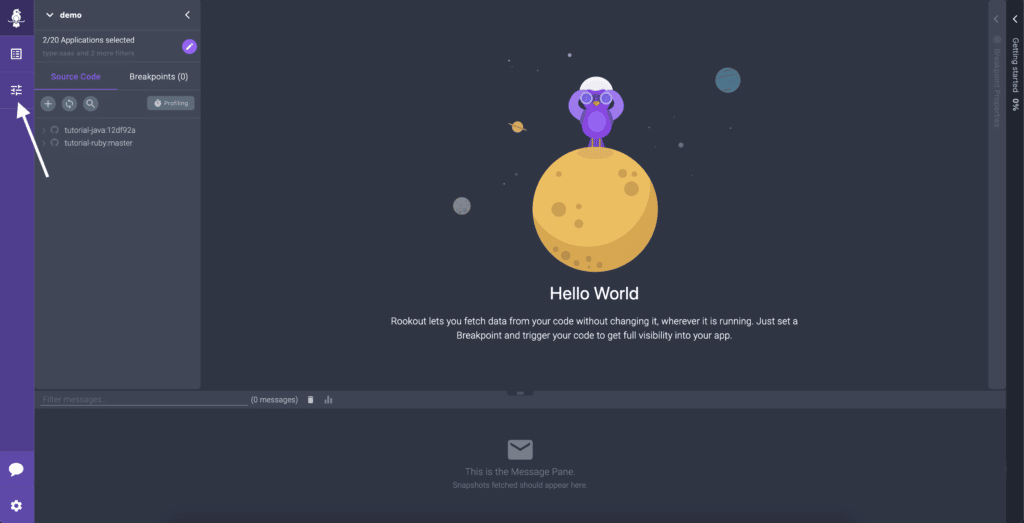
Those challenges are why Live Debugging is so appealing. Just click on a line and get Snapshots of everything – local variable values, stack traces, global context, the works. Don’t worry about what exactly to collect or how to encode it. Rookout will accurately capture the data and even collect type information to boot.

So if Snapshots are such a powerful tool, don’t they deserve their own spotlight? Well, they do, which is why it’s becoming increasingly clear that Snapshots are the missing fourth pillar of Observability. They are much better suited to meet the needs of the developers.

After all, a Snapshot is worth a thousand log lines.

What’s new?

It’s cool to announce that Snapshots are the fourth pillar of Observability, but what does it matter to the individual contributors out there?

First and foremost, like Logs, Snapshots can and should be integral to developing software. As you write code, you often think about how to deal with obscure and bizarre edge cases that you don’t know how and if they can happen. 

Traditionally, you would put a lackluster log line and hope you’ll deal with it when it happens. Fast forward, and you are often stuck with very little information to deal with the (un)expected issue.

Instead, take a snapshot of the application state at that point in time. For example, in Node.js, it would look something like this:

const rookout = require(“rookout”);

rookout.start();

// Something went wrong here

rookout.snapshot();

Do that, and the next time you’ll deal with an unexpected input, invalid calculation result, or corrupted internal data structure, the Snapshot will be available before you even know something went wrong. 

Even better, thanks to the dynamic nature of Rookout, you will be able to customize what data is being collected, set additional filters/conditions, or even disable the snapshot outright without having to change your code in any way.

Why Smart Snapshots?

Giving you the power to embed Snapshots in your code is only the beginning. We also want your applications to identify those edge cases and take those Snapshots proactively without you even thinking about it.

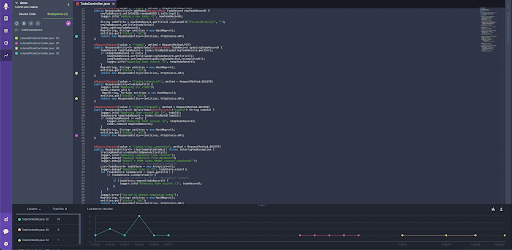
The first use case that we are releasing is assert tracking for tests. Stop wasting time and effort setting up and re-running tests locally. Even better, stop worrying about tests (or test failures) that are hard to reproduce locally. Rookout will automatically enrich those annoying ‘Assert failed 1 != 0’ messages with high-quality Snapshots that explain what went wrong to make troubleshooting a breeze.

We already have support for JUnit and Jest, and this is what it looks like:

What’s next?

Our team is bursting with ideas on when taking Snapshots automatically would be the most useful.

But even more important, we would love to hear from you! In which cases will Snapshots provide you with the most value? Talk to us.

Rookout Sandbox

No registration needed

Play Now

Table of Contents
Get the latest news

Best Practices For Leading A High-Performing Developer Team In 2023

Maor Rudick

Table of Contents

Every engineering leader wants to build a high-performance team that can set the standard for velocity, quality, and innovation. Yet, to do that, you need to focus on creating a culture of continuous improvement where everyone in the team is committed to learning and growing.

While we know this may seem easier said than done, we’ve put together some of the best practices that our very own engineering leaders have learned on the journey of creating a production-grade developer tool, especially throughout the rollercoaster this past quarter has been (crazy economy and marketwide layoffs, we’re looking at you…but yeah, not just you).  

So let’s get to it.

But First, Empathy

As an engineering leader, it’s essential to understand not only the technical side of things, but also the emotional side. Your employees aren’t pieces of code that should work exactly as you’ve asked (or written them) to.  Each one is unique, with a different set of needs, emotions, and perspectives. By understanding this – and them – you’ll be able to communicate more effectively and develop stronger relationships to foster a more positive and productive work environment. 

The need for this is even more apparent when it comes to on-call. Being on call shouldn’t be a dreaded experience. Let’s be honest: how often are the on-call people paged? How frequent is it? How much are they suffering? 

Being on-call isn’t just about being the dev equivalent of a firefighter. Instead, it should be viewed as a badge of honor that recognizes an individual’s maturity and skillset in making sound decisions under pressure. As a manager, it’s imperative to consider the price your team – and company – is paying for this. Because, like anything in life, there are consequences, whether that is burnout, work-life balance struggles, drain on motivation, and more. By listening and understanding your dev’s feelings and experiences with this, you can ensure that none of these happen, and you’ll continue to run a smooth sailing ship.  Rookout CTO, Liran Haimovitch, discusses this more in-depth in this talk

The Economy May Be Uncertain, But You Shouldn’t Be

The current economic climate is characterized by significant uncertainty. Whether it’s the fall of banks, untimely mass layoffs, or political upheaval – well, we feel like we’ve felt it all, and we’re only one quarter into 2023. 

Economic uncertainty can lead to a decreased demand for products and services, reduced budgets, and shifting priorities. All of these affect your team’s productivity, whether it’s their ability to deliver on time or within budget. Truly, nothing kills productivity more than a sense of uncertainty. Motivation goes down, productivity goes down, and everyone suffers for it.

So acknowledge the uncertainty and its potential impact on the team. Be the rock and use communication as your best weapon. Allow your developers to understand changes that are happening in priorities, deadlines, and more. Work with them to identify problem areas and see where you can streamline processes and prioritize work that is more closely aligned with the company’s current goals and needs. 

Python ∙ Java ∙ Go ∙ .NET ∙ Ruby ∙ Node.js & MORE. Rookout covers it all.

Try Rookout for free!

Lead By Example

As a leader, you set the tone for your team. Lead by example and model the behaviors you want to see in your team members. This includes taking responsibility for your mistakes, demonstrating a growth mindset, and showing a willingness to learn from your team members. This goes beyond a willingness to stay late to finish work when there are a lot of deadlines in play. 

For instance, AI taking over the world has been a hot topic lately. So maybe it’s time to chat it out with your engineers. Are they afraid AI will take over their work? Talk to them. Open a conversation about your vision for how AI can be used as a tool to optimize productivity. Assuage their fears – no one is losing their job to a computer (well, at least not in this round of the matrix). 

Or maybe it’s about creating a healthy work-life balance. Show them that it’s okay to take time off and prioritize mental health. Using vacation days and being away from your laptop won’t lead the company to a downfall. If anything, it’s more beneficial all around. The better they are, the better everyone is, and the better everyone will perform.

Create a healthy engineering culture

It’s essential also to emphasize the importance of creating a healthy engineering culture that fosters experimentation and risk-taking. By combining the right organizational culture with the right tools (observability, anyone?), you can create a team that’s truly unstoppable. The goal isn’t to create systems that never fail but rather to create systems that can fail without affecting customers while allowing for learning and testing.

This includes fostering a learning mindset. Encourage your team to experiment, take risks, make mistakes, and learn from failures. Make sure to create a safe environment where people are not afraid to make mistakes and can learn from them. Encourage your team to always look for ways to improve processes, systems, and products. Celebrate failures as opportunities for learning and growth, and use feedback to improve continuously.

Promote Ownership and Autonomy

Give your team members the freedom and autonomy to own their work and make decisions. This will not only help them feel empowered but also increase their accountability and commitment to the work they do. Let’s look at the facts: your developers are highly skilled professionals who bring high levels of expertise and creativity to their work. 

By promoting ownership, team members feel more invested in their work, take pride in their accomplishments, and feel more motivated to deliver high-quality results. Giving them more autonomy will allow them to use their skills and judgment to decide how to achieve their goals best and lead to more innovative solutions, increased productivity, and more. 

Additionally, giving team members ownership and autonomy can help attract and retain top talent as it demonstrates a commitment to supporting and valuing individual contributions. Who doesn’t want to work somewhere that values them, their work, and their time and investment? 

Set clear goals and metrics 

Ensure your team understands what they are working towards and how their work impacts the company’s goals by aligning efforts towards a common objective. When team members are clear on what they’re working towards, they can align their efforts towards a common objective. This helps avoid miscommunication or misunderstandings and ensures everyone works towards the same goal.

Setting metrics allows you to measure progress towards the goal – and let’s be real, this is quite important because how else do we prove we’re making an impact? This helps you identify what’s working and adjust your approach as needed. Metrics also allow you to track progress over time, so you can see how far you’ve come and celebrate milestones along the way.

Clear goals and metrics make it easier to make decisions. When you have data to back up your decisions, you can be more confident in your choices and more effectively communicate them to your team.

Go Forth And Lead

So there you have it, folks! With these insights from two industry experts, you’ll be well on your way to building a high-performance engineering team that’s second to none. Happy coding!

Rookout Sandbox

No registration needed

Play Now

Table of Contents
Get the latest news

A Software Development Manager’s Guide To Beginner Mistakes

Dudi Cohen | VP R&D

Table of Contents

R&D managers, when first stepping into the role, tend to make the mistake of choosing one of two extreme management approaches. Each of these comes with its own set of challenges – and its own set of organizational waste. And that’s the last thing you want to create as a manager.  

So if it’s your first time as a manager – or you simply feel like brushing up on your dev managerial skills – how can you keep delivering awesome tech for your company while keeping your team safe?

Understand Which Approach You’re Dealing With

When it comes to software development, dev managers, when first entering the role, tend to adopt two common types of ‘anti-patterns’, or as we’ve dubbed them, ‘bad management practices’. These are commonly used processes, structures, or patterns of action that often seem legitimate and easy to learn from but are usually counterproductive and ineffective (i.e. spaghetti code or God class). The more we know these, the better we can learn to handle them. These two patterns are:

1. The Guardian –  this manager does everything to protect their team from anything outside of the R&D

2. The Pleaser –  these managers focus on having their team deal solely with putting out fires for the rest of the company to keep everyone happy.

For obvious reasons, neither of these is ideal. 

The Guardian

This persona in this bad management practice is called the guardian. Their team is their top priority. They focus on preventing interruptions that waste their team’s time on any other issue than the internal work of their team, such as fixing bugs immediately or joining a meeting with a client that requires more technical knowledge. Typical examples of the way they speak often sound similar to: “We’re building features here”, “R&D is expensive”, or “let us do our job.”

This type creates external organizational waste as well as internal R&D waste. Not only do they create a situation in which other teams aren’t being supported – causing others to search for workarounds that often take more time and resources – but also create a situation in which they aren’t helping deal with the actual fires that pop up in the R&D team itself.

The Pleaser 

This is the other extreme, in which the manager prioritizes new requests to keep building relationships instead of his team. This kind of behavior includes actions like fixing bugs that are not urgent, supplying a quick response to every client, etc. This type of manager believes that his team can – and should – fix everyone’s problems. You’ll often hear them saying things such as: “Oh, that sounds urgent” or “I’ll deal with that immediately.” 

When we speak about relationships, we know that every type is different. However, here we are specifically speaking about internal work relationships. For example, how relationships between R&D members differ from relationships with colleagues surrounding R&D – account managers, support engineers, product, and even sales. These external forces obligate managers to consider their opinions and current needs. 

This managerial type will probably create internal organizational waste for his team. One of the effects of this waste is R&D burnout, which in turn will cause the R&D team to handle less of the load from other departments. Another effect of this managerial method would be the growth of technical debt. 

We can see that in the long run, the aim to please will actually harm those same departments. It can also create an unfulfilled roadmap that prevents product innovation and create a lot of internal waste.

Natural instincts 

At some point, tensions will arise between making the company happy, keeping your team safe, and doing that without littering everywhere. As a new manager, facing unexpected urgent challenges can cause a lot of pressure and sometimes can even make one feel attacked in a new relationship. This unknown situation brings us back to examine our basic instincts: fight, flight, and freeze.

The two first mechanisms help us adopt an immediate reaction without any further thinking. Imagine for a moment you’re in the middle of a jungle with a lion in front of you. This unexpected stressful situation forces you to react immediately to save your life. The first option is to immediately run away or fight the lion. It requires a quick, unconscious response. 

Similarly, going to these two extremes as a first-time manager helps us decide how to react and whether to fight the threat or run away. There is a third choice of freezing and doing nothing, but obviously, that’s not recommended in the slightest. 

Finding the middle ground

Managing is ever-changing and stressful, primarily for new engineering managers. Falling into the embrace of one of the two ‘bad management practices’ is easy – especially when they look like success. Yet, to not only solve – but get ahead of – these problems, we need to understand exactly what we’re working with. There’s no reason your organization should suffer just because you don’t have all the cards out to play. 

So what do we do? First, take a look at the reasons that a manager tends towards an extreme. Did they decide to become a manager to care mostly about their dev team? Is important for them to fix the organization’s problems? Then, understanding the root cause enables us to think of the messages we’d like to transfer to our team and colleagues and try to change this tendency. 

Being aware of these mistakes can help turn you (or finetune you, since obviously, you’re awesome) into a better manager and ensure your team – and company – are always performing at top velocity.

Rookout Sandbox

No registration needed

Play Now

Table of Contents
Get the latest news

Shift Left with Multibranch Pipeline Using Argo Workflows

Gosha Dozoretz | Sr. DevOps Engineer

Table of Contents

This blog is a follow-up to our earlier discussion of multibranch pipelines and how they can help streamline software development processes. There we explored the benefits of managing pipelines in the same repository as code and how that gives developers the ability to version their pipelines alongside their code, ensuring they remain in sync. 

Now, we’ll dive deeper into this concept by looking at how to implement a multi-branch pipeline using Argo Workflows. After running a short POC without a multibranch pipeline architecture, we understood just how crucial this is. By leveraging this powerful tool, developers can define and manage pipelines for different branches of the codebase, which gives them the ability to debug specific branches efficiently, further automating and standardizing the development process. 

So, let’s get started and see how Argo Workflows can help us shift left and streamline our development workflows.

Seeder Workflow

I want to be real with you for a second. While I previously discussed using Argo Events to dynamically template a Workflow CRD for a multibranch pipeline, I haven’t actually utilized it for this purpose yet. That’s because one of the main challenges with unmarshalling a JSON payload into a struct is that we need to have a predefined struct in place. To simplify this process, I created a Workflow called Seeder which generates a new Workflow CRD that can be submitted to the Argo Workflow server. 

This offers a great deal of flexibility for generating new CRDs and can greatly simplify the process of implementing a multibranch pipeline. With the Seeder Workflow, we can automate the process of creating new workflows, making it much easier to manage pipelines in the same repository as the code.

How To Implement

The process of injecting parameters, labels, and steps into the Workflow CRD begins with a webhook from the source code repository that sends a payload to ArgoEvent’s events bus. A Sensor then collects this payload and creates a Seeder Workflow, which is responsible for injecting the necessary parameters, labels, and steps into the Workflow CRD.

To implement the Seeder Workflow, we begin by extracting important information from the payload, including the repository name, user, and pull request address. This information is then utilized to create a new Workflow CRD based on a predefined template CRD. The template CRD contains important workflow configurations such as TTL, volumes, and tolerations, as well as an exit handler and entry point. By leveraging this template, we can ensure that all new Workflow CRDs generated by the Seeder Workflow adhere to the same standards and guidelines, thus improving consistency and streamlining the development process.

Here’s an example:


apiVersion: argoproj.io/v1alpha1
kind: Workflow
metadata:
 generateName: WILLBEOVERWEITTEN-
 labels:
   label: WILLBEOVERWEITTEN
spec:
 volumes:
 - name: shared-volume
   emptyDir: { }
 activeDeadlineSeconds: 28800
 archiveLogs: true
 arguments:
   parameters:
     - name: WILLBEOVERWEITTEN
 artifactRepositoryRef:
   configMap: artifact-repositories
 onExit: exit-handler
 entrypoint: entrypoint
 nodeSelector:
   node_pool: workflows
 serviceAccountName: argo-wf
 tolerations:
   - effect: NoSchedule
     key: node_pool
     operator: Equal
     value: workflows
 ttlStrategy:
   secondsAfterCompletion: 259200
 templates:
   - name: entrypoint
     steps:
       - - name: pipeline-init
           template: main
   - name: exit-handler
     dag:
       tasks:
         - name: github-status
           templateRef:
             name: common-toolkit
             template: github-notify
         - name: slack-notify
           templateRef:
             name: common-toolkit
             template: slack-channel-notify

Next, the Seeder Workflow downloads the .workflows folder from the source code repository branch. This folder contains several YAML files that define the structure and contents of the workflow. The most important of these files is the main.yaml file, which contains a lean YAML configuration of the main DAG and references WorkflowTemplate templates or “local” ones from the template.yaml file, which holds workflow scope templates implementation of templates.

Main.yaml example:

- name: git-clone
templateRef:
  name: git-toolkit
  template: git-clone
arguments:
  parameters:
    - name: branch
      value: "{{ workflow.parameters.branch }}" #Workflow scope parameters
    - name: repo_name
      value: "{{ workflow.parameters.repo_name }}"
 - name: hello-world
Template: local-template
arguments:
  parameters:
    - name: msg
      value: "I am referencing a workflow scope template"

Template.yaml example:

- name: local-template
 inputs:
   parameters:
     - name: msg
 script:
   image: alpine
   command: [ bash ]
   source: |
     echo "{{inputs.parameters.msg}}"

The Seeder Workflow then merges these templates with the created Workflow CRD, injecting the necessary steps and parameters into the workflow. Additionally, the Seeder Workflow can use the parameters.yaml file to add additional workflow scope parameters, allowing for more fine-grained control over the workflow’s execution.

Finally, the Seeder Workflow submits the resulting Workflow CRD, after linting, to the Argo Workflow server, creating a new workflow instance that adheres to the template we have defined. By using the Seeder Workflow to automate the process of creating new workflows, we can reduce errors caused by manual entry, ensure that all workflows adhere to a standardized structure, and streamline the development process for our team.

Debug Pause

Enabling developers to debug and pause their pipelines is crucial in modern software development practices, as it gives them more control over the process. Argo Workflows already has a feature called debug pause that sleeps before and after executing target scripts. Still, the feature is limited as it only checks if the environment variable exists, making it difficult to turn it on and off as a feature flag for specific steps.

To enable the debugging of specific steps, I contributed to the Argo Workflows open-source project by adding a simple check for the value of environment variables ARGO_DEBUG_PAUSE_AFTER and ARGO_DEBUG_PAUSE_BEFORE. These environment variables were added to each of the templates with a default value of ‘false’ and now they are waiting to be changed for debug execution.

To enable this feature for a step, I added a debug.yaml file to the ‘.workflows’ folder in the source code repository. This file declares which steps to debug and ensures that the debug functionality is limited to a specific branch only. The Seeder pipeline injects ‘true’ values into the two environment variables at the specified step as declared in the debug.yaml file. By doing so, developers can easily debug and troubleshoot issues before and after executing target scripts.

Example of this file:

steps:
 - git-clone

Summing Up 

Implementing a multibranch pipeline using Argo Workflows can help stream software development processes by automating and standardizing the development process. The Seeder Workflow, which generates a new Workflow CRD that can be submitted to the Argo Workflow server, simplifies the process of injecting parameters, labels, and steps into the Workflow CRD. By leveraging the template CRD, we can ensure that all new Workflow CRDs adhere to the same standards and guidelines, improving consistency and streamlining the development process. 

Additionally, enabling developers to debug and pause their pipelines is crucial in modern software development practices, giving them more control over the process. By utilizing Argo Workflows’ features, developers can create a more efficient and effective development process for their team.

Rookout Sandbox

No registration needed

Play Now

Table of Contents
Get the latest news

Make Mistakes, Recover Fast

Liran Haimovitch | Co-Founder & CTO

Table of Contents

Making mistakes is a part of life. It’s how we learn and grow. However, many people – and teams – struggle with the aftermath of making a mistake, and it can be challenging to recover quickly. As managers, we want to do everything in our power to avoid having our team make mistakes and theoretically get them straight to the aftermath of the mistake in which they have the full understanding and clarity of what to do, how to act, and have learned the best method to deal with the situation. 

While we can do everything we can to get them there, mistakes still happen. And some we even make ourselves. The least we can do to remedy that is to put in the proper workflows, give them the best tools, and offer all the support and guidance in the world. And yet. 

We understand that mistakes happen. Sometimes they happen because, well, we’re human. Sometimes it’s because we’re focusing our efforts elsewhere – moving fast, creating complex tech, etc. Whatever the reason, we need to let our teams – and ourselves – learn from these mistakes and focus on making sure that as little as possible is impacted by the mistake.

This may seem quite obvious, but if we actually think about it, much of what we do is powered by the fear of making a mistake. We all know that making a mistake when it comes to software development comes with much bigger repercussions than forgetting to turn on the dishwasher. We’re looking at downtime, impacted customer service, negative customer experience, wasted resources, and more. None of these are simple, and none should happen.

So let’s take a look at the top 5 ways we can ensure fast recovery from mistakes. 

#1 – Upgrade your tools and environments to support a production-first mindset

The mindset of putting production first allows you to identify issues early. It involves constantly monitoring the production environment for issues and proactively identifying potential problems. By identifying issues early, organizations can take action to resolve them before they become major incidents.

This mindset adoption also allows you to respond quickly and prioritize reliability. By having the right tools and processes – such as response plans, playbooks, and production-grade tools – in place, teams can quickly respond to incidents as they arise and resolve them. They can also prioritize reliability over other considerations, such as feature development. This ensures that their systems remain resilient and recover quickly from any incident.

#2 – Your SRE team is great, but they’re not enough

When the going gets tough, you also need developers who understand the production environments you’re working with and can fully own them – all the way from dev through staging and up through production. 

While this one may sound the scariest (we’ve heard quite a number of developers over the years tell us, “what do you mean debug in production? I don’t even have access! I’m not allowed to touch it”) – it’s the best move you could make. It’s paramount to effective software development that developers understand how their code is deployed and runs in their production environment. This includes understanding the infrastructure, dependencies, and other factors that can affect the performance and reliability of the application.

Connecting developers to production gives them the ability to quickly identify and troubleshoot issues that arise in the production environment. This can lead to faster resolution times and reduce the impact of incidents on customers.

#3 – Measuring success the right way

Oftentimes it’s not about the mistake itself that was made, but about how you recovered from it. Or better yet, was it a failure or a success? Was the incident response effective? How many deployments result in failure? How is your performance? How reliable is your service? Were your customers impacted? And to understand that, measurement is critical.

To get a better understanding of that, it’s crucial to measure key metrics such as MTTR, change failure rate, service level objectives, and customer satisfaction, to begin with. This will help drive continuous improvement of your system.

#4 – Account for human error

Let’s be honest. Despite our best efforts, humans are not infallible. This is exactly why you need to account for human error. You can do so in several ways.

Build a blameless culture that encourages team members to admit to mistakes and take ownership of them without fear of punishment or retribution. This promotes transparency and accountability and allows teams to learn from mistakes and improve their processes.

Provide training and support for your team members, including training on best practices, providing tools and resources to support the team, or even promoting work-life balance to reduce burnout. Additionally, automating repetitive tasks or processes can help reduce the likelihood of human error. Look for opportunities to automate tasks that are prone to error or that are time-consuming.

#5 – Second and third times aren’t the charm

Don’t repeat your mistakes. The most important way to recover quickly from mistakes is to learn from them. The two best ways to ensure that you don’t repeat is by focusing on continuous improvement and conducting post incident reviews. 

A culture of continuous improvement ensures that teams are constantly seeking to improve the performance and reliability of their systems. This includes conducting post-incident reviews to identify the root cause of issues and implementing process improvements to prevent similar incidents from happening in the future.

TL;DR

So stop losing sleep rehashing how you could have done things differently, caught the issue earlier, etc. Move forward and embrace those mistakes – and make sure your team does too. Just don’t forget to have a plan in place for how you deal with them.

And when it comes to bugs that pop up in production, we believe the easiest way to recover from them is using a tool that will instantly allow you to get debug data. And you know who to come to for that 😉

Rookout Sandbox

No registration needed

Play Now

Table of Contents
Get the latest news

5 Basic Steps To Implement The Technology Acceptance Model Of Usefulness In Your Development Organization

Dudi Cohen | VP R&D

Table of Contents

As engineering leaders, we all struggle to find the balance between creating cool technology and useable technology. Let’s be real. We all want to create cool things. It’s in our nature. But what’s the point of doing so when no one will use it? It’s crucial to remember that the ultimate goal of our work is to create something helpful and effective. Our work has to have a purpose. And ultimately – if we’re being completely honest – it simply isn’t the right business move to create something that nobody finds to be so.  

That’s where the concept of “usefulness” comes in. that was recently discussed with Sentry CTO, Ron Reiter, on the podcast, The Production-First Mindset. Ron spoke about the importance of usefulness in a production environment and how they implement it at Sentry. The more we spoke about it, the more I realized that this concept is one that truly resonates with our R&D team – and goals – here at Rookout.

What Is Usefulness?

As the name suggests, it’s creating a useful product. Taking it a step further and into developer terms, it refers to the idea that the goal of R&D organizations is to create something valuable and beneficial to the end users and customers. Additionally, it is one of the main dimensions contributing to a product’s usability. 

Fred Davis’s Technology Acceptance Model speaks about this concept. Specifically, it focuses on perceived ease of use and perceived usefulness, specifically the usefulness of technology. It states that “…defined perceived usefulness as the…probability that the technology used will improve the individual or team’s performance from an organizational perspective. The operators’ personal opinion of whether employing a given technology would improve performance reflects perceived usefulness”. 

However, ensuring you have a useful product isn’t enough if you’re not focused on keeping your production environment running smoothly and ensuring the quality and functionality of your product. 

Bringing It To Production

As a company that’s built a product focused around empowering developers to work in their production environments, specifically when it comes to accessing code-level data from running code, it’s no surprise that this is a focal point for achieving usefulness. It’s important for a multitude of reasons. 

For starters, implementing the concept of usefulness ensures that the final product is high quality. When you have visibility into production, you can ensure that your application or product is thoroughly tested, debugged, and optimized to meet the needs of your users. This reduces the risk of errors, crashes, and other issues that can negatively impact the user experience.

Another reason is that working in your production environments in real-time allows you to quickly identify and fix issues that arise in production. When you have a good understanding of how your application is behaving in the wild, you can quickly pinpoint and resolve problems that arise. 

Last but not least, and possibly the most important point, is that by being able to work in production, you can ensure that your product is useful and valuable to its users. With production-level capabilities, you can make sure that your application or product aligns with the needs and goals of your customers and that it is delivering real value to the people using it.

Measuring Usefulness In Your Organization

Now, you might think, “that sounds obvious.” While yes, it does, I promise some concrete advice here: mainly on ensuring that you apply this concept to your R&D team and tech map for the future. Let’s dive in:

  1. Set metrics and understand your success criteria. This means defining what usefulness means for your current goals. As every system is different, consider in advance what it means for your system to be useful. Do your research so that you can look ahead to the future, but also plan for what you expect.
  1. Ease of use is critical. As the Technology Acceptance Model showed us, perceived ease of use is a key indicator as to how useful a user will perceive the technology to be. The more difficult a product is to use, the less likely it is for it to be easily adopted – or considered as a necessary – and helpful – tool.
  1. Involve your customers or users in the development process. Gathering feedback early and often can help ensure that the final product aligns with their needs and goals. Additionally, regularly assessing the performance and usage of your application in production can provide valuable insights into areas for improvement.
  1. Maintain control in production. This means clearly defining roles and responsibilities, as well as providing the necessary tools and resources for your team to succeed (such as investing in the necessary debugging and observability solutions to allow your developers to quickly identify and fix issues in production without impacting performance). 
  1. Rinse, wash, repeat. Make sure that this isn’t a one-time effort but rather a continuous process. Users’ needs and preferences constantly change, and your product should be keeping up with those changes. By staying in tune with your customers and making regular adjustments, you can ensure that your product remains relevant and useful over time.

Give It A Go

By focusing on usefulness and implementing effective development management strategies, we can ensure that our work not only meets technical requirements but also delivers value to our users and customers. At Rookout, we believe that being able to work in production is essential to delivering a high-quality – and useful! – debugging product. We strive to empower dev teams to achieve this through our Developer-First Observability offerings.

Rookout Sandbox

No registration needed

Play Now

Table of Contents
Get the latest news

10 Dos and Don’ts When Debugging Cloud-Native Applications

Maor Rudick

Table of Contents

Lately, everyone has been jumping on the cloud transformation bandwagon, which isn’t surprising, because when it comes to tech, you don’t want to find yourself behind, stuck with your dusty old monoliths. Just kidding – we love ourselves some good old monolith architectures – but there’s no comparing to dynamic, cloud-native technology.

And while we could speak all day about the benefits of cloud-native and modern architectures like Kubernetes and AWS Lambda, we have to look the truth in the face. And that is this: as wonderful as they are, as much as they improve developer efficiency, speed up processes, and are dynamic – cloud-native applications raise complex challenges for the developers trying to debug them. And this is only made even more challenging when doing so in real time, in production environments.

But you’ve come to the right place! We put together a preliminary list of Dos and Don’ts to keep in mind as you debug your cloud-native applications. 

Take a look.

#1 – Which version of code are you looking at?

Don’t: Assume you have the right version of the code. Cloud-native applications frequently change and code versions can vary across different deployments.

Do: Find a tool to make sure you’re looking at the right version of the code. If your IDE is showing a local branch or the most recent commit, there’s a good chance you’re looking at a different logical flow than the one running in production.

#2 – Stepping through code

Don’t: Assume you know where the problem is and rush in to “step over” functions. We’ve all done it – and how often are we actually right?

Do: Eliminate problem categories step by step. Do this by taking a step back to try to get a bird’s eye view of the entire cluster or environment. Then, try to track the debug flow and “step into” the code as much as possible.

#3 – Placing blame

Don’t: Blame a specific container or server. They need to be treated equally.

Do: Look at your containers as a group, not a unique unit. Remind yourself that each microservice is expected to run on dozens or hundreds of containers, to behave similarly, and multiple microservices interact with each other, so you may need to trace an issue across multiple services. 

#4 – Reproducing Issues

Don’t: When an issue seems likely to originate in a large-scale and complex production environment, don’t try to reproduce it locally. Especially when network and data conditions can’t be replicated.

Do: Find efficient and safe ways to reproduce and isolate the issue where it normally occurs, meaning whichever environment the issue was reported in.

#5 – Logging FOMO

Don’t: Feeling FOMO over your logs will only add a hefty price tag to your overhead costs. For example, enabling DEBUG or TRACE logs across your entire application will increase your logging costs, impact your app performance, and generate a huge amount of unnecessary data you’ll have to search through.

Do: Implement logging best practices. Dynamically and granularly increase log verbosity and allow your developers to shine a light into the darkness of their code. Get just the data you need to troubleshoot, without overwhelming yourself or your app.

#6 – Real-Time Data

Don’t: Stay away from the awful cycle of adding a log line and then waiting for CI/CD to get you the data you’re missing. We’ve all done it. We all know you’ll be waiting quite a while.

Do: Get the debug data that you’re missing, in real-time, with the proper live debugging tools.

#7 – Work Together

Don’t: Hold everything to yourself – that includes debug flows and issues you’re facing or find. Someone else might have the answer (but yeah, try your rubber duck first).

Do: Collaborate and streamline new debug data across all teams, using your favorite tool. 

#8 – Distributed and dynamic

Don’t: Use SSH and connect to a specific server. When working in distributed environments, especially with microservices, there’s no one server you connect to. 

Do: Jump on the distributed bandwagon. Embrace distributed logging and tracing methods so you can collect data from distributed, dynamic microservices.

#9 – Changing code

Don’t: Interrupt the app you’re trying to troubleshoot by changing code, stopping your app, or restarting it. 

Do: Access code-level data from a live environment while it’s still running. Find the tools that enable you to do so without compromising your performance or running code. 

#10 – Debug cloud-native applications

Don’t: Debug alone or bang your head against your keyboard (seriously – it will only mess up your code).

Do: Consult your rubber duck, debug with a friend, or use a purple bird 😉

The TL;DR

When it comes to debugging cloud-native applications, and specifically doing so in real-time in production environments, we can face quite a few challenges. But that shouldn’t scare you off. Whether it’s making sure you’re using the proper tools, building the correct workflow, consulting the right people, or even implementing a few of our above recommendations, it will be a game-changer for your dev’s workflows. 

Good luck – and happy debugging 😉

Rookout Sandbox

No registration needed

Play Now

Table of Contents
Get the latest news

Enter the Metrics: Measure App Performance In Real-Time, On-Demand

Muli Harel

Table of Contents

When it comes to understanding what’s happening in your code – and your service health, specifically – business and code-level metrics are key. While most developers are experts in their own code, that doesn’t mean that they’re also experts on the app metrics, statistics, or distributed tracing from the code they’re working with. 

The code-level metrics they need are tough to set up and it’s something that no one else can do for them. Instead, developers must go through the motions, iteration after iteration, testing new metrics, and learning what works. And then go through all of that again. Not only is this extremely frustrating, but it’s expensive. We’re talking cloud costs, wasted developer time, and more.

Well, all of these costs, lost time, and unnecessary code aren’t just a glitch in the matrix that you seem to be caught in. They’re real. And they hurt. I think we can all agree that we’ve felt it.

So what can they do to get the answers they need and dive deep into their code to understand precisely what’s going on?

The simple answer is having a tool that will enable developers to get the metrics they need, on the fly, in real-time. This should be a basic capability when developing software. Even more so, you should be able to do this intuitively and quickly when dealing with application performance in your production environments.

That’s why we’re now introducing Rookout’s new Live Metrics capabilities.

Live Metrics For Your App Performance

With Live Metrics, app developers can now measure the response of their application in real-time, on-demand, from any point in the code, in any environment. They can track how many times a specific line of code is reached, without stopping execution or losing state. 

Developers are given comprehensive visibility into their application’s performance, including rate metrics. This allows them to troubleshoot across various platforms and environments, including cloud, serverless, and on-premise. 

Developers might also want to be able and connect the different metrics into the code lines and analyze them together to get the most valuable insights. Now they can do it with Live Metrics. 

We know this might sound too good to be true, but it’s not. Live Metrics isn’t just useful, it’s also performant, read-only, and safe. 

How Does It Work?

Let’s dive in: 

  1. Effortless metrics collection
    Traditionally, connecting code to business value requires spending many engineering cycles instrumenting code by hand to experiment and test various metrics. Rookout builds on our patented, ground-breaking Dynamic Observability technology to allow users to instrument any line of code, on the fly, with a click of a button.

It’s very simple. With our new Live-Metrics tool, all you need to do is use the Live Metrics mode and add the desired non-breaking breakpoints on any line of code. Once your code lines are triggered, you will see its custom metrics per code line, in a real-time graph. Each breakpoint will receive a unique color, and you will be able to easily define the specific code line to the specific metric, with a very simple view. 

  1. Real-time application performance monitoring

Live Metrics will give you the opportunity to understand your relevant metrics in real-time, by using a live graph that tracks your code activity and shows it on the fly. All you have to do is lean back and wait for your code to be triggered. 

Once it is, we will collect your custom metrics, and you will be able to watch it appear live.

  1. Free customizable metrics data 

At Rookout, the core of our business is orchestrating data collection rather than processing the data being collected. This gives us the benefit of not having to worry about that annoying conflict of interest where we charge extra from users who collect more data.

  1. Visualization on the fly

To help developers make the most of Observability data, we believe in keeping it simple and tying it directly to the code. This ensures that developers are familiar with the data through tight integrations with the deployment processes and Git providers.

Developers can set the desired custom metrics in their code, and visualize them on the fly with a live graph. You can also change the view and quickly jump from one view to another.

  1. Side-by-side analysis

With Live Metrics, you can see the data alongside the code, taking away the guesswork, tab-switching, and, worst of all, Git history diffing from the process of analyzing metrics.

Better Together

Live Metrics is but one part of the efficient troubleshooting and debugging puzzle. It works seamlessly with Rookout’s other tools, the Live Debugger and Live Logger, to provide a complete view of an application’s performance and behavior. 

Gone are the days of waiting for long deployment cycles and wasting resources. Together, these three tools form the perfect solution for any dev workflow, allowing developers to identify and resolve issues more quickly, effectively, and ultimately, at a much lower cost with much less pain. 

So if you’re tired of wasting resources and endless deployment cycles, give it a try. It’s free, so no excuses. Let us know what you think.

Rookout Sandbox

No registration needed

Play Now

Table of Contents
Get the latest news

90-Second Hack To Install A Node.JS Agent With No Code Changes

Uri Yemini | Software Developer

Table of Contents

Installing Rookout on your Node.JS application is usually a breeze. Run `npm install`, add a line of code, and you are done. Yet, in some rare cases, we encounter more frustrating use cases. For example:

  1. You have tons of different repositories, and you want to add Rookout to all of them.
  2. You have a very large or complex repository that you are not overly familiar with and want to add Rookout to it.
  3. In some environments, you prefer to only add the Rookout package to your deployment (or container image). 
  4. You have a repository where it’s easier to edit the runtime configuration than the source code, and you want to add Rookout to it.

When those tough situations arise, our customers often refer to this blog post we wrote years ago about deploying a Java Agent. So, if you are looking for an easy and portable way to deploy Node agents without changing your code, you’ll want to read this article.

Let’s Dive In

Our story begins with a little-known Node.JS CLI flag ‘–require’. As the name suggests, this is a way to require a module directly from the command line. More specifically, the module is preloaded before the main script is executed. One minor caveat is that require is limited to CommonJS modules, so await in global scope is not supported, and we can’t synchronously finish initialization (`–import` doesn’t have this limitation, but is only available from Node 19). 

To accommodate the `–require` flag, we added a start script that can easily be used with the require flag:

“””

node --require rookout/start

“””

Not So Fast

While modifying the command line doesn’t require any code changes, it’s not always a trivial task. Taking the container use-case, for example, the final command line may be defined in any of the below:

  1. The container image using the Dockefile CMD instruction (or an equivalent).
  2. The container orchestration configuration, such as the Kubernetes YAML file, Helm Chart, or Amazon ECS CloudFormation.
  3. The package.json file as a start or other script.
  4. In some bash file that is used to spin up the Node instance.

This very challenge is how the original Java hack blog post came into existence, and ironically enough, the exact same solution works here as well. The NODE_OPTIONS environment variable allows you to easily append any command line options to your Node applications. 

The benefit of that is that we can add any of the above configuration elements (Contaienr image, container orchestration, package.json, etc…) without worrying about where the command line is defined. For example, for a container this would look like:

“””
ENV NODE_OPTIONS="--require rookout/start"
“””

One Final Challenge

Our approach does still have one last caveat – we do rely on the Rookout package being available in the node_modules directory. This can easily be achieved by changing the `package.json` or Dockerfile, but not so easy to do without changing the build artifacts, which is not always desirable.

To bypass this limitation, we can use the NODE_PATH environment variable, which allows us to load modules from any directory. We can deploy the Node package through an initContainer or mounted volume, and then point to the relevant directory through the NODE_PATH environment variable, and we are done. That’s it.

Stop Waiting

If you always wondered if it’s possible to add a Node.JS agent such as Rookout to your application without editing your source code, now you know how. Whether you have one large repository or many small ones, you can easily get an agent up and running by following these short series of steps. 

And yet, in this case, the obvious approach is definitely the easiest one. Setting up Rookout as an NPM package takes no more than 90 seconds. Don’t take our word for it 😉 

Rookout Sandbox

No registration needed

Play Now

Table of Contents
Get the latest news

How To Use Mock Data Without Changing Internal Logic

Ryan Hoffman | Senior Software Engineer

Table of Contents

In every job and every company, that day always comes where you find that you…actually need to do some work. And by that, I mean finding new innovative solutions to tasks and projects instead of going with the tried-and-true methods. Recently, my team, of full stack developers were tasked with building a webview app to support our live debugging IDE plugin. This would allow us to align the user experience with our pre-existing web app. Using the IDE plugin’s UI framework meant we would need to rewrite a lot of the code, which would also result in a very different user experience due to the differences between frameworks and a lot of engineering time which means a lot of money.

Obviously, that’s not the ideal choice. So we decided to take a bit of a different approach. You know, one that would make our lives easier and help us create a better product, faster, and maintain the high-level of user experience our customers expect.

A New Approach

In order to be aligned with our web application we decided to shift from using our plugin’s UI system (Swing in Jetbrains case) and use a modern frontend framework (React) which is much better at rendering – and more importantly, re-rendering – a lot of UI elements. The decision also brought about many smiles in our team as it was easier for us to develop due to us having more experience developing with Javascript than Java Swing. Our goal and mindset was to develop quickly, efficiently, and with as little friction as possible and not be coupled to the plugin by having to rerun the plugin with every change to the UI code. 

With that goal in mind, well..we all know the saying of ‘people plan…’, right? As with every good new feature or product, we encountered problems which were unrelated to the webview but impacted development efficiency.

Speeding Up Code Development

In order to overcome these issues we chose to take an unconventional route of building mock data responses. These are predefined data sets that mimic the data we would have received from other services, while overriding native communication functions such as “fetch”. This solution dealt with many of the issues we wanted to tackle, such as keeping our code clean and allowing each part of the whole system to be developed separately. 


Keeping services decoupled from one another is a best practice in backend development when working with microservices.It allows complete autonomy of development and deployment per service, which means that as long as we are backwards compatible it is possible to continue to advance and deploy our UI without taking into account the missing correspondent changes from the plugin (other services). When using mock data, it’s common to succumb to the pull of changing your code so as to be aware that mock responses are being used. However, this dirties up the code and can cause future bugs.

For example, the code block below demonstrates specifically how the code is aware of the usage of mock responses. We indicated that if we are in a development environment it should return mock data.

if (env === "development"){
return  {...mockData} <-- local response
} else {
 return fetch(...)
}

In contrast to what we see in the code block above, what we would like to achieve is the ability to return mock data and not make our internal logic aware of the fact that it is getting mock data.

So What Do We Do?

Using mock responses has been a great tool for me as it has allowed me to continue developing my features or fixing bugs without being dependent on the development and prioritization of others. For example, what might be a major issue on my end could be a minor issue on their end and vice versa. Specifically at Rookout, we develop the IDE plugin at the same time as the Web UI, which acts as an individual service that is dependent on data received from the plugin. With the mock responses I don’t have to wait for development on the plugin to finish before I can start working on my own tasks.  

The top two options that I personally employ when I need to use mock responses are:

1. Creating a local web server that will take all requests and return the data as if it was the missing agent. While this solution works great, it requires some setup and for the developer to have a certain level of knowledge (basic as it may be) in backend development.

If the logic is kept untouched it will always point to whatever env.backendUrl stores, which by environment will point to your local machine or production machine.

// dev: localhost://...
// prod: https://...
const url = env.backendUrl
return fetch(url)

2. The second option – and my main focus for this article – is overriding the original behavior of the api we are looking to use (i.e fetch).

In modern frameworks we have a main.js/ts file which handles the initial load of our web application. This is the area where we can do our magic.

window.fetch = function (request) {
   return new Promise(resolve => {
     if(typeof request === "string") {
       return resolve({
         isGetMethod: true
       })
     } else {
       const response  = {
         isGetMethod: request.method === "GET",
       }
       if(request.method === "POST") {
           response["body"] = async () => {
             return {
               ...mockData
             }
           }
       }
       return resolve(response)
     }

   })
 }

const root = ReactDOM.createRoot(
 document.getElementById('root') as HTMLElement
);

root.render(
 <StrictMode>
   <App />
 </StrictMode>
);

In the code block before the app loads, we override the fetch api with our custom behavior. Any fetch done in our react app will get to our new implementation instead of the original fetch api.

An explanation of what the demo above does: 

  1. If the request’s method is “GET”, return {isGetMethod: true} 
  2. If the method is “POST” , return as an async function (implementation of res.body())  which returns the mock data we want to receive. 

In order to show the result let’s take a look at the simple component:

export const Comp = () => {

useEffect(() => {
 fetch({
   url: "https://jsonplaceholder.typicode.com/todos/1",
   method: 'GET'
 }).then(console.log) <-- example of response with get

 fetch({
   url: "https://jsonplaceholder.typicode.com/todos",
   method: 'POST',
   body: {
     "title": "demo"
   }
 }).then(console.log) <-- example of response with post

 fetch({
   url: "https://jsonplaceholder.typicode.com/todos",
   method: 'POST',
   body: {
     "title": "demo"
   }
 }).then(async (res) => {
   console.log(await res.body()) <-- example of parsing body response
 })

}, [])


return (<div>A Comp</div>)
}

The component sends requests to “production” endpoints, but the response is dealt with locally. Amazingly, no internal code change was made and reduced probability to produce new bugs while deploying to production.

WAIT A MOMENT!

A change in main.js/ts was made! How do we deal with it?

Popular Frontend frameworks as React/Angular (and NX as a mono-repo manager) supports using different “main” files when using different configurations for building and serving our application, and thus we can make two “main” files: 

1. main.js/ts

2. main-mock.js/ts 

"mock": {
         "extractLicenses": false,
         "optimization": false,
         "sourceMap": true,
         "vendorChunk": true,
         "main": "apps/demo/src/main-mock.tsx",
         "fileReplacements": [
           {
             "replace": "apps/demo/src/environments/environment.ts",
             "with": "apps/demo/src/environments/environment.mock.ts"
           },
  
         ]
       },

The default is our main.js/ts (kept untouched) and it is our main-mock for when we build with the mock configuration.

This will provide two big benefits: 

1. The original main file is kept untouched.

2. Code added for mock responses will not be bundled when building production configurations and as a result will not affect customer facing bundle size (will not impact performance).

Why is all this work worth it?

Simply put? It’s a game-changer for quick and efficient development.

When we want as a team to develop multiple features simultaneously, we need the ability to work as independently as possible from one another but to also be aware of the fact that in production all parts will be – and are – connected. Each of us affects the other, whether we see it or not.

 
Using mock data responses by overriding our communication functions (such as fetch) allows us to keep our code unaware of the fact that its being fed mock data and will allow us to develop new features quickly and safely while also giving us the opportunity to debug issues that might occur.


A happy bonus to this pattern is that usually, as a result of the separation of concerns in development, the code we write is much less error prone and can handle almost any data thrown at it. Therefore, it is also much easier to replicate edge cases and create unique handlers for such cases. And if a bug does somehow occur, well that’s what Rookout is for: production debugging, so that you can see what caused the bug and replicate it with mock responses.

The idea of parallel work is something we all wish to achieve as a team, but very hard to implement. By using mock data, we are now one step closer to achieving it. 

Give it a try. Happy coding 😉

Rookout Sandbox

No registration needed

Play Now

Table of Contents
Get the latest news

StackDriver Debugger Is Out – What’s Next For You?

Liran Haimovitch | Co-Founder & CTO

Table of Contents

If you have been a long-time user of the Google Cloud Platform, you’re likely familiar with the StackDriver suite of Observability and Operations tools. The most unique part of that suite was Google’s StackDriver Debugger, which was designed to debug live code in cloud and production environments with a click of a button.

Unfortunately, StackDriver has been renamed as Google’s Operations suite, and the Debugger has been deprecated. If you can’t live – or code – without the StackDriver Debugger or are simply looking to explore the concept, then Rookout might be exactly what you’re looking for.

Of course, Rookout and StackDriver are not identical, so there will be a few things that change as you make the move. Let’s dive in: 

Runtime Support

StackDriver has focused on languages, runtimes, and operating systems popular in Google Cloud, and especially in Google App Engine. Rookout, on other hand, takes things further, offering full Live Debugging capabilities across six runtime environments (JVM, .Net, Node, Python, Ruby, Go), for a wide variety of environment versions. Additionally, Rookout offers full support for all major Operating Systems, including Windows, OS X, and most Linux distributions, including Alpine.

Performance and Quality

Building a live debugging agent is a tough engineering task, and only the Java and Python libraries ever made it out of Beta. With Rookout, all of our agents are production-grade, working with fully-optimized code, offering lightning-fast snapshot capture and multiple layers of protection against performance impact, and have been heavily tested for memory leaks and other edge cases.

User Experience

Debugging a live cloud application is no small task, and more often than not, success depends on coming prepared. At Rookout, when working with our customers, we have learned that selecting the right instance(s) to debug and correctly identifying the source code revisions they are running is half the battle.

To facilitate that, Rookout supports advanced slice and dice controls to dig deep into your applications, select precisely the instances you need, and automatically fetch the source code for you.

What’s next?

If you have been using StackDriver Debugger, you have already gone through the nitty-gritty details of setting up a Live Debugger. Lucky for you, Rookout can be installed very similarly to StackDriver, and you can probably swap it in in a matter of minutes. Let’s get to it!

Python

Just like StackDriver, Rookout uses a Python package available on PyPi. Change your dependency from “google-python-cloud-debugger” to “rook” and initialize it:

import rook
rook.start(
    token="[Your Rookout Token]",
    labels={"env": "dev"}
)

Node

Just like StackDriver, Rookout uses a Node package available on npm. Change your dependency from “@google-cloud/debug-agent” to “rookout” and initialize it:

const rookout = require('rookout')
rookout.start({ 
    token: '[Your Rookout Token]',
    labels: {
        env: 'dev'
    }
}).then(/*Start your application here*/)

Ruby

Just like StackDriver, Rookout uses a Ruby package available on PyPi. Change your dependency from “stackdriver” to “rookout” and initialize it:

require "rookout"
::Rookout.start token: "[Your Rookout Token]", labels: {env: "dev"}

.Net

For .Net, Rookout uses a simple NuGet package. No worrying about custom Docker images 🙂

using Rook;
Rook.RookOptions options = new Rook.RookOptions()
{
    token = "[Your Rookout Token]",
    labels = new Dictionary<string, string> { { "env", "dev" } }
};
Rook.API.Start(options);

Java

For the JVM, Rookout uses a java agent instead of an agentlib (better compatibility!), so just set it up on your environment:

curl -L "https://repository.sonatype.org/service/local/artifact/maven/redirect?r=central-proxy&g=com.rookout&a=rook&v=LATEST" -o rook.jar
export JAVA_TOOL_OPTIONS="-javaagent:$(pwd)/rook.jar -DROOKOUT_TOKEN=[Your Rookout Token]"

So, what are you waiting for?

Google will be sunsetting the StackDriver Debugger by the middle of May 2023. The end of life for the open-source CLI-only version is the end of August 2023. 

It’s time to roll up your sleeves and start the migration process. Enough said.

If you have any questions, don’t hesitate to reach out. Happy debugging 😉

Rookout Sandbox

No registration needed

Play Now

Table of Contents
Get the latest news

FOMO Is Out, Live Logging Is In – Here’s How To Cut Costs When Logging In Your Frontend

Naomi Elstein | Product Manager

Table of Contents

We all know that debugging and troubleshooting cloud-native environments is no walk in the park. Sometimes we forget that debugging the frontend portion of those applications is no simpler and comes with its own set of challenges. We also all know how hard it is to get logging just right: managing verbosity, volume, and usefulness to just the right level. Well, in the realm of frontend, with potentially thousands or millions of users running your code, log aggregation can easily spin out of control.

Did you ever inadvertently add a log to production that ended up creating millions of log lines? Did you ever wish you could turn on a specific log line to help resolve your specific case? Learning from our users, we came to realize that those challenges are even harder to meet in the distributed world of frontend application development and operation.

In this day and age, companies are struggling to optimize their spend to make the most out of every dollar while achieving the greatest impact and velocity with their engineering teams. This means we can no longer afford capricious over-verbose logging and millions of dollars in log aggregation costs. We need more dynamic and granular control to ensure we’re getting the logs we need while optimizing the signal-to-noise ratio. 

We need Live Logging. We need it for the cloud. We need it for the frontend. 

Live Logging

After all, when going through Kibana we are only seeing a fraction of the logs we should have at our fingertips. Traditional, static filtering, usually limits us to INFO level logs at best, and ERROR level logs at worst. And so much of the data we actually need to understand what’s going on in instant resides that unattainable DEBUG level.

Live Logging is about changing all that. It’s about running those queries in real time on our running application(s), to get everything we need. Whether we are looking at a specific account, user, or source file, we get full verbosity logging.

Even better, this means we can give up on that dreaded logging FOMO, and reduce the verbosity of our most noisy, and yet, rarely useful log lines. This is definitely the season for saving on unnecessary spend.

What About Frontend Logging?

So far, at Rookout, we have been all about building the best developer-focused Observability tool for cloud-native applications. And yet, Live Logging goes way beyond the cloud. Starting today, you can easily add Live Logging to your frontend with just a few lines of code:

const rookout = require('rookout');
rookout.start({
	token: "your-token",
	console_live_logger: true
}).then(() => {
	// your app logic here
});

After adding the required code, you can start your app! In order to enable Live Logging, you should go to Rookout and click on the ‘Live Logging’ tab on the left side of the screen:

Once you are there and your app is connected to Rookout, you can enable Live Logging by pressing the ‘Start’ button:

When you’re all done, you can stop Live Logging by clicking on the ‘Stop’ button:

TL;DR

Eliminate the need for your developers to decide in advance how much log verbosity to run with, and make it available on demand, whenever they need it. By having all the data they need at their fingertips, both your frontend and backend engineers can make data-driven decisions and solve bugs faster. And the best part? No longer do they need to worry about not having added enough log lines and racking up logging costs.

And what if you want to continue investigating? You can pipeline your new debug data to any organization you need and analyze that data side by side.

Check out the full video on Live Logger’s support for frontend here – and, as always, reach out if you’d like to hear more!

Rookout Sandbox

No registration needed

Play Now