Rookout is now a part of the Dynatrace family!

Table of Contents
Get the latest news

A Developer’s Adventures Through Time And Space

Oded Keret | VP of Product

7 minutes

Table of Contents

The craziest thing happened to me during this holiday season! It may have been all of the magic in the air (or the extra partying), but one day, just before Christmas, I suddenly realized I can travel through time. Of course, the first attempt I made was to go back and prevent several historical events from happening. But alas, it turned out I could only travel through my own personal timeline. I’ve decided the best way to use my newly-discovered superpower is to go back and tell various past versions of myself that in 2020 – the future is bright! Without further ado, here’s what unfolded next.

Back to the past: junior-dev-me

The first thing I did was go back in time to meet junior-dev-me. When I arrived, I found him working on LoadRunner, an on-premise app deployed with thousands of enterprise customers worldwide. I interrupted him in the middle of a code review session, just as he was working on a new feature. The feature will be deployed with customers two months into his future, just as the new release is launched, or maybe three to six months after that when the users choose to download and install the latest release.

All in all, it’ll be a few months until he starts getting user feedback. It will also be a few months before he starts measuring adoption and hearing about what works and what doesn’t. Much of the code review session was pure guesswork. What’s going to happen? Where will we require log lines? What exceptions do we need to handle? What happens when we decide to measure new stuff?

Another cycle of adding log lines means releasing a hotfix, sending a patched up dll, or waiting for another release. The feedback loop means another 2-3 months of waiting for data. So the junior-dev-me is investing even more time in adding logs, to save himself from wanting to go back in time later on. He spends entire code review sessions worrying about what data future-him would have wanted to go back in time and add. “Time keeps on slippin’…” 

My heart went out to junior-dev-me. I introduced myself and told him that in the future, everything is going to be OK. In 2020, there’s a technology that lets you fetch data and add log lines on the fly, without changing code or waiting for a release. It works even if your app is on-premise, deployed half the world away in space, and two releases away in time. He looked impressed and then asked me who the president of the U.S. is in my time. I said never mind all that because if I had told him he wouldn’t believe me anyway. We had coffee together (some things never change over time, like how I like my coffee) and then, I went back to the future.

Pay it forward: senior-dev-me

My time-journey continued and I moved forward on the timeline to meet senior-dev-me. When I arrived, senior-dev-me was working on StormRunner, a SaaS, cloud-native app deployed in AWS EC2. I interrupted him in the middle of a design review session. He was designing a new architecture that would have to scale as an increasing number of customers required an increasing number of EC2 instances to be deployed on the fly.

Senior-dev-me was trying to figure out several things simultaneously. What scale would it have to reach? How many concurrent users can we expect to invoke this new API and what would the fail-rate be when we request such a batch deployment from AWS? If only he had some data about what customers are currently doing with the tool, and what responses we are getting from AWS.

Fetching more data means adding code, and adding code means waiting for a release. Sure, the release rate is quicker in SaaS. Instead of waiting 2-3 months, he may just need to wait 2-3 weeks. And if he needs the data urgently, he can always push a hotfix; yet even pushing a hotfix takes time, space, and effort. He has to plan it, write the code, test it, get in queue for a code review and a pull request, then gradually roll out. The cloud makes the app feel closer than on-premise apps, but it’s still far away. So senior-dev-me spends his time in design review sessions worrying if fetching more data that feels far away is even worth the effort. He makes an educated guess and hopes that future-him won’t be too disappointed when he makes the wrong one.

“So I turned myself to face me
But I’ve never caught a glimpse…
Time may change me
But I can’t trace time…
Turn and face the strange changes”

I told senior-dev-me that even though things seem confusing now, in 2020, a new platform will allow him to fetch data and add log lines on the fly, without changing code or waiting for a release. All this magic happens even if his app is a cloud-native SaaS deployed in a faraway AWS farm and a hotfix away in time. He smiled and asked me if the transition to Node.js and Angular 2.0 was worth the hassle. I said, “Don’t worry about it and don’t get too attached to that new IDE you just switched to.” We had a beer together (some things never change over time, like how I like my beer) and then I went back to the future.

Back to the not-so-distant past: product-owner-me

My next stop was a bit closer to my present whereabouts. This time around, I came to see the product-owner-me. When I got there, product-owner-me was working on a Kubernetes-based microservice app deployed in GCP. I interrupted him in the middle of a feature rollout session. The latest feature he designed had already been exposed to internal users on the ‘dogfood’ env, and to a couple of beta-friendly, early-adopting design partners. Many questions were now bothering him. What should the next step be? Do we expose it to everyone? Or do we do a gradual rollout, customer by customer? How will we know if they saw the new feature and if they liked what they saw? How quickly can we close the feedback loop and improve what needs to be improved?

He does have some data from the measurements he had built into the feature before starting the rollout. However, the feedback he’s already received means new s*$t has come to life, and maybe he needs to bake in another couple of log lines and report another couple of metrics. Does he hold the rollout until these metrics are added? Does he prioritize adding these metrics before, or after exposing this feature? Does he roll out the feature with fear and ignorance or with courage and data?

As the product owner, he always does his best at defining the data needed to measure prior to starting work on the new feature. As the product owner, he is also always hungry for more data. Yet each added metric makes the feature more expensive since it means writing more code. It involves a longer code review cycle, a longer design cycle, and a longer dev and test cycle. So he spends his feature rollout session trying to balance effort with data, space with time.

-Farewell, cruel world
Looks like I’ll die alone
-If only you’d purchased a better cell phone
-And now I’ll never know who wins Game of Thrones
Oh,
bad things are bad

I told product-owner-me that all of his hard work is going to be worth it. In the not-so-distant future, in 2020, Rookout lets you fetch data and add metrics on the fly, without changing code or waiting for a release. Even if your app is a Kubernetes-based microservices app, constantly changing and evolving. He smiled and asked who’s won the Game of Thrones. I told him not to get too attached to anyone on the show or to the show itself, for that matter. Also, don’t hold your breath for the final book to be finished any time soon. Then, we had a krembo together (some things never change over time, like how I am compelled to follow the rule of three) and I went back to the present.

There’s no time like the present

Just as I got back to the present, and right in time to unwrap my holiday presents, I ran into future-me. He went back in time to tell present-time-me to stop trying to distract myself from writing that new-year’s-themed blog post by imagining I could time travel. Well, I didn’t like his patronizing tone, so I told future-me to stop nagging. After all, I have my own process and my own pace. Stop telling me that things will be better in the future, I’ve got my own stuff to worry about. Ugh, I mean, who does that? People in the future have no manners. 😉

✨Happy Holidays and a Happy 2020 to you all! ❄️

Rookout Sandbox

No registration needed

Play Now

Table of Contents
Get the latest news

Move Fast And Break Things With Zero-Tolerance For Product Errors

Dudi Cohen | VP R&D

8 minutes

Table of Contents

Since Rookout was founded 2 years ago we’ve been running fast. Real fast. We have created a product that some of our customers believe is magic. This magic lives alongside our customers’ dev, staging, and production environments. Moreover, it must work perfectly every time. So, how can we keep that magic alive while still searching for even more magic?

In the startup world everybody likes moving fast, and at the beginning the velocity is unreal. There are many models of moving fast and breaking things in startups but essentially, they’re all the same. You start with an innovative product idea, develop, play with it – alone or with customers, throw it away (or just a part of it), learn from your mistakes, rinse and repeat. Running this fast at the beginning isn’t an option, but a necessity required to provide an MVP that will bring value to customers.

Without trial and error, without failure, you can’t generate innovation and you can’t shoot for the moon. But what happens after you have a product? What happens after you have customers who want everything? They want your product to be perfect and trustworthy, yet still want you to be the innovator that runs fast and repeatedly amazes them. They want you to be the cool, hip startup while having the level of reliability of a big corporate IT that delivers without failure.

The (near) impossible duality of playing both sides

So your customers want it all. They want to be excited again and again while also maintaining stability. But it isn’t only about what your customers want. If you settle for stability, you will slowly wither away and become irrelevant both for the market and for yourself. “Yourself” in this case, is your soul, your employees, your beliefs, and everything that motivated you when you were just starting to run forward fast.

There are many books and articles that deal with this sort of dilemma. One particular article that made a real impact on me was Big Macs vs. The Naked Chef by Joel Spolsky. It describes how succumbing to a methodology can turn a gourmet restaurant into a boring burger joint. So how can you both serve Big Macs and gourmet food at the same time? Well, it is possible: you just need to find your sweet spot and set your boundaries.

Thank God for the Kids’ Menu

Let’s go ahead and stretch Joel’s restaurant metaphor. You, your wife and your kids go out to dine in a gourmet restaurant. As you scan the menu, drooling over the complex yet appetizing descriptions, your wife signals that it’s time to take a break from the diet. But what about the kids? The little rascals are screaming and chanting, “burger!”, fries!” And they certainly won’t settle for the “red, white, and blueberry bacon burger with basil aioli”. They want a dry meat patty stuffed between two buns and nothing else.

Thank God for the “Kids’ Menu”, it is always there. So boring, uneventful, and guaranteed to make your kids happy. Some may ask, how about innovating the kids’ menu? No way! Most kids want the good ol’ boring food with no surprises and lots of obligatory ketchup. The gourmet restaurant had set its boundaries straight: amazing innovative food for grown-ups and boring “no surprises” food for kids. These two must live side by side. Ask any parent, If the kids have nothing to eat, there’s no way for the parents to enjoy their meal. The chef’s soul is alive and well in the restaurant, but he must ignore his adventurous spirit when he prepares the kids’ menu. He does this because he knows that he must make compromises in order to innovate.

Finding your sweet spot and setting boundaries

When you want to keep running fast and breaking things while still committing to your customers and to delivering a stable product, the first thing you need to do is to map your product for its sweet spot. The sweet spot is that area where you can feel free to run fast without any worries. That’s the playground with padded walls and soft grass; you can fall, you can trip but nothing will hurt you too much. Once you’ve found that sweet spot, you can set your boundaries between that sweet spot and the zero-tolerance spots. The zero-tolerance spots are the playground with nails and broken glass scattered on the ground, and the high, steep ladders; you can’t risk a fall, any mistake made here will hurt — this is the Kids’ Menu.

Setting the boundaries at Rookout

So where is Rookout’s sweet spot and where are our boundaries? Our architecture is quite common and it is mainly divided into 3 parts.

  1. SDK – That is the part our customers integrate into their code. We call this code a “Rook”. This code is responsible for creating the magic of placing non-breaking breakpoints and retrieving live data on demand.
  2. Backend – Receives the data from the Rooks, processes it and sends it wherever our customers need it. It also processes the commands you’ve sent to the Rooks – whether you’ve created a new breakpoint, set a conditional to fetch your data or even requested to collect a specific variable. It also does all the user management, back-office and all the good stuff backend usually does.
  3. Frontend – Rookout’s web application. This is what the user sees when using Rookout. Users can set a breakpoint, view their code, edit their workspaces, and more.

So which one of these is the sweet spot? Where can we run fast and break things?

The SDK is our temple – it is running alongside our customers’ code, whether it’s production environment, staging or dev. No matter what, this cannot break. Our customers trust us that we won’t affect their performance and thus breaking anything here isn’t an option.

The Backend must be robust and must self-heal when broken. The SDK depends on it to send data to our customers. We can run fast and break stuff but with great caution. A local failure can be transparent and indistinguishable as long as we use the right mechanism in place to recover from it. Using load balancers, multiple instances and proper fallback can actually allow us to experiment and innovate here.

The Frontend is where we can run really fast and break things. This is our sweet spot. We can make constant changes, change the user experience and create a user interface for hidden features. We release about up to 4 frontend versions per day with our amazing Jenkins setup, use LaunchDarkly’s feature flags for fast experimentations and A/B testing, learn fast from our users’ sessions with LogRocket, and other helpful services such as BugSnag, and Segment. You can read more about our monitoring tools in this blog post.

We feel free to break things in the frontend because, well, we can update versions in an instant and we have monitoring that quickly tells us when something just broke. A good investment in setting up all these tools is priceless, our developers can sleep quietly and peacefully while knowing that all the sensors will let them know if something is broken. And trust me, if something is broken, OpsGenie will wake them up.

IDE Plugin – The new sweet spot

When talking to our customers we’ve identified a new need. All of them are quite satisfied with our web application, but they sometimes want to set a breakpoint, see Rookout data or edit a breakpoint from their own day-to-day tools. The main tool that developers use is, of course, their IDE. The demand to develop a plugin for IDEs has been gradually increasing as more and more customers started using Rookout often in their daily dev workflows. Some IDEs provide a lot of documentation on developing debugger plugins, but others lack this information. Either way, these are uncharted waters for Rookout’s R&D. And uncharted waters that our customers want us to sail into are an excellent opportunity to experiment, run fast and break stuff.

Developing the plugin

We dove in head first into developing a plugin for IntelliJ IDEA and pyCharm since many of our customers use it. We wanted to experience what it was like to control Rookout outside of our web application. At the same time, we wanted to give value to our customers in order to receive feedback on it. We understood pretty fast that creating a full-blown debugger plugin with the same capabilities as our web application will take a very long time; but will it be worth it?

The IDE plugin wasn’t an existing product so we decided to do it as quick and dirty as possible. After a couple of weeks of development we created an MVP, and we know it can break, but that is fine – we want feedback and we want to move fast. When loading it for the first time we got a NullPointerException. We don’t know why at the moment, but hey… it works. Our users can install the plugin, enable it, login to Rookout via the IDE, set breakpoints, view messages and be completely in sync with our web application. And of course it doesn’t yet support all the IDE versions, but on the right versions you’ll be able to remote debug with Java and Python.

So, if you’re feeling like you want to experience our adventures in IDE plugins just go ahead and install the Rookout plugin on your IntelliJ and PyCharm. It isn’t perfect, but it is there for you and for us to play and enjoy. Want a perfect IDE plugin? Go ahead and order from the Kids’ Menu. 😉

Rookout Sandbox

No registration needed

Play Now

Table of Contents
Get the latest news

These Are The 3 Biggest Mistakes You Can Make When Moving To Kubernetes

Liran Haimovitch | Co-Founder & CTO

4 minutes

Table of Contents

We are currently in the midst of the biggest KubeCon to date, KubeCon San Diego 2019. With 12,000 expected attendees, KubeCon is the conference for Kubernetes; the one to rule them all, the open-source container-orchestration platform. In honor of this great event, I hand-picked the top-3 mistakes you can make when moving to Kubernetes. These are based on our own experience as a dev-facing company on a K8s journey, as well as the experience of our customers. So without further ado, let me share with you these hard-earned mistakes you should avoid like the plague!

Dilbert.com

Mistake #1: Managing Kubernetes from the command line

Kubernetes deployments almost feel like magic the first time you get them working. You use a (hopefully) short YAML file to specify the application you want to run, and Kubernetes just makes it so. Make a change to the file, apply it, and it will update in near-realtime.

But as powerful as kubectl is, as instructive as it can be to explore Kubernetes using it, you should not come to rely on it too much. Of course, you’ll come back to it (or it’s an amazing cousin – k9s) when you need to troubleshoot issues in Kubernetes, but do not use it for managing your cluster.

Kubernetes was made for the Configuration as Code paradigm, and all those YAML files belong in a Git repo. You should commit any and all of your desired change into a repo and have an automated pipeline deploy to changes to production. Some of your options include:

  1. Using Continuous Integration (CI) tools such as Jenkins and CircleCI.
  2. Using Continuous Deployments (CD) tools such as CodeFresh and Harness.
  3. Using GitOps tools such as Flux.

Mistake #2: Forgetting all about resources

Let’s assume you have got all those workloads up and running with all the goodness of Kubernetes and Configuration as Code. But now, you are orchestrating containers, not virtual machines. Well then, how do you ensure they get the CPU and RAM they need? Through resource allocation!

Requests:

What happens if you forget to set it?

Kubernetes will pack all of your Pods (workloads in Kubernetes-speak) into a handful of nodes. They won’t get the resources they need. The cluster won’t scale itself up as needed.

What are they?

Resource requests let the scheduler know how many resources you expect your application to consume. When assigning pods to nodes, Kubernetes budgets them so that all of their requirements are met by the node’s resources.

Limits:

What happens if you forget to set it?

A single pod may consume all the CPU or memory available on the node, causing its neighbors to be starved of CPU or hit Out of Memory errors.

What are they?

Resource limits let the container runtime know how many resources you allow your application to consume. For the CPU limit, your application will be able to get that much CPU time but no more. Unfortunately (for the application), if it hits the memory limit, it will OOMKilled by the container runtime.

So, go ahead and define requests and limits for each of your containers (read more about it here). If you aren’t sure, just take a guess, and keep in mind the safe side is higher. And whether you are certain or not, make sure to monitor actual resources usage by your pods and containers through using your cloud provider or APM tools such as AppDynamics and Datadog.

Mistake #3: Leaving the devs behind

Immutable infrastructure and clean upgrades. Easy scalability. Highly-available, self-healing services. Kubernetes can provide you with lots of values, directly out of the box.

Unfortunately, those values may not be a priority for the devs who are working on the product. They have other concerns:

  1. How do I build and run my code?
  2. How do I understand what my code is doing in development, testing, and integration?
  3. How do I investigate bugs reported in QA and production environments?

For many of those tasks, Kubernetes pulls the rug from under the developer. Running development environments locally is much harder, moving many of those dev and test workloads to the cloud. The code-level visibility developers rely on is often poor in those environments, and direct access to the application and its filesystem is virtually impossible.

To lead a successful adoption of a new platform such as Kubernetes, you should obviously start out by getting everyone to see the value in it. But you must not forget developers require the right tools to understand what their code is doing in development, staging, and — if you truly believe in code ownership — in production environments. Many of our customers tell us that’s exactly why they use Rookout.

Rookout Sandbox

No registration needed

Play Now

Table of Contents
Get the latest news

How to Debug a Node.js Application Deployed With Jenkins X

Josh Hendrick | Senior Solutions Engineer

7 minutes

Table of Contents

If you’re a developer working on building software these days, it’s more than likely that you’ve considered using the microservice architectural pattern. With individual services that can be run and deployed independently of one other, this architecture is loosely coupled, fault-tolerant, and more easily scalable. Achieving these lofty goals requires a system that can support running microservices at scale and most organizations view Kubernetes as the optimal orchestration system. Although a powerful platform, K8s comes with a learning curve. And when you want to create CI/CD processes for your microservices running in Kubernetes, as most organizations do, things can get very complex, very quickly.

Debugging K8s-based applications is quite tricky as well. This hands-on blog post is going to explore two unique technologies that can make your Kubernetes journey much easier: Jenkins X and Rookout. Jenkins X aims to remove the learning curve for teams wanting to do CI/CD for modern applications. Rookout provides an SDK for real-time debugging and access to data from running applications in any environment, allowing dev teams to improve their MTTR (the time to restore or repair a service) when things don’t go as expected.

Setting Up Jenkins X

For this blog post, we’re going to look at how we can use Jenkins X and Rookout to dynamically debug and extract data from a running Node.js microservice. While this example showcases Node.js, Python and JVM based languages are also supported.

To start, let’s create a Kubernetes Cluster and install Jenkins X into it. For this example, we’re going to use GKE (Google Kubernetes Engine or Googles managed Kubernetes service) on the Google Cloud Platform (GCP). First, we need to get the Jenkins X binary:

curl -L https://storage.googleapis.com/artifacts.jenkinsxio.appspot.com/binaries/cjxd/latest/jx-darwin-amd64.tar.gz | tar xzv

Then move the binary to the appropriate spot:

sudo mv jx /usr/local/bin

Now, we can create the Kubernetes cluster directly from the GCP dashboard, or we can use Jenkins X to create the cluster for us. In this case, we’ll let Jenkins X create everything for us:

jx create cluster gke –skip-installation -n rookoutcluster

If you are missing any dependencies such as gcloud or Helm, Jenkins X will be kind enough to let you know and even install them for you. Follow the prompts to select the Zone where you want to install JX and the cluster will be created.

You can then run the following command to configure and install Jenkins X resources in your cluster. Note that your user must have the right permissions in order to perform all the required actions as part of the setup:

jx boot

This will guide you through bootstrapping your Jenkins X installation including choosing your Node.js project, creating storage buckets, and configuring your Git details.

Creating our Node.js project

Next, let’s create a sample Node.js project to use. If you have an existing project, it can be imported using the jx import command.

We’ll set up a basic Node.js quickstart. Run the following command:

jx create quickstart

In this case, we’ll choose node-http as the quickstart type and name our repository rookout-nodejs. Jenkins X creates the sample Node.js project for us and makes the first commit on GitHub. We also see some handy commands we can run to see what’s going on:

Watch pipeline activity via:     jx get activity -f rookout-nodejs -w
Browse the pipeline log via:     jx get build logs <your-github-id>/rookout-nodejs/master
You can list the pipelines via: jx get pipelines
When the pipeline is complete:   jx get applications

Since Jenkins X made an initial check-in for us, by watching the pipeline activity we can see that the sample application automatically gets built and deployed to the staging environment.  Making a call to:

jx get applications

This shows us that our application is running and available in the staging environment:

APPLICATION            STAGING  PODS   URL
rookout-nodejs 0.0.1     1/1     http://rookout-nodejs.jx-staging.34.82.170.178.nip.io

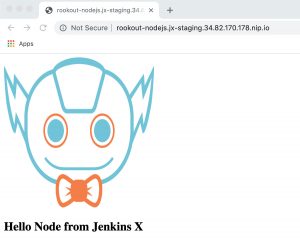
And we can see our application running:

Configuring the Rookout SDK

Over time, as we continue to develop the application, we will most assuredly discover bugs and will need to debug them. Jenkins X provides a great feature called DevPods which allows you to edit application code inside of a Kubernetes pod to eliminate issues with configuration drift, or “it works on my machine”.  But, sometimes there are code-level issues where we really wish we could see what’s happening within our code while it’s running in our staging or production environments. Traditionally you would write log output messages within the code and then iterate on deploying them, testing, and validating that you got the log data you need to identify where the defect lies.

Rookout provides a new way of looking at this problem.  By using the Rookout SDK, we can set “Non-breaking” breakpoints within our application code from within the Rookout debugger (or your IDE), allowing us to debug or even send live application data to various logging systems such as Elasticsearch, DataDog, or wherever you’d like to store data.

So let’s install the Rookout SDK within the application. We’ll switch directories to our rookout-nodejs project and install the Rookout SDK:

npm install –save rookout

The Jenkins X quickstart by default uses a Node 9 image, so we’ll update our project’s Dockerfile to a supported Node.js version (8, 10, 11, and 12).

FROM node:10.0-slim
ENV PORT 8080
EXPOSE 8080
WORKDIR /usr/src/app
COPY . .
CMD [“npm”, “start”]

Then, we’ll import the SDK into our application code:

var http = require(‘http’);
var fileSystem = require(‘fs’);
const rookout = require(‘rookout’);

rookout.start({
token: ‘<INSERT_ROOKOUT_TOKEN>’,
labels: {
app: ‘rookout-nodejs’,
type: ‘jenkins-x’
}
});

var server = http.createServer(function(req, resp){
fileSystem.readFile(‘./index.html’, function(error, fileContent){
if(error){
resp.writeHead(500, {‘Content-Type’: ‘text/plain’});
resp.end(‘Error’);
}
else{
resp.writeHead(200, {‘Content-Type’: ‘text/html’});
resp.write(fileContent);
resp.end();
}
});
});

server.listen(8080);

Now, if we commit the changes above, it will trigger Jenkins X to build our application and deploy it.

Debugging the Node.js Application

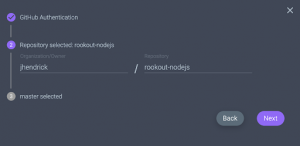
Once deployed, we can load our sources into Rookout by authenticating with our Git provider:

It’s important to note that sources are loaded only locally within the browser. Rookout never sees your source code.

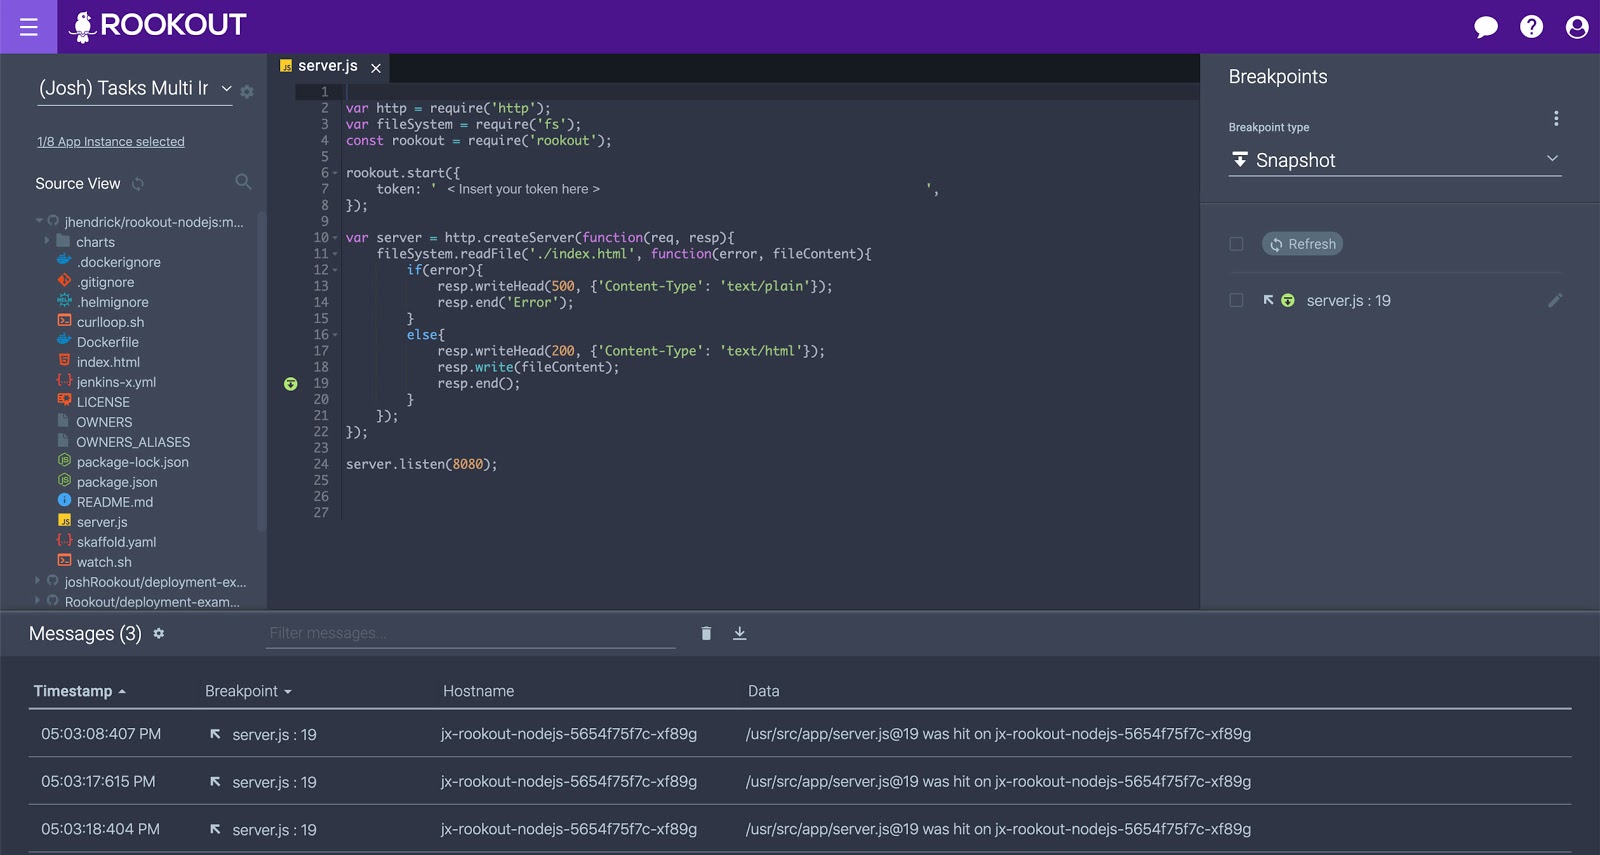
After loading the sources, source files can be opened in the Rookout IDE and we can begin setting non-breaking breakpoints within the application code which will give us a real-time view into the underlying state of the running application. Clicking just to the left of the source code line number allows you to set a breakpoint and if everything went as expected, the breakpoint should turn green. If you encounter issues, check out the breakpoint status page to help you understand what’s happening.

Now, when you interact with the application or refresh it, you will see breakpoint data captured in the messages window below the source code. This captured application state data can be analyzed and if we want to, we could take this debug data and send it to the logging platform of our choice.

debug data and send it to the logging platform

Rookout also provides the ability to tag or label services that are being deployed with the SDK, in order to filter by application instances, thus further refining the source of data that’s returned. For example, we could create a label called ‘env’ and set its value to an environment type (i.e. env:production) so that we could filter by dev, staging or production environments.

In Conclusion

Container orchestration platforms like Kubernetes have given development and operations teams tremendous power and flexibility over how their applications run and scale on demand.  With this power comes complexity and new challenges in terms of understanding what’s happening within the internals of your deployed applications when something goes wrong.

Jenkins X is a powerful open-source technology that can help organizations deal with the learning curve of getting started with CI/CD in Kubernetes. At the same time, Rookout can help organizations save time over traditional logging processes, and assist in quickly getting to the root of problems when it is needed to dive in and debug applications while they’re running in their native environments.

Rookout Sandbox

No registration needed

Play Now

Table of Contents
Get the latest news

The Lost, Ancient Art Of Opening The Perfect Bug

Oded Keret | VP of Product

7 minutes

Table of Contents

If you’ve written code for LoadRunner, you may have been lucky enough to work with The Master. If you were calm and patient, you may have even been shown The Way. The great secret. The lost, ancient art of opening the perfect bug. A bug that no dev can close as “description not clear/does not reproduce/just won’t fix it”. One that is so easy to find and resolve that it makes devs look like hotshots. A bug that you, as a developer, would like to receive yourself so you could quickly fix it.

The problem: getting imperfect bugs sucks

The Master sits quietly at his desk, drinking his tea and smiling mysteriously at a joke only he seems to get. You approach him modestly, seeking help. You’ve opened bugs and assigned them to other developers, but for some obscure reason, they don’t like that. Same as you, they prefer to keep writing shiny new code and drink coffee, rather than try and debug something they’ve written in the past. A year or a week ago, it makes no difference – even two minutes ago is already too far gone for them to care. After all, devs are the Zen monks of the tech world: we only code in the now.

Critical Issue - Cannot Reproduce

The Master: finding the root cause

You quietly share your pain with The Master. He is not angry with you. Few have seen him get angry and lived to tell the tale. Instead, he smiles and insists you, the esteemed guest, sit on the only chair in the cubicle. He then slowly gets down on his knees in front of his keyboard and starts investigating the bug you’ve been facing.

In what seems like an instant, he ends up finding the root cause and sends you happily on your way with the perfect bug description. If you had been watching him patiently after repeating this ceremony several times, you may have trained and leveled up your bug investigation and description skills. Borrowing from the late Sir Terry Pratchett, Mayherestinpeace, you have learned Deja Fu: the lost, ancient art of solving a bug by making it happen again and again and again.

The Way: levels of bug opening

The Master can lead the developer to the path, but the dev must be the one to walk it. Should you choose to accept this journey, the following are the levels of debugging enlightenment that lie ahead. Keep practicing, and in time you shall reap the rewards.

Novice: Say that something went wrong

We’ve all received and opened such bugs. And we’ve all closed them almost immediately. It’s even possible we’ve complained about them loudly or threw something at the person who opened the bug. “Something went wrong?” Is that really all you can tell me? How am I supposed to fix the bug? Tell me what went wrong, how to reproduce it, and how to verify my fix. Sounds basic, right? True. But you have to start somewhere.

The Master may call you a “grasshopper”, other developers will use ruder words, and you will keep on sweeping the floors until you level up.

Intermediate: Say WHAT went wrong

“I clicked a button and the app crashed.” “I called an API and it returned a 404.” “I was unable to install the app.” It’s easier for the developers getting the bug to understand what happened, and if they realize how important the problem is, they may not rush to close the bug as “won’t fix”. Instead, they will reach out to you and ask you for hints that may help reproduce the issue.

What were you doing? Which OS, browser, language, and device were you using? What state was the app in? What did you expect, and what actually happened?

Repeat this exercise enough times, keep filling up those buckets of water, and you will reach the next level.

Advanced: report what you were doing when something went wrong, and how to tell it’s fixed

“I was running the app on an iPhone 8, iOS11, English. At the time I invoked this function with these parameters, this was the state of the app. I expected it to return X. Instead, it entered an infinite loop, colored my iPhone pink and started playing “never gonna give you up” from the speakers.” Developers receiving this bug will know exactly how to reproduce it – just get the app to the same state, and call the same function with the same parameters. They will thank you and write some automated tests to verify the fix and make sure the same bug won’t happen again as a regression.

You have earned your place among fellow bug openers. Keep practicing this art until The Master finally lets you into the inner sanctum to read the scroll of the Dragon Bug Opener.

Master: provide a short, verified method for reproducing the bug and for validating its fix

For an API, provide a call that fails while there is a bug, and passes when it’s fixed. For a UI element or a usage flow, do the same with a UI level script (TestCafe, Selenium etc). Developers you’ve assigned such bugs to may hug you, and will in all probability bow down before your wisdom. For you have provided them with an (almost) perfect bug. One they can easily fix, one that will always reproduce and will never again appear as a regression.

You may now drink your tea with rancid yak butter, smile modestly, and get back to work. You may even pass on your wisdom to other novices. And you may keep spinning the prayer drums, for there is still an even bigger secret to discover.

Supreme Grandmaster: just point me to the broken line of code and tell me how to fix it

This level of mastery is so rare and dangerous, that only a few developers even believe it exists. This is the one true secret wish of every dev. Don’t ask me to dig through my code. Just show me where the problem is. I’ll fix it and then get back to drinking coffee or writing new features. This is the true secret. Open a bug as if you were opening a bug to yourself: with the solution neatly wrapped up.

If you have reached this level, there is nothing left for me to teach you. Except, possibly, point you at a shiny new tool that may help you do it faster.

Do try this at home

Reaching the Supreme Grandmaster level, or even the Master level is easier said than done. Traditionally, the people who test the code or find bugs in it are not the people who wrote the code. After all, had I known there was a bug in my code, I wouldn’t have shipped it, right? The people who find the bugs don’t always have access to the code. And if they do, they don’t always have the ability to run it in debug mode.

But what if I told you there is a tool that makes this possible? A tool that lets more people in your dev team set breakpoints in the code and track a bug to the very code line that causes it?

What if the next bug assigned to you would not only come with the perfect description, the method for reproducing it and for validating the fix but also had the exact line of code for you to start from? What if you clicked that bug description and were redirected to a web IDE with ‘non-breaking breakpoints’ set in it, allowing you to quickly reproduce the bug again, without stopping, even in production?

Sounds too good to be true, right? We thought so too. But it actually works. Take us up on it, and try Rookout with your testing team 🙂

Conclusion

Like many other art forms, the secret to opening a perfect bug involves a lot of patience and practice. But the key to it is simple: open bugs unto others as you would have them open bugs unto you. Open a bug you would like assigned to you: a clearly defined and easy-to-reproduce bug. Preferably with a quick link to the exact line of code you need to change.

The easiest way to fix bugs this way is Rookout – a rapid debugging tool that lets you debug live applications without breaks, restarts, or writing more code. With Rookout you can set ‘non-breaking breakpoints’ on an app running in production, dev, or staging, and track a problematic flow to its source.

And if you happen to see The Master, be kind to him. Share a humble smile, and remember his Way, strange though it may seem to you at first. And enjoy the tea.

Rookout Sandbox

No registration needed

Play Now

Table of Contents
Get the latest news

Microservices: The No-Bullshit Guide For Developers (part 1)

Liran Haimovitch | Co-Founder & CTO

6 minutes

Table of Contents

Over the past few years, whenever the topic of microservices arises, this familiar question also comes up: What is the best approach for developing a few/numerous/countless microservices?

In a time-honored tradition, I generally answer with a slew of additional questions:  Have you already started developing? How large is the team working on the application? Have they ever developed apps in the cloud?

But the 800-pound gorilla question is this: How are you developing — on your local machine or remotely, in the cloud?

Of course, it’s not really an “either-or” question. Each option has its own advantages and drawbacks. To capitalize on some (and dodge others), microservice development often utilizes both approaches. And to add to the fun, the pros and cons of each vary with the development stage.

In this 4-part “Rookout Guide to Developing Microservices” we start (now!) by discussing some of the ways that the characteristics of microservices interact with the dev cycle and environment configuration to impact where and how to develop most easily and efficiently. In part two of the series we discuss developing microservices in the local environment, touching on pros and cons; the situations in which local development is preferable; and the tools that can help you debug.

The third part of the Guide will cover the pros and cons of developing in the cloud, the situations in which cloud is the best way to go, and how to provision cloud environments for development. The final post will cover some of the tools we like which can help you manage the challenges of developing in the cloud.

Here we go!

Microservices and the Dev Cycle

Development is, of course, neither a single activity nor a linear process. It is probably best envisioned as an ascending cycle or spiral, in which a developer writes code, executes it, tests how it works, determines what’s not working, why, how to fix it, and starts the next twist of the spiral by writing more code to address issues and/or move app functionality forward.

Starting in the early aughts, developers moved their entire development process onto powerful laptops. As a result, tooling for the local environment is very mature with IDEs, sniffers, and other monitoring tools providing great control and visibility throughout. With the emergence of cloud-native technologies, however, we’ve gone back to the future: End-to-end development on laptops is no longer an option.

Developing Microservices, Locally and in the Cloud

For microservices, local development is a significant challenge, for a number of reasons:

  • Many apps comprise tens or even hundreds of integrated and interdependent microservices.
  • Different microservices often leverage different runtimes and may be backed by various datastores.
  • Testing locally is unlikely to accurately reflect concurrency, scalability, and performance.
  • Finally and possibly most significantly, cloud-based services are not available on local platforms.
    While these factors make some steps in the cycle very difficult — perhaps even impossible — to accomplish locally, developing in the cloud presents its own challenges.

Let’s get specific: Executing and observing code in the cloud is really, really hard. The local sniffers, debuggers, and process monitoring tools devs know and love simply do not apply. Cloud tools are both less familiar to devs and provide less visibility since they are designed for production tasks and workloads, not for development and debugging.

As a result, verifying whether the code works and if not, determining what’s wrong and how it should be fixed — in short, debugging — is a significant challenge when developing in the cloud. It requires more guesswork and more time-consuming, delay-inducing iterations of the dev cycle.

So here’s the absurd choice: Execute in the test environment that most accurately reflects production, but get little info about how your code runs or where it goes wrong. Or execute locally so you have visibility into where and how things go wrong, but in an environment that’s likely to differ substantially from staging and production.

We’ll get into more specifics about when to use each development environment in future posts in this series. For now, suffice it to say that in most cases, your response when asked, “Will you develop locally or in the cloud?” should be, “Yes.”

Configuration Alignment, aka “But it works on my laptop”

“Fine,” you might say. “So do the development tasks that work best locally on laptops, and move to the cloud when you need to.”  With both local and in-cloud development offering clear advantages and drawbacks, most developers end up working in both environments. When they need visibility, they take the app back to their laptop and use the familiar sniffers, debuggers, and monitors to see just what’s going on. And when they need to see how the code will behave in production, they’ll take it up to the cloud to make sure it works with the databases, storage, DNS records, TLS certificates and other cloud infrastructure that will ultimately support it.

But flipping between laptop and cloud brings its own challenges.

It goes without saying that one of the major advantages of local development is that everything you need — computing resources, storage, databases, and tools — are available right on your laptop, for much lower costs (and with less hassle) than the cloud-based services that you’ll use in production.

Of course, local setups can only approximate cloud environment elements such as managing provisioning, authentication, and so on. Every additional difference increases the likelihood of issues arising later in the dev cycle once the app is deployed to the cloud.

Larger apps entail the parallel development of many microservices. Aligning configurations between all developers, as well as with cloud environments, is a tough challenge. Each time any setting is tweaked, the same change must be reflected across all environments, both local and cloud. Maintaining parallel configurations is one of the most challenging, time-consuming, and difficult issues associated with microservice development.

A Word About Hybrid Environments

For some cloud-based resources and infrastructure, offline replicas are simply not available. As a result, even when a dev is working locally, he’ll still need to spin up databases or other services and tools in the cloud. We refer to this as a hybrid environment.

Hybrid environments offer one big advantage, as well as (surprise!) a number of drawbacks. The big advantage of hybrid development environments is that they allow developers to access cloud resources directly from the local environment.

The drawbacks of hybrid include many of the disadvantages of both development environments — local and cloud — which we’ll cover in-depth in future installments of the guide.

Summing it up

In this post, we’ve covered the challenges of setting up development environments for microservices and the importance of aligning configurations.

In our next post on developing microservices in the local environment, we discuss the situations in which local development shines. We also present our favorite tools and tricks for helping you develop locally. Don’t miss it!

Rookout Sandbox

No registration needed

Play Now

Table of Contents
Get the latest news

How You Can Optimize Your Logging Aggregation Costs

Liran Haimovitch | Co-Founder & CTO

6 minutes

Table of Contents

Log aggregation systems are awesome. They truly are. Being able to get any log I want from my servers with just a few clicks is not only fun but a huge productivity boost.

I have all my logs in one place. All applications. Each microservice. Every load-balanced instance. The entire infrastructure. Plus, I can search through it with queries. I can extract specific fields from my (structured!) logs and split them into tables. Then, I can graph those data points with a click of a button. But why, oh why, does the cost of logging have to be so expensive?

So much money

If you are using a SaaS offering to aggregate your logs such as Datadog Logging, Logz.io or Splunk Cloud, you are probably paying anywhere from hundreds to hundreds of thousands of dollars per month. If you are managing your own infrastructure, on-prem or in the cloud, computing costs are probably lower, but your TCO (Total Cost of Ownership) is probably even higher. And all of that without even getting into the costs of pipelining the data from your applications to your log aggregation platform. So why are we paying so much money?

Well, we are bringing in a ton of data and want to keep it for a period of time. That’s a lot of storage. We want to be able to run fast queries on that data so we need to use fast storage formats such as SSDs, and we need additional storage capacity for the indices. Ingestion for building those indices and make the data available as fast as possible requires a lot of computing power. Storing some of these indices requires memory, plus processing our queries and sending back the result also demands significant memory and CPU resources.

All in all, we need a lot of expensive storage, plenty of RAM and powerful CPUs to bring the luxury of log aggregation to life. The question remains: what can we do about it?

Reduce Logging Volume

The easiest way to get started is to figure out which logs are taking up the most space (duh!) and then to remove them. Surprisingly enough, the size of logs is a multiplication of log counts and individual log sizes. And so, we need to figure out how many times a log repeats itself (which is fairly easy) and the size of an individual log record.

You can do that in Logstash using this snippet:

Now that you have that log, draw a nice little graph showing the log volume over time:

Then start slicing and dicing your data by filters, such as:

  • Microservices
  • Environments
  • Verbosity levels
  • Specific log lines

Once you find out which logs are taking up a lot of space, you’ll have to figure out what to do with them.

For logs created by your own applications:

  • If the log is very large, you’re probably including large variables (such as buffers and collections) in the record. Try to cut back and only include the parts of the objects you truly care about.
  • If the log is happening too often, could it be too detailed? Can you replace it with a log at a higher level of abstraction? Or aggregate the logs by counting or summing within the app?
  • If all else fails, or if the log is not important enough, reduce it’s verbosity so that it will not be created in the relevant environments.

For logs created by 3rd party applications check out their logging configuration. Can you define the verbosity? Can you define which events you care about? If all else fails, you can use drop filters in your log processor or log aggregator to remove the excess logs.

Focus on concise logging formats

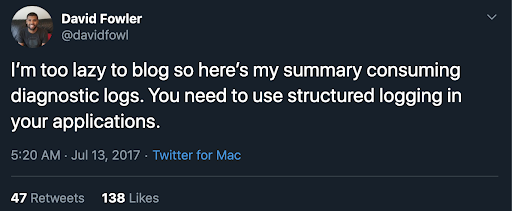
If you are doing logging right, you are probably using structured logging.

David Fowler on Twitter

Despite all its advantages, we’ve learned from experience that structured logging has the disadvantage of not only being larger but often including a lot of repetitive metadata. For example, each of our (optimized) log records contains all of this metadata.

Your configuration might be including a lot more metadata, and if you go overboard with data enrichment you might find yourself increasing log sizes by a factor of 10 or more. Take a look at your log metadata and see if you can optimize it.

If you have insignificant or seldom-used fields in your metadata, consider removing them. Just like some of our customers, you may be surprised by the volume saving this can generate. For important metadata fields that you want to keep, make sure they are efficiently represented within the JSON (or whatever format you are using). Try to use the short forms of values, avoid unnecessary padding, and don’t forget to optimize field names. While I’m not advocating for single-character field names, “application-remote-customer-primary-key” may be safely replaced with “customer-key”.

Archive your logs

For day-to-day operations within your group, you probably need to keep logs for a timeframe of anywhere between a few days and a few weeks. While you always want more, older data just tends to be less useful. On the other hand, security, compliance, and regulatory requirements often mandate keeping logs for anywhere between 90 days and 7 years. For a quick comparison, the difference between keeping logs for 14 days and 90 days is a factor of over 6. That’s a huge jump up in our log volume for little to no value.

Don’t use high-cost log aggregation services to keep log backups lying around, just in case. Archive your logs into cold storage services such as Amazon S3 Glacier and load them back if and when you need them. If you are using logs for long-term metrics tracking, well, just don’t. While I won’t go into the various approaches and tools for long-term metrics tracking, you check out this simple guide for generating aggregating metrics from your log data.

Reduce logging FOMO

One of the biggest factors in writing logs is the so-called “logging FOMO”. The fear of being blind to what our software is doing is constantly driving us to add more and more logs. As long as software engineers are pushing for more and more data collection with managers and ops pushing back on costs, we are in a zero-sum game. New, responsive logging tools ease much of that tension by allowing engineers to instantly collect the data they need. Our customers often mention how easy and frictionless obtaining data is without being dependent on organizational approval and technical processes.

When you hit your logging quota, try using some of the aforementioned methods to trim them back down. Applying these tips will do more than just leave more breathing room in your budget. It will improve the verbosity of your logs and optimize your entire logging workflow by allowing you to focus on the data that really matters.

Rookout Sandbox

No registration needed

Play Now

Table of Contents
Get the latest news

Food For Thought From ServerlessDays Milan

Liran Haimovitch | Co-Founder & CTO

3 minutes

Table of Contents

I just returned from ServerlessDays Milan, where I had the pleasure and honor of speaking at a session and running a workshop about Serverless debugging. It was a jam-packed two days in a beautiful city, and a great opportunity to mingle with local serverless enthusiasts as well as some of the leading serverless thought leaders from all over the world.

Serverless is young and interesting technology and a lot of developers are excited about experimenting with it. At the same time, it’s already famous — or perhaps infamous — for the challenges that it presents. With most companies that are interested in serverless just taking their first baby steps with the technology, it’s a great time to listen to early adopters and learn how to make your path to serverless a smooth one.

Less is more

Even companies that already use serverless rarely operate significant serverless-based systems in production. Bustle Publishing Group is an exception, which made CTO Tyler Love’s talk on how they do it particularly interesting and valuable. While chatted with him afterward, I asked him how many functions they use. To my surprise, the answer was 12 — much less than the dozens I was expecting!

The very modest number of functions is partially explained by the fact they use GraphQL to allow a single point to answer many varied and complicated queries. Since I’ve seen a few companies running over 50 functions start to lose control over their own system, this was a refreshing approach and well-worth considering when planning your function complexity.

The train has left the station

Seeing people glued to their seats at the closing session of a full day of lectures can mean only one thing – that the speaker is off-the-charts charismatic. Which is a perfect description for Gojko Adzic. I enjoyed his sense of humor as much as his professional views on how to use external services such as Auth0 and Twilio by extending them rather than orchestrating them.

Adzic claims that webhooks are “messy” (you should listen to his talk to hear more about it!) and are being replaced, albeit slowly, by serverless engines. In fact, this is the foundation of a new way of architecting SaaS software, which serves both platform builders and product builders. For example, companies like Twilio and Netlify are probably already using Lambdas behind the scenes, on their own AWS accounts.

The key takeout of his presentation was that whether you’re a serverless fan or not, you should accept the fact that you will end up building software around it.

The go-to place for serverless apps

Some of you may already be familiar with the AWS Serverless Application Repository. If you’re not, you should be, since it is a really worthwhile place to get started with serverless and I thank Matthieu Napoli for pointing it out to me. I would definitely use it to prepare future workshops but you can use it to publish, discover and deploy serverless applications (based on SAM) and components, both privately within your organization, and publicly.

While it is not yet a fully mature service, it is growing rapidly and promises to quickly grow much more interesting. If you need any sample applications for DevOps, training or any other purpose, it’s the place to go to. Read more about the repository in this blog post and start poking around!

What’s for dessert?

Food in Milan — real food, not just food for thoughts — is incredible. So is the architecture. I’d be thrilled to go to ServerlessDays anywhere, worldwide, but I doubt if I’d find a better culinary and cultural destination. I only wish that I had more time to enjoy it!

Rookout Sandbox

No registration needed

Play Now

Table of Contents
Get the latest news

Do You Need SOC 2 Compliance?

Liran Haimovitch | Co-Founder & CTO

4 minutes

Table of Contents

About a year ago, I was lucky enough to post an article at SCMag about Rookout’s journey to achieve SOC 2 compliance. Since then, I sat down with many engineering managers who had follow-up questions on the article. They wanted more details on the relationship with the auditors, the steps we took to control various risks, and how it affected our R&D processes. But the one question that has always come up in each and every one of those meetings was- “how do I know if I should get SOC 2 compliance?”

Security Standards

The first thing to evaluate when seeking to comply with security standards is knowing which standards are applicable for you. Here’s a shortlist of some of the common security standards today:

  • SOC 2:  The security standard by AICPA (the American CPA association), covering security and availability for US public companies and their affiliates.
  • ISO 27001: The International Standards Organization specification for IT systems risk and security management.
  • PCI DSS:  The Payment Card Industry Data Security Standard, designed to protect credit card information and enforced by the banking and credit industries.
  • GDPR: Data privacy regulation enacted by the European Union in recent years.
  • HIPAA: Regulation by the US Congress to protect PHI (Personal Health Information).

The easiest way to figure out which of these standards is applicable to your product is via competitive analysis. Go to the websites of your competitors and other vendors in your industry and take a look at their compliance pages. Whatever shows up there is a good candidate for adoption at your company. Once you have that preliminary list of suspects, here’s a list of reasons to go ahead and get that compliance.

Commercial Documents

The most unequivocal reason you should get compliance is fairly straightforward – if they show up in commercial deal documents. For instance, if your line of business includes answering RFI and RFPs, it should be fairly easy to tell which compliance standards are required by your clients and whether or not they are mandatory. Alternatively, your clients might expect certain security sections or appendices in the service agreement.

Either way, if you are encountering a lawyer or a procurement manager requesting you to meet a certain compliance, chances are there is not much leeway there, and meeting that criteria is critical to landing the sale.

Security Review

If your clients are security conscious — and in 2019, they are likely to be so — the sales process will include a security review. This will likely include both a security questionnaire and a meeting with a security professional. This process is often much more flexible than the stricter commercial discussions described above. In most cases, there are technical and compliance requirements for the evaluation, and much is left up to the reviewer’s discretion.

While it’s often hard to determine the impact of compliance on the review process itself, it can definitely help instil trust in your offering. The more time the reviewer spends discussing compliance with you, the more likely he cares about it. Keep in mind that compliance showing up in the questionnaire itself is a fairly weak indicator as some of them are standard and/or composed by third parties.

Friction and Gaps

If you are struggling with the security phases of your sales processes, security compliance can give you a leg up in making it through. Going through the compliance process with an auditor will provide you with the knowledge and information to tackle those frightening security questionnaires and review meetings with relative ease.

Having the certification will provide additional social proof of your knowledge and security posture. And it never hurts for the security reviewer to be able to say- a third party has signed off on this.

Summary

Going through the compliance process is no small undertaking, and can have a significant impact on your engineering and business velocity down the line. If the aforementioned signs ring true, if you are encountering compliance requirements such as SOC 2 in commercial and security discussions, you should probably go ahead and plan the time and resources to go through with it.

On the other hand, you can probably skip it if you are not currently encountering those signs and you’re only reading about compliance in online blog posts and articles, hearing of it during talks and workshops at events, or over coffee/drinks with your friends.

Rookout Sandbox

No registration needed

Play Now

Table of Contents
Get the latest news

Developers! What Do They Know? Do They Know Things?? Let’s Find Out!

Oded Keret | VP of Product

5 minutes

Table of Contents

When I started coding, my professors taught me that copy-pasting code from the internet is the worst thing a dev can do. It almost felt like an army boot camp, with the drill sergeant screaming: “What will you do in the battlefield, soldier? What will you do when you’re a full-stack developer, and you can’t look up code snippets on Stackoverflow? Quit your whining and write your own damn code! Now drop and give me 50!!”

But it seems that devs have been posting questions and copying answers since time immemorial. In a study from 2011, computer science researchers have raised this question to a scientific level, and wrote a research paper asking “How Do Programmers Ask and Answer Questions on the Web?

Many of the insights published in that paper are still quite relevant today. Some aren’t very surprising, like the fact that we consult StackOverflow when trying to enter a new domain. Other insights are less obvious. Borrowing from the greats, like Douglas Adams and Isaac Asimov, I wonder if there is another, more important question we haven’t asked yet: In what situations do developers NOT ask questions or search for answers on StackOverflow? But I’m getting ahead of myself. Let’s start with what we know.

Ask, and you shall learn

It takes us a while to get from “hello world” to “ask me anything about python,” and developers spend a good portion of that time in Q&A forums. In some cases, it’s obvious that we should be asking as many questions as possible. For instance, when we’re facing a new programming language, a new cloud framework, or a new type of problem. And of course, we all find ourselves asking the age-old question: how the h#$% do I exit vim?

In other situations, we’re not sure whether we should be asking a question, because we’re unclear on what exactly is going on with our code. We’re facing an unexpected problem, and we’re confused – is it a bug? Is it a feature? Is there documentation for it anywhere? Has anyone ever faced this specific exception or error message? And if they did, how did they resolve it?

This lack of clarity makes our Q&A behavior inconsistent and unexpected. In some domains, the first thing we will do is post a question to StackOverflow. In others, we’d rather bury our heads in our IDE until we figure it out on our own or until our laptop catches fire, or both.

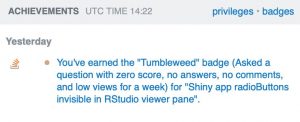
Maybe it’s because the problem domain is something we don’t get no matter how hard we try. Some of us will forever turn to google to help with regex, for example. And maybe it’s because the domain or the specific framework we are working on is fresh, undocumented, and unexplored. In a couple of years, StackOverflow will have all the answers for debugging serverless apps. But today, some of our questions will remain unanswered, and we’ll have to settle for our well-earned tumbleweed badge.

Asking for a friend

There are also times we don’t ask for help because we are too embarrassed to admit we don’t know something. Sometimes we are stubbornly convinced we’ll get to the answer if we think about it for five more minutes. At other times, it’s because we see ourselves as disciplined, hardcore developers, and how will we ever learn to solve problems on our own if we keep copy-pasting from StackOverflow?

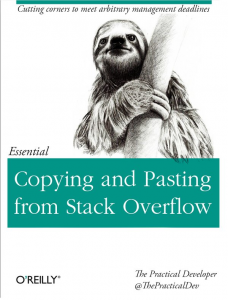
It’s such a common concern that the dev memeverse abounds with “copying and pasting from StackOverflow” memes. A classic case of “it’s funny ‘cause it’s true.” Just look at that fake O’Reilly book. You know the one I’m talking about, the one with the sloth.

You’re probably cackling to yourself: “It’s funny because other people are stupid/lazy/incompetent. But not me. I’m a 10X developer. My commits never break, my regex is stronger than your kung fu, my ruby is sharp.”

Although…

It really do be like that sometimes

Sometimes we need to ask for help after all. It may be because we’re under such a strict deadline that we don’t have the time to bang our head against the docs until inspiration magically shows us the answer. The boss says we have to push the change today; production is down, and the company is bleeding money; or, more realistically, we want to push our changes and get a beer with friends, as far from the office as possible.

And in those situations, we don’t just post on StackOverflow and cross our fingers. We reach out to our friends on Slack, WhatsApp, or any other channel we can find. We search through our logging tools, our APM dashboards, our exception management frameworks.

When the problem seems hard enough, or urgent enough, developers are prepared to go to many extremes to solve it. We’d probably be willing to get down on our knees and pray to the flying spaghetti monster if we thought it could point us at the right line of code to copy-pasta, change or delete.

What was the question again?

Often, after searching literally everywhere, we go back to where everything started. We ask ourselves, our rubber duck debugging companion and our own code. We set a breakpoint, read deeper into the logs in search of a helpful code comment or an eye-opening commit message. We gather all the knowledge we found on StackOverflow, our online dashboards, and the tips we got from friends, and we use it to look at the same code with a fresh set of eyes.

Of course, sometimes the problem was that we couldn’t debug our code in the first place. It was running too far away, using an unknown configuration. Or we couldn’t find a helpful log line, because adding a log line requires us to compile our code, and go through a release cycle. That is where Rookout, comes in. Using Rookout we set a non-breaking breakpoint that lets us debug our code wherever it is. That way we can add log lines without fear or delay.

Next time you find yourself facing a difficult question, and you’re about to go on a mighty quest to find the answer, keep Rookout in mind. Your code, your log lines, your cloud and production environments may be closer than they appear. While you’re waiting for the community to answer your question, you may be able to quickly find the answer yourself.

Rookout Sandbox

No registration needed

Play Now

Table of Contents
Get the latest news

Debugging, With A Little Help From My Friends

Oded Keret | VP of Product

5 minutes

Table of Contents

When I’m on pager duty and the phone rings at 2:00AM with a production crash caused by some code change that was pushed too late in the day, what I really want is a friend. Someone to tell me that it’s all going to be OK, that I’ve solved a hundred such issues, that the solution is right under my nose, that if I just fetch the right log line or stare at the right code snippet the solution will pop into my head.
If they can also brew coffee and point at the right code line, showing me where the problem is – all the better. But even if they can’t, just knowing they’re with me on the line, listening to my educated guesses and assuring me that I’m making some kind of sense would make all the difference.

Rubber duckie, you’re the one?

During office hours, when things are calm, a rubber duck may be enough. My rubber duck sits quietly on my desk, listens to me drone on and on about the changes I’m making and where I think the issues are, and never judges me. But when production is broken and the slack channel is screaming, I need a bit more than that. I need a debugging friend.
Regardless of how you feel about Pair Programming, my experience says that Pair Debugging is extremely effective, and much less frustrating. So whenever possible, I try to implement Rubber Duck debugging with a real live programmer friend.

Ideally, the conversation would go something like this:

Me: This is where I think the problem is.
Friend: Why do you think that?
Me: Well, I expected this variable to be set, but instead I get that exception.
Friend: Where could this exception come from?
Me: Well, there are three user flows that could lead to it.
Friend: Have you tried isolating which of the three is happening right now?

Having a friend who understands basic programming (even if they’re not intimately familiar with my code, or with our entire application), who knows which questions to ask, and who understands my answers well enough to know if I’m making sense, would make all the difference and keep me sane and effective enough to get to resolution quickly and happily. In fact, debugging in pairs is a powerful method for finding tough bugs more quickly than individual users can.

Creating a home base for pair debugging

Initial attempts at building a digital debugging companion have been amusing, but not necessarily effective: For one, it still feels similar to speaking to an actual rubber duck (and I don’t need an app for that). But more importantly, you’re not getting the proven benefit of having an actual programmer friend ask you intelligent, relevant questions and look at your code with a critical eye.

A more significant step was taken by the Visual Studio team, who released Visual Studio Live Share in May 2018. Visual Studio Live Share allows developers to collaboratively debug their code in real time, sharing code context while independently investigating an issue without stepping on each other’s toes.

Visual Studio Live Share works well when you are debugging locally, and when you can afford the time to perform step-by-step debugging, and if you’re a Microsoft shop — or at least a Visual Studio shop. But Pair Debugging is still needed if you’re debugging remotely (for example, debugging a remote staging environment, or a serverless or microservices deployment), and when you can’t afford to set breakpoints (for example, if you’re debugging production). That’s where Rookout comes in.

When we built Rookout, a rapid debugging solution, collaboration wasn’t at the top of our minds. We were concerned with making it easy to fetch debug messages from any environment and stream them to any log collection and analysis tool a user chooses.

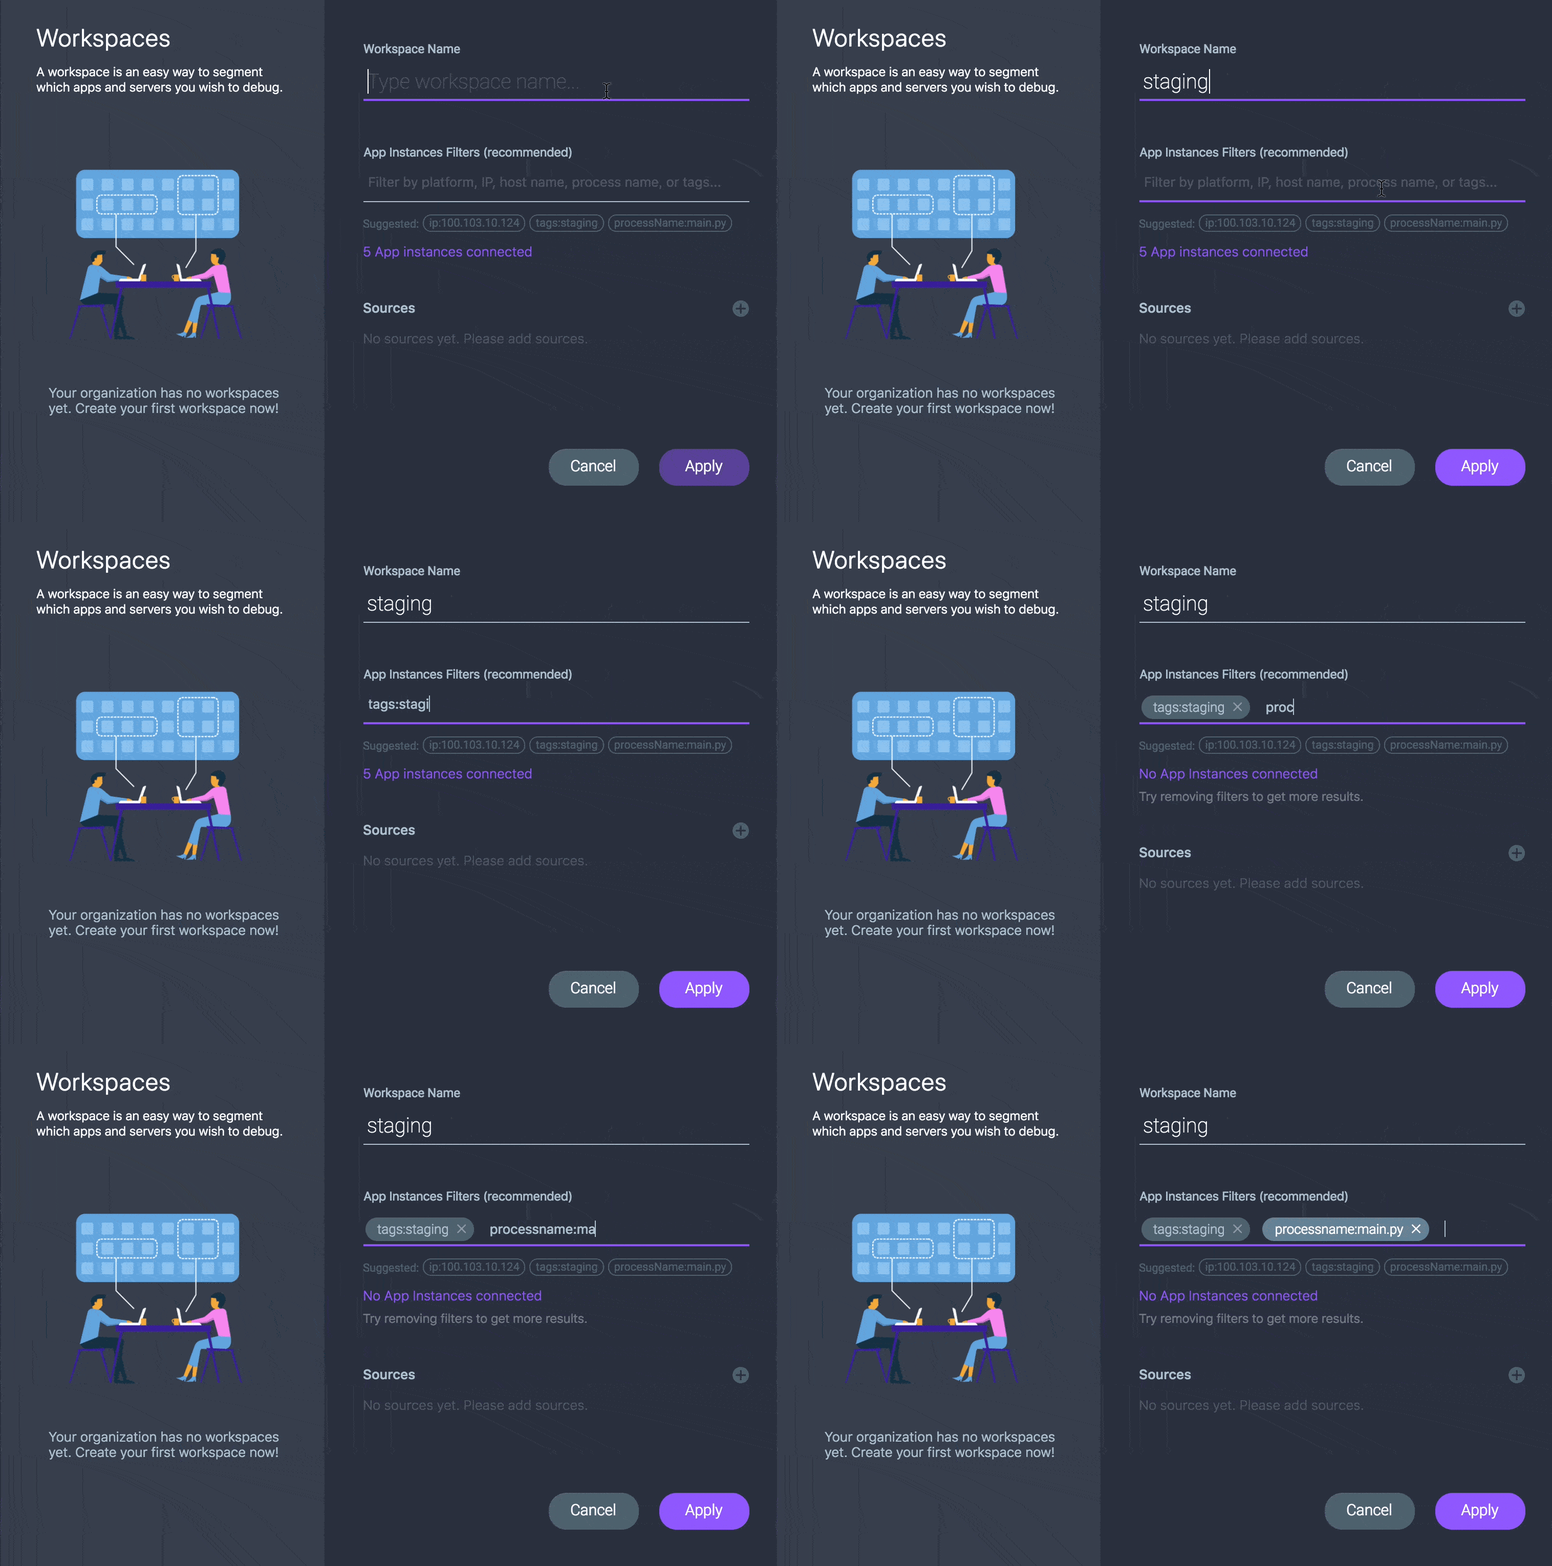
Whistle while you work(space)

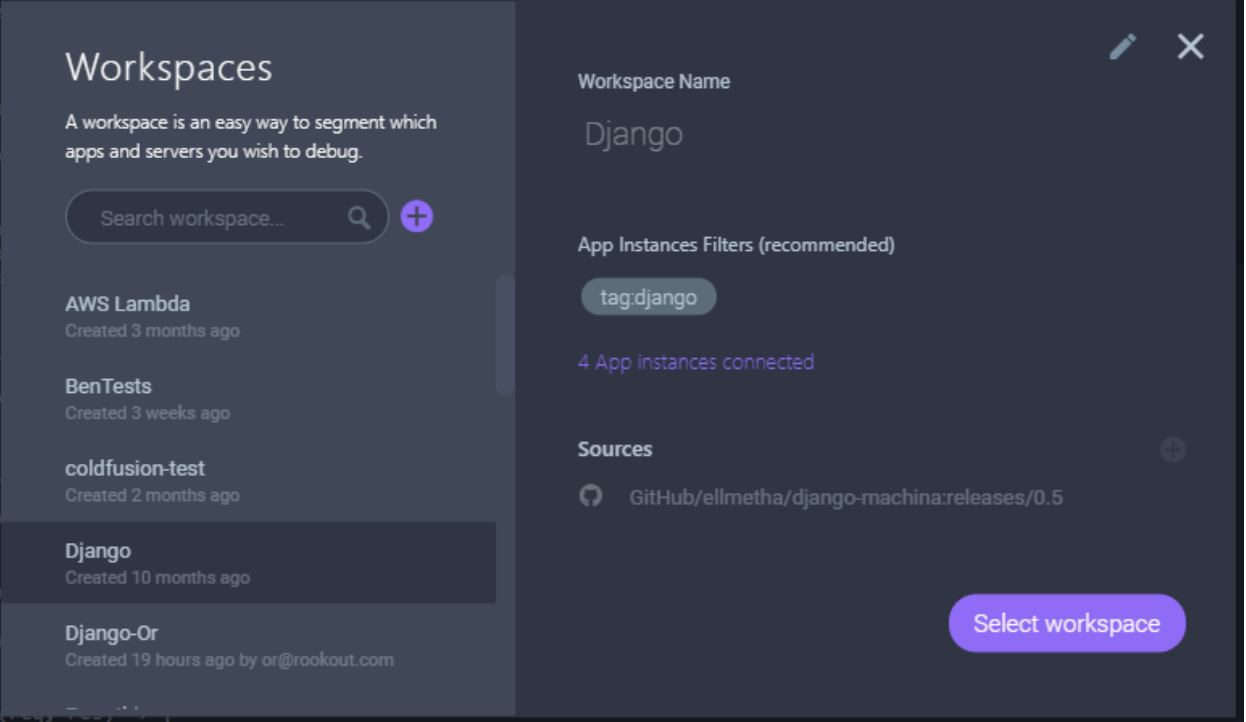
Recently, when we added our Workspaces capability, we realized that we’d stumbled onto something that would make devs (that is to say, us) much happier the next time we find ourselves debugging our prod environment in the wee hours of the night.

Here’s how it works:

As I start debugging, I determine the subset of environments to look at.

With Workspaces, you can easily define a subset of your deployment and source code, and share it with members of your team. When your debugging friend logs into Rookout, he can join you in the workspace and start debugging wherever you are.

When teammates join the debugging effort, they can apply the same filters I’ve already defined by joining my workspace. They will immediately see where I’ve set breakpoints, and which debug messages these breakpoints generated. This also point them at the code snippets I’m trying to debug.

Any member of the team can add their own non-breaking breakpoints into the Workspace and debug together without sharing screens or granting access to teammates’ machines.

To take this one step further, we’re considering adding a “share” option which would point a friend to the exact code snippet you’re looking at. They could ask you the right questions, direct your attention to another line of code, and do whatever a friend needs to do to help you get through an urgent production issue more efficiently than you could do on your own.

Light up the long, dark night of the soul of your app

Imagine the next time you’re woken up at 2 AM, and realize that you need to debug an urgent issue in production. As you log into Rookout, you can see where your teammates are looking. You see which code snippets they suspect, and the log lines or stack frames or error messages generated by the snippets that raised their suspicions.

You can reach out to your teammates and ask them what they’ve already seen, what they surmise, and what they’re planning to try next. And you can start your own investigation, pointing your teammates to code areas you suspect and inviting them to consider what you have in mind.

Sure, you’ll still have your rubber duck to confide in. And you can always send out for coffee. But true happiness is collaboratively debugging with a smart team that you trust. 🙂

Rookout Sandbox

No registration needed

Play Now

Table of Contents
Get the latest news

6 KubeCon US Sessions You Don’t Want To Miss

Liran Haimovitch | Co-Founder & CTO

4 minutes

Table of Contents

KubeCon organizers released their agenda recently and it seems very promising, it also has more sessions than ever before! As always, it’s a real challenge to pick the sessions that let you get the most out of your time at the show. It took me a few rounds of whittling down to choose the sessions that I plan to attend. But based on my experiences in our own environment and what I’ve run into at our customers’ sites, I expect the sessions listed below to deliver great value.

While we think these sessions will be helpful to many attendees, they might not be the best sessions for you. So don’t take our word for it — use our list to inspire your own thoughts about what you’d like to hear. Check out descriptions and speakers, and let the best (wo)man win your attendance!!

Getting The Most Out Of Kubernetes with Resource Limits and Load Testing. Harrison Harnisch, Buffer

Availability and performance are the key when it comes to running production workloads on Kubernetes. Resource limits are essential to ensure that multiple workloads (possibly from multiple environments) can run on the same cluster(s) without interfering with each other. But the trick is to know what those limits should be. For us, this is not idle speculation: We recently witnessed one container damage an entire cluster when enterprise system engineers got the resource limits wrong. We’re looking forward to learning how to get it right, every time!

Front-end Application Deployment Patterns – Ross Kukulinski, Heptio

If you’re already using Kubernetes for your backend, you might want to see what it can do for your frontend as well. Potential advantages include uniform CI/CD and monitoring, eliminating vendor lock-in and more.
Running front-end applications on Kubernetes, however, can create a host of new problems, so before making a decision, it’s important to understand the relationship between frontend and K8s and hear from an expert about the pros and cons of such a move.

Kubernetes and the GitOps Face-Off – Ricardo Aravena & Javeria Khan, Branch Metrics

While Kubernetes opens a new era of an easy orchestration of cloud and other applications, it often feels like an endless number of YAML files must be configured to manage our servers. Git makes the process less error-prone but it still requires tedious repetitive set-ups. At Rookout, we have moved to Git-Ops to manage our workflows and simplify Kubernetes application set up.
We’re counting on this session to update us on the essential tools that will make it a breeze for us — and you — to set up an application on Kubernetes.

Automating Enterprise Governance Using the CI/CD Pipeline – Satyam Agarwala, ThoughtWorks & Mark Angrish, ANZ

As developers, we love to focus on the code we write and the value we bring to our users. In many large organizations, however, developers are less free to focus on value-generating creativity, since they are bound by their applications requiring internal or external governance. Fortunately for us, the new GitOps paradigm, loved so much for its predictability and traceability, can serve the same function for enterprise governance. So instead of viewing CI/CD as the enemy of governance, this session provides practical tools on how to leverage the out-of-the-box traceable and predictable qualities of CI/CD to support governance.

In addition to the sessions above, there are a couple of sessions on debugging that I think will be great.

Do it Live: Measuring your Applications in Production – Jason Keene, Pivotal

Because we’re all about improving observability of live code, the session about how to easily collect additional data from running clusters is right up our ally.

Debugging Applications on Kubernetes – Michelle Noorali & Radu Matei, Microsoft

This is an interesting one for us since it takes as a baseline that if you’re using Kubernetes, you need to get by without debuggers. Of course, we do allow developers to debug Kubernetes, but we’re very interested in discovering tools and techniques that complement Rookout and make debugging Kubernetes not only possible but (dare we say it?) even easy, sometime soon.

Looking forward to seeing you there!

Come see us at the booth S/E 42 — and we can continue the conversation about debugging applications on K8S.

Rookout Sandbox

No registration needed

Play Now