As an entrepreneur and the CTO of a young startup, keeping a close eye on the product is at the top of my priorities. To keep improving the product, I’m always alert to new issues; and seeing those issues from different perspectives is key to resolving problems before users are affected. This is where monitoring comes in.
In this blog post, I will get you into my stack and share the list of monitoring tools I’m using on a daily basis. I will also talk about the value we’re getting from each tool.
Our toolbox helps us meet our Quality, User Experience, and Sales goals. In fact, every time Rookout has installed and implemented a new monitoring tool I came to the immediate realization: we should have added it sooner.
It’s worth mentioning that most of the monitoring tools discussed here won’t set you back more than $100 a month and won’t take too long to implement. They also work with most frameworks and languages.
Don’t reinvent the wheel
You have an early MVP, congrats! Without some fundamental visibility, however, how do you know it’s really working the way you intended it to?
Monitoring tools can be immensely valuable during development, and they are also critical to the product’s success with your customers. Fortunately, you don’t have to reinvent the wheel and fall prey to the NIH Syndrome. Today’s market is saturated with affordable monitoring options which do not require significant financial resources or developing efforts. This means you can start using these tools from day one, getting actionable insights and implementing them to optimize your workflow and product.
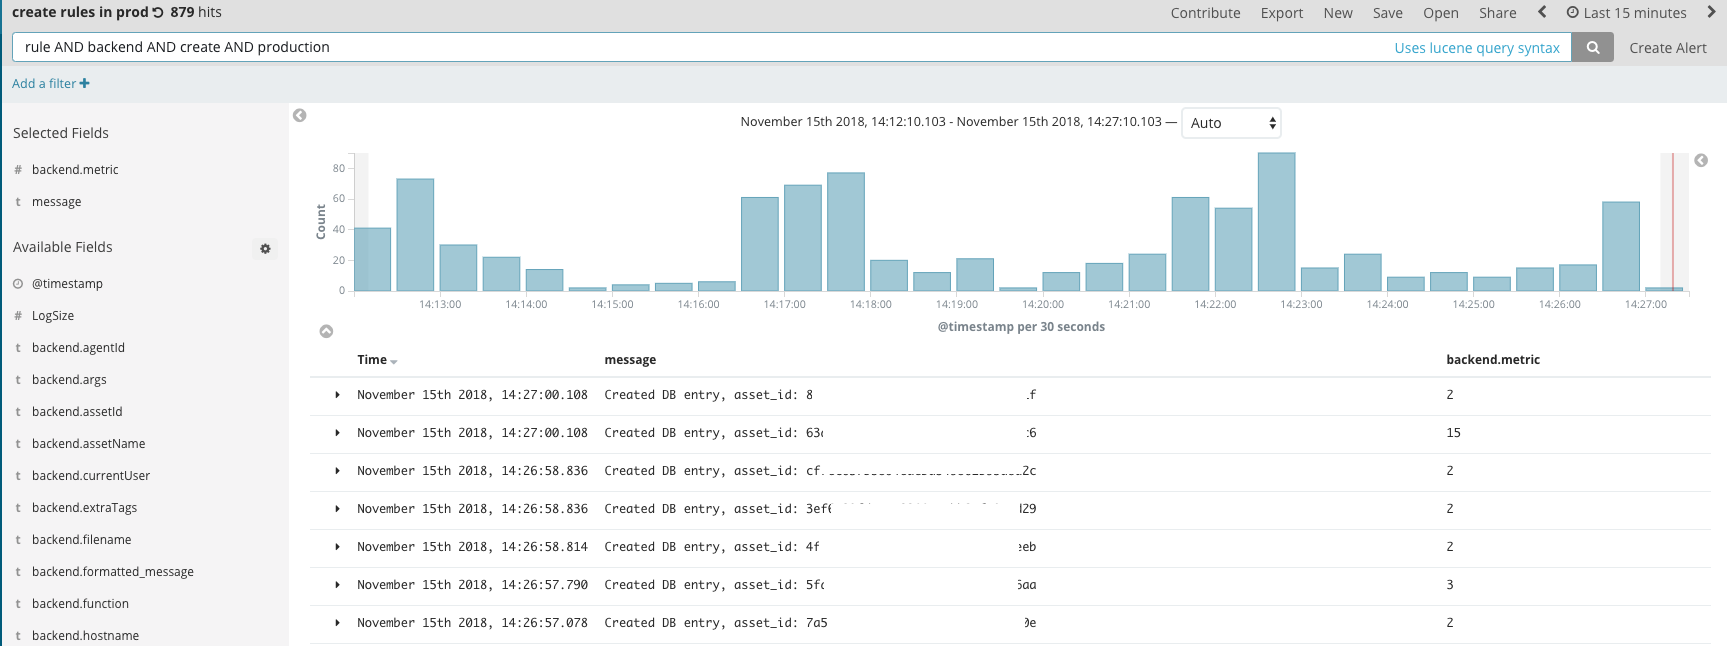
Logz.io
The importance of logs for devs can’t be overstated. Logs are where it all happens; it’s where the party’s at. And when something’s off, you’ll need your logs to deep dive into your code and come up with the questions you couldn’t think of before.
Logz.io provides ELK as a service and simplifies the process of log management. We use this tool to find errors and trace how they happened step-by-step. This is raw, meaty data in its most detailed and varied form, and this is the first place we’re going to check when we detect that something isn’t running smoothly.
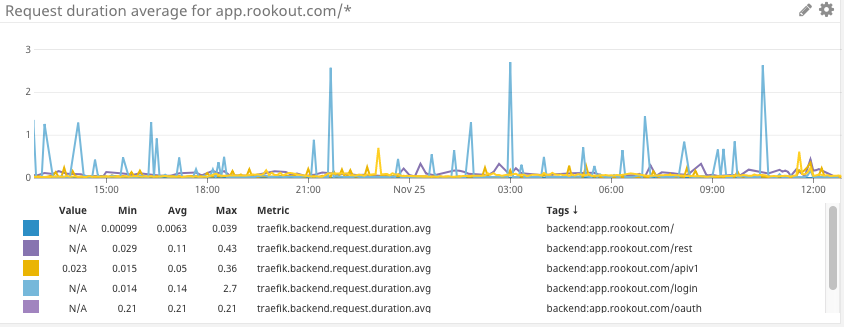
Datadog
APM monitoring is at the heart of overall application health monitoring. Out of the various metrics you can watch for, the following two are the most important:
Error rate: Make sure your service successfully replies to requests. Relying on upstream services to monitor these metrics won’t do if they are unavailable or failing in some way.
Latency: Make sure your service replies in a reasonable timeframe, providing good UX for your users. Relying on upstream service might not suffice as you will not see queued requests waiting for processing.
Datadog allows us to build specific dashboards and alerts to meet our distinct needs. For instance, we have an alert set up to let us know when Redis memory consumption goes over a certain threshold. We also use Datadog to monitor R&D metrics, quality, velocity, and business trends.
Sentry.io
Instead of wasting precious time digging through the logs in search of exceptions, we use Sentry. It collects all of the required info on the occurrence of exceptions in a comprehensive and digestible way. You also get some cool features, such as error aggregation, push notifications, and automatic exception assignment to developers. Sentry is our first line of defense to let us know when things go wrong for a user, across our frontend and our various microservices.
LogRocket
Possibly the youngest tool on this list, LogRocket is a cool new all-in-one frontend monitoring solution. LogRocket records the (securely redacted) sessions of your users, allowing us to understand their User Experience while deep-diving into any bug they may have encountered. You can see the exact behavior of the users on the app, see where they clicked and the state of the app at each point. Our solution engineers use LogRocket daily to assist our customers; our product and UX experts use it to improve the product, and our frontend engineers use it to fix bugs.
Rookout
Last but not least, is drinking our own champagne. We use Rookout to debug our own SaaS platform including the production, staging and dev environments.
Even though we can push a commit to production in under 15 minutes, sometimes the exploratory cycles of adding a logline, or Sentry/DataDog export, just takes too long. Adding a new metric using Rookout in a single click can often mean the difference between a successful and failed onboarding session.
To sum it all up
I know how tempting it is to jump right into developing new features for your app. But especially in the beginning, it is much wiser to invest your resources and time into monitoring. A profound understanding of the application and its behavior, combined with a birds-eye-view of its strengths and weaknesses is vital to the success of your company. Use monitoring tools to deep dive into your current product, ask the right questions to understand it better, and optimize its performance with your users.
As I’ve mentioned before, these tools don’t require many resources, both, in terms of time and money; but don’t underestimate the value they can bring to your company. My best advice for you is this: As soon as you get your MVP out of the gate, put monitoring high up on your priority list and start reaping the benefits.
If you’re developing a Java application, you’re likely using an APM, an exception management tool or a tracing solution. For any of those tools, you have probably faced the common challenge of monitoring a Java application: installing an instrumentation Agent.
Java monitoring is performed by instrumentation agents called Java Agents and VM Agents. Both of them are based on the same underlying framework- the JVMTI, best described in this article by Oracle. At Rookout, we use Java Agents to perform bytecode manipulation, allowing us to fetch debug messages for you wherever your code is deployed. That means we need to make sure our customers can easily install the Rookout Java Agent, and use it to run their code.
But as each of our customers uses a different flavor of Java, a different application server, and a different build tool, we soon found that installing a Java Agent and using it to instrument the customer’s JVM doesn’t have a simple, straightforward implementation.
I recently set out on a mission to find an easy solution that would work across Java configurations. Since my journey had a happy outcome, I decided to share it with you in this blog post.
Quest accepted
Supposedly the simplest way to add a java agent is by adding this command line argument to the JVM:
java -javaagent:agent.jar MyClass.class
For native agents, you’ll use `-agentpath` or`-agentlib`. Although for the rest of this post, we’ll focus on Java agents, everything here applies to native agents as well.
Unfortunately, more often than not, you don’t execute the JVM directly. Due to the complex nature of configuring JVM command lines, you usually use some wrapper shell script (`.sh` for Linux and Mac, `.bat` for Windows) to execute the JVM with the correct command line for you.
In other words, finding that “java -javaagent:…” line above and editing it is not trivial at all.
A second stab at the dragon
I’m sure many of you are familiar with JAVA_OPTS. You probably think “well, that’s easy enough, I’ll just set the options I need there:”
JAVA_OPTS=-javaagent:agent.jar wrapper.sh
While at times this works well, JAVA_OPTS is nothing more than a convention, and most tools do not adhere to it. For example, Maven ignores JAVA_OPTS in favor of MAVEN_OPTS.
In time we realized that finding the appropriate configuration for each tool is a never-ending chase.
Further down the rabbit hole
Making matters even worse is the fact that in some cases, multiple JVMs might be invoked, each with its own set of arguments. For example, build tools such as Gradle or Maven invoke a second JVM to execute an application or run tests, with their set of arguments. To add an agent to one of those JVMs, you would have to edit your Gradle file with something like:
test {
jvmArgs = ["-javaagent:${agent.jar}"]
}
So even if you were able to use any of the methods mentioned above, it wouldn’t necessarily apply to the instance you are trying to monitor or debug.
The wisdom of the ancients
Confused? So was I!
That’s when I stumbled onto this ancient blog post by my friend Demi Ben-Ari.
The wisdom of the ancients has led me to a simple and straightforward solution that works across environments and build tools. All you need to do is use this hidden JVM environment variable:
export JAVA_TOOL_OPTIONS=-javaagent:agent.jar
You just set it in your Shell, on your Docker, or even on your entire (Virtual) Machine, and you’re golden! 🙂
Plus it should take you just under 27 seconds. We counted.
By the way, if you want to read more about the difference between _JAVA_OPTIONS and JAVA_TOOL_OPTIONS and what should you use, check out this StackOverflow gem.
And the other holy grail
We did encounter some cases in which even this magical solution doesn’t apply. For example, using a Java Agent in a Serverless or PaaS deployment is near impossible. And in some organizations, the developer trying to install the Rookout Java Agent doesn’t have the permissions required for changing environment variables, or for directly accessing the file system. To address such cases we also provided a way of setting up the Rookout SDK using an API.
Providing our customers with an easily installable Java Agent used to be a challenge. Many customers had trouble configuring the Java Agent, and we kept chasing different deployment methods to match each customer’s specific needs. Happily, we eventually found out about JAVA_TOOL_OPTIONS. Now, after complementing it with an API alternative, we can quickly cover the needs of our customers looking to debug a Java application.
We hope these methods will make your life easier as well!
“He who controls Dune controls Spice. And he who controls the Spice controls the universe.”
It is not hard to see that Frank Herbert’s science fiction classic Dune is a thinly veiled critique of the world’s dependence on Oil. As some people like to quip these days – Data is the new oil. Just like Spice, Data lets you expand your mind and see into the future. But it is also a great addiction. If you are trying to grow your product, you will have to find ways to harvest this precious resource to fuel your empire. But there are some significant challenges on the road, and we have some tips to help you through them.
Data makes the world go round
As product managers in this day and age, we are taught to live and breathe data. Every decision, every feature, every pivot starts and ends with data. Hypothesis formulation, AB testing, user testing, experiments, Wizard of Oz. All of these begin with asking “what data do we need to validate this decision?” The next step is a design that takes data into account. And, hopefully, the final step includes the experimental results that confirm or disprove our hypothesis. After all, we serve at the pleasure of the mighty Emperor: the business side of the organization, sales, and marketing teams, who require data to generate growth and reduce churn.
We share this passion for data with our new allies – the data scientists. They can make the numbers jump and dance in beautiful graphs, turning an endless series of data points into an insight. Give a data scientist an interesting question to answer, access to huge sets of data, and a Chartio or Tableau license, and they’ll never leave your side (beer and cookies help as well). And if you ask a real data scientist, she will tell you that what she really needs is Excel. And yes, she will have another beer, thank you very much. Much like a Dune Mentat, data scientists are addicted to Data. When given a “hit” of the drug, they will provide you with incredible results. But Product Managers and Data scientists share a challenge within this addiction to data: we don’t control the source of the drug that sustains us.
Hooked on data: we just can’t get enough
In modern SaaS and Mobile products, developers control the source. They develop the features, the databases, and the conversion funnels that we want to measure and monitor. And much like the Fremen of Dune – they sometimes feel like the cheap labor, harvesting the precious, world-addicting substance from the dangerous wastelands of code and cloud-native deployments.
You can’t force developers to give you the data you need, no matter how well you prioritize your backlog. Developing code for the sole purpose of providing business insight is a tedious, uninteresting task. And in some cases, what we’re asking for is technologically impossible to fetch. Or, that’s what a bored engineer will tell us, and we’ll have to take their word for it. After all, we are but lowly, nontechnical product managers.
Expand your mind, or fall blindly into the abyss
In some cases, we try and get around this by buying and installing expensive and sophisticated tools. Google Analytics, Pendo, Walkme, Heap, and others measure the frontend — what our users are trying to do. Other tools like Panoply, Chartio, and Tableau, connect directly to the source and a product manager or data scientist proficient in SQL can fetch data from the database. On top of these, there is a rich ecosystem for tools connecting these sources, aggregating the data, storing, presenting, and running queries on top of it.
There is one gaping blind spot, however. Between the user interaction in the frontend and the data stored in the database, there is a lot of transient information moving around in the backend. Information we can’t measure without writing additional code and building a BI system. The kind of data that DevOps engineers struggle to fetch by adding log lines and throwing them at tools like Logz.io, Kibana, and Elasticsearch.
DevOps engineers fetch this data to make sure production is stable and performing well. But if fetching similar data doesn’t seem to provide direct business value or, more likely, is not exciting and technically challenging enough for the dev team, product managers and data scientists are sometimes left starving. Some of them get around this by getting their hands dirty and writing the code on their own. Others struggle to prioritize the initial task of building a BI system and the ongoing tasks of fetching more data into it. And some choose to remain blind. Much like Paul Atreides at the end of the second, underrated book (50 years after its publication, it feels like ‘spoiling’ a classic Greek Tragedy).
Data must flow – but at a cost
Another recurring challenge is that in all three data segments (frontend, database, and backend), the task of fetching data usually means adding to and changing the code. If your dev organization is mature enough, this is already built into your Definition Of Done. You plan for it when designing a feature; and as you roll out a feature, you track and measure its exposure, usage, and quality to make sure it behaves as expected. You take into account the fact that additional design and development time is required. You also know that as you roll out a feature, new questions will arise, and to answer these questions you will have to write more code to fetch more data. The time you spend planning, developing, and rolling out a feature may double. But you do it nonetheless. Because you know it will provide the business insight your team needs to grow the product. The Spice must flow.
If your dev organization isn’t mature enough – well, may the goddess of data have mercy on your soul. You will release a feature or even a brand new product. You will spend weeks and months in the dark before you can get your developers to prioritize an overcomplicated system for collecting and storing data. Then, by the time you actually get to see the data – well, I’m sure you get the point. If this is a problem you’re facing, the best thing I can tell you is that you are not alone. Keep pushing until you get it. Some icebergs do eventually melt off as you keep pecking at them. We will terraform Arrakis eventually, and we will build a data-driven culture around us as we do it. Not sure which task is easier though.
Instant data from across time and space
So who are the DevOps engineers and the Product Managers in this Dune-themed blog post? If developers are the Fremen, then maybe DevOps engineers are the Atreides, fighting honorably and trying to cooperate with the developers while keeping business and customers happy. And perhaps product managers are the Bene Gesserit — we bide our time, play the political and diplomatic game, and try and pull strings behind the scenes. We subtly try to help our organization become truly data-driven. And we will eventually introduce our developers and DevOps engineers to Kwisatz Haderach – the tool that can bring data from across time and space in an instant. Speaking of which…
Rookout lets developers fetch code-level data with zero code changes, no restarts, and delays. Just point at a line of code, choose a specific variable, and stream its value whenever needed to your favorite data aggregation tool. Do it to keep your DevOps engineers happy when they try to troubleshoot a failing deployment. To help your data scientists get the data they need so they keep smiling. Use it to keep that annoying product manager off your back. To spend more time writing beautiful code, and less time writing less beautiful code that only measures how beautiful your code really is. Do it to save precious time for Spice coffee, or Spice beer, or pear cider. We don’t judge. Just make sure you don’t sit with your back to any door.
In an ideal world, developers would not need to waste precious time writing countless log lines along with every few lines of code they create. We would instead be focused on building the best features we possibly can.
In a perfect world, if a problem comes up and some data is missing, devs would be able to effortlessly extract that data. Of course, we don’t live in an ideal world. In fact, we live in a world where logging hasn’t changed in more than 30 years.
“Logging FOMO” – Fear of Missing Out on log lines and the data they comprise. The anxiety that something may go south in the future and you won’t have a log line to tell you exactly what happened. Trying to avoid that anxiety is the main motivation behind setting log lines before every line of code.
Logging: a black hole of dev productivity
When a dev writes a feature, she may write anything between 100 and 1000 lines of code, and quite a few of these will be log lines. Why – some may wonder? Well, it’s all due to those pesky ‘What Ifs’. What if something goes wrong? What if I need more data for my APM? What If I won’t be able to understand what is happening? What if someone else needs this data point? What if in the future, this product will do something different? What if I forget how this code works? What if I’ll need to add another feature here?
Of course, things often go wrong, and when they do, the first step to solving the problem is understanding what had happened. To get the data that will add observability to our application, we spend a lot of our time adding, tweaking, and removing log lines to collect just the data points we require. These log lines often comprise many of the pull requests we do each day.
Logging is far from easy
Although it may seem like no big deal to an untrained eye, the process of getting logging “just right” for your application is no small task. You are going to spend a lot more time and effort here than you had initially expected; time and effort you would have otherwise used to build better software. You will read through the code and find the meaningful flows you want to record while avoiding potential hot spots that can fill up your logs with noise. You will identify the handful of useful variables to extract and will transform these into a log-friendly format while keeping the log volume reasonable without accidentally sending sensitive data out of the system.
Worse still, whenever you want to change your logs, either to get an extra piece of data to fix a bug, or to remove a piece of data you no longer want to extract, you’ll embark on your own little private Odyssey. You’ll start by re-running the tests, hoping they are stable and deterministic, praying that no one else wrote a test that depends on the log you’ve just changed. You’ll search for someone with the skill, authority, and the time to approve your pull request. Then, if you’ve managed to successfully deploy that change to production, it better not cause that awkward moment when your innocent log line throws an exception or otherwise impacts the flow in some unexpected edge case.
The price of a high-maintenance relationship
While you’re busy writing logs to your heart’s content, you may not realize it, but too many of these logs have issues of their own. You might be logging security-sensitive information such as passwords. It could be that the piece of information you are logging falls under GPDR or CCPA and must be removed. Worse yet, your manager might be paying too much for your log aggregation service and will ask you to remove big or repetitive logs to save on costs. In some companies we spoke to, entire dev teams spend days or weeks at a time just to reduce the verbosity of logs that generate too much volume. They stop building and developing features and spend significant time removing the scaffolding and the dust – the useless logs. These are the very logs they initially spent so much time setting up.
To make matters worse, log lines may not accurately reflect the true state of the system. Your log may not mean what you think it means if, for instance, whoever wrote the line misinterpreted the code or didn’t write a clear enough message. If the application around it changes, your log might grow stale. Have you ever had your favorite log line disappear because the application now takes a different flow to handle that request? Fixing a faulty log requires more releases and hotfixes, and of course, more waiting. All of this just for the sake of logging.
Observability pipelines aren’t built in a day
Building, maintaining, and paying for logging pipelines is an expensive and complex undertaking. To overcome it, many companies try to learn from the people who literally wrote the book about DevOps and observability, such as companies like Uber, Netflix, and Google. A quick read through these famous publications, however, reveals an uneasy truth: even if you are as big and as smart as these “DevOps unicorns”, building your observability pipeline will still be a great effort.
In a way, it’s like developing a whole new product on top of your existing product, just for logging and the resulting observability. The more you rely on it, and the more data you send through this pipeline, the more costly it is to maintain. It entails setting up log shippers such as Fluentd and Logstash; scaling and load balancing them using queues, and configuring or purchasing that Elasticsearch cluster. Add a malformed or unexpected log to the mix and your ETL might drop it, or your Elasticsearch might refuse to index it.
Say goodbye to Logging FOMO: the future is here
Are you frustrated with logging? We’re right there with you. What developer doesn’t dream that a day will come when we can take observability for granted and focus more on the product we’re building. We all wish for a day when we don’t have to spend so much coding time and effort on adding, tweaking, and removing logs. The good news is, this is more than wishful thinking. There are new and effortless ways of getting the exact data points we need from our code without planning ahead, and they’re becoming the new industry standard.
With technologies like non-breaking breakpoints and virtual logging, data can be available to you without having to fear it or worrying all the time about missing out on that crucial log line. These tools aren’t only more effective, they are also light on resources and don’t cost as much. One of our customers told us that adding a missing log line usually entails a 5-hour rebuild/test/redeploy process, significantly slowing down dev work. Another customer had shared that adding log lines in staging is a process that can take over an hour, and sometimes a week in production. Today, they get the data points they require in mere minutes using virtual logging to decouple data points from code and instantly deliver data without stopping.
We are now well underway towards a new world of logging, one that does not include logging FOMO. A world where you can bravely add new features or release a quick hotfix, without anxiously considering which log lines you may miss when things go south. You no longer have to worry as much or waste precious time, because, in most scenarios, you can just measure and get the data later. In this new world, you spend your mental resources on building the perfect product rather than managing your observability pipeline and trying to cut cloud costs.
Are you still waiting for some extra data that you need from your software? The future is here. Give non-breaking breakpoints a try and join us in our shared journey toward agile data and logging sustainability. 🙂
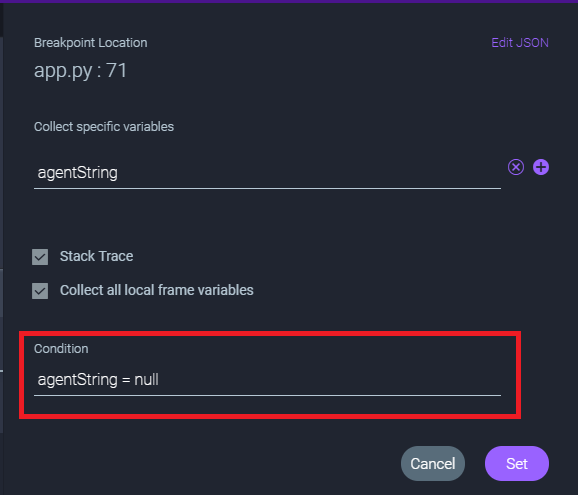
You’re debugging a local app using your favourite IDE. You set a breakpoint, the code stops, and you look at the local variables. You get a sense of what’s going on, what has happened, and what should happen next. Then, you step forward to the next line of code, and the one after that, and the one after that, and the one after that is invoking a function, so you step in again…
If at first you don’t succeed, step in again
Well, at least, you try to step in. But the function you are invoking came from a third party class, and you don’t have the source files. Or maybe it was compiled or transpiled in a way that doesn’t allow debugging. Maybe you’re missing some of the debug information files, or they were generated from a different version of your code.
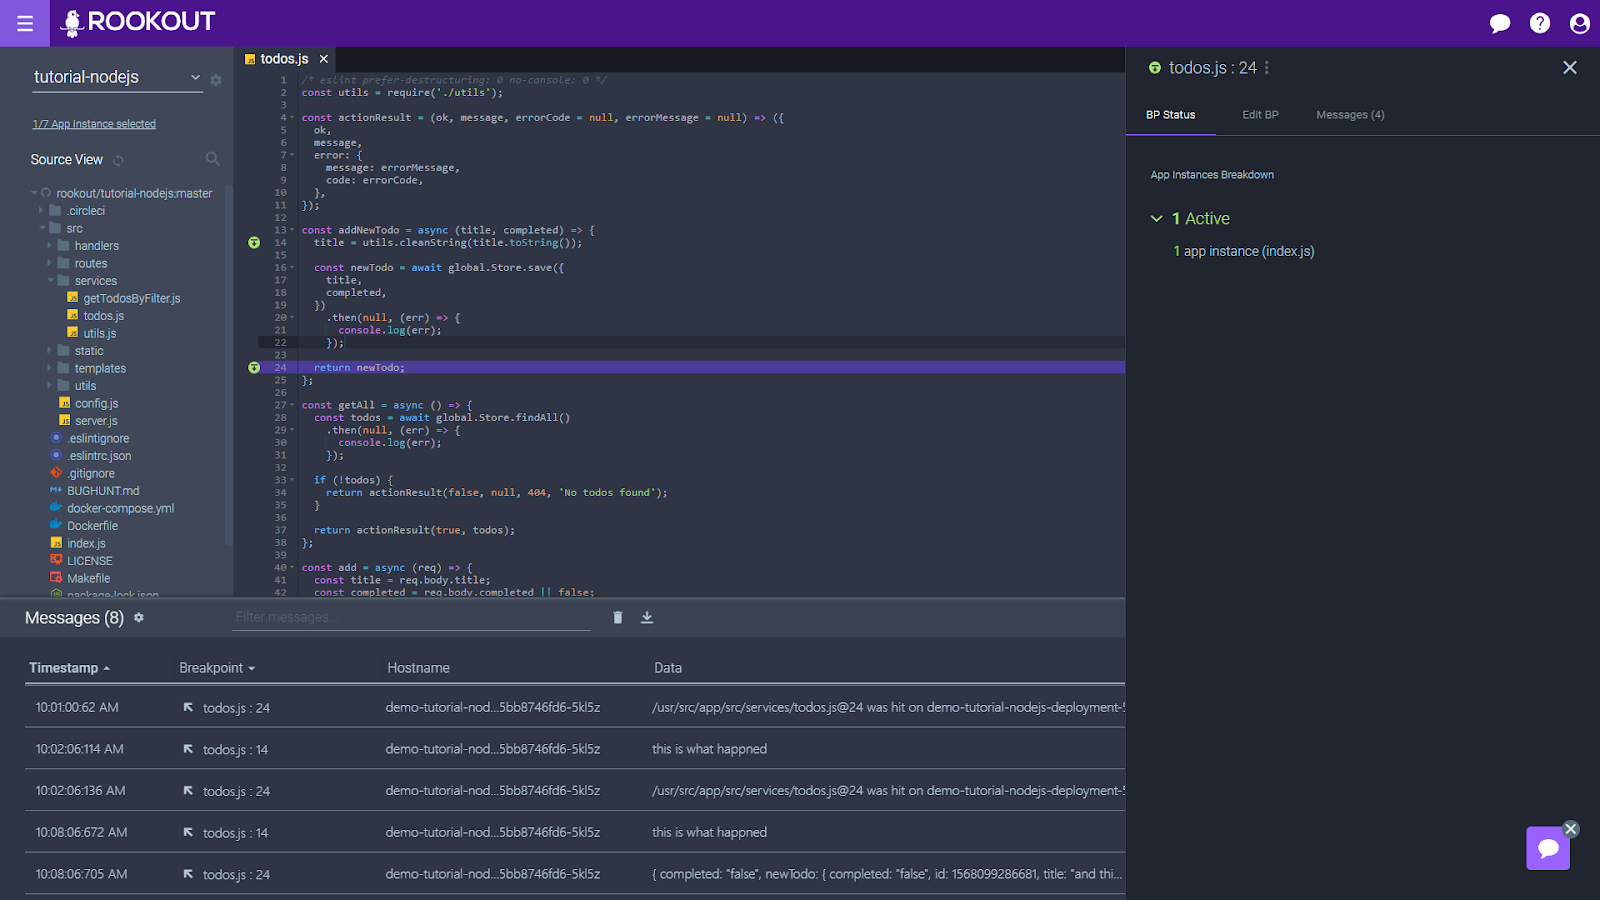
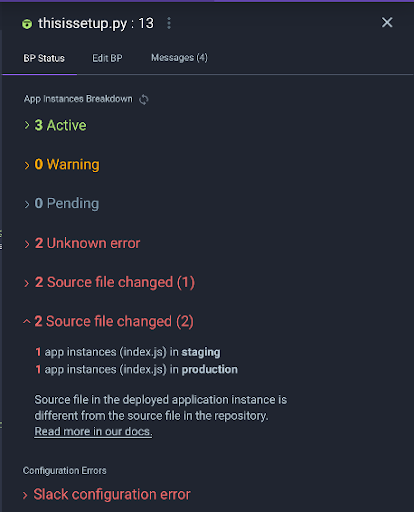
In the happy flow, 1 app instance is connected, and the breakpoint is green and “Active”. Let the data flow!
The best-case scenario here is that you find the debug information or source files, and try again. Maybe you even rebuild the entire project to get the full debug data. The worst-case scenario is that you are just unable to debug.
The bigger problem of data availability
Of course, the above is a simplified and local version of the bigger problem that we are trying to solve with Rookout. We want to make sure you can always get the data you need so that you can always get full visibility into your code. And like many other things, this challenge becomes even bigger when you are building a cloud-native app; when your app is already running in staging and prod; or when you’re looking at a huge monolith that someone else wrote.
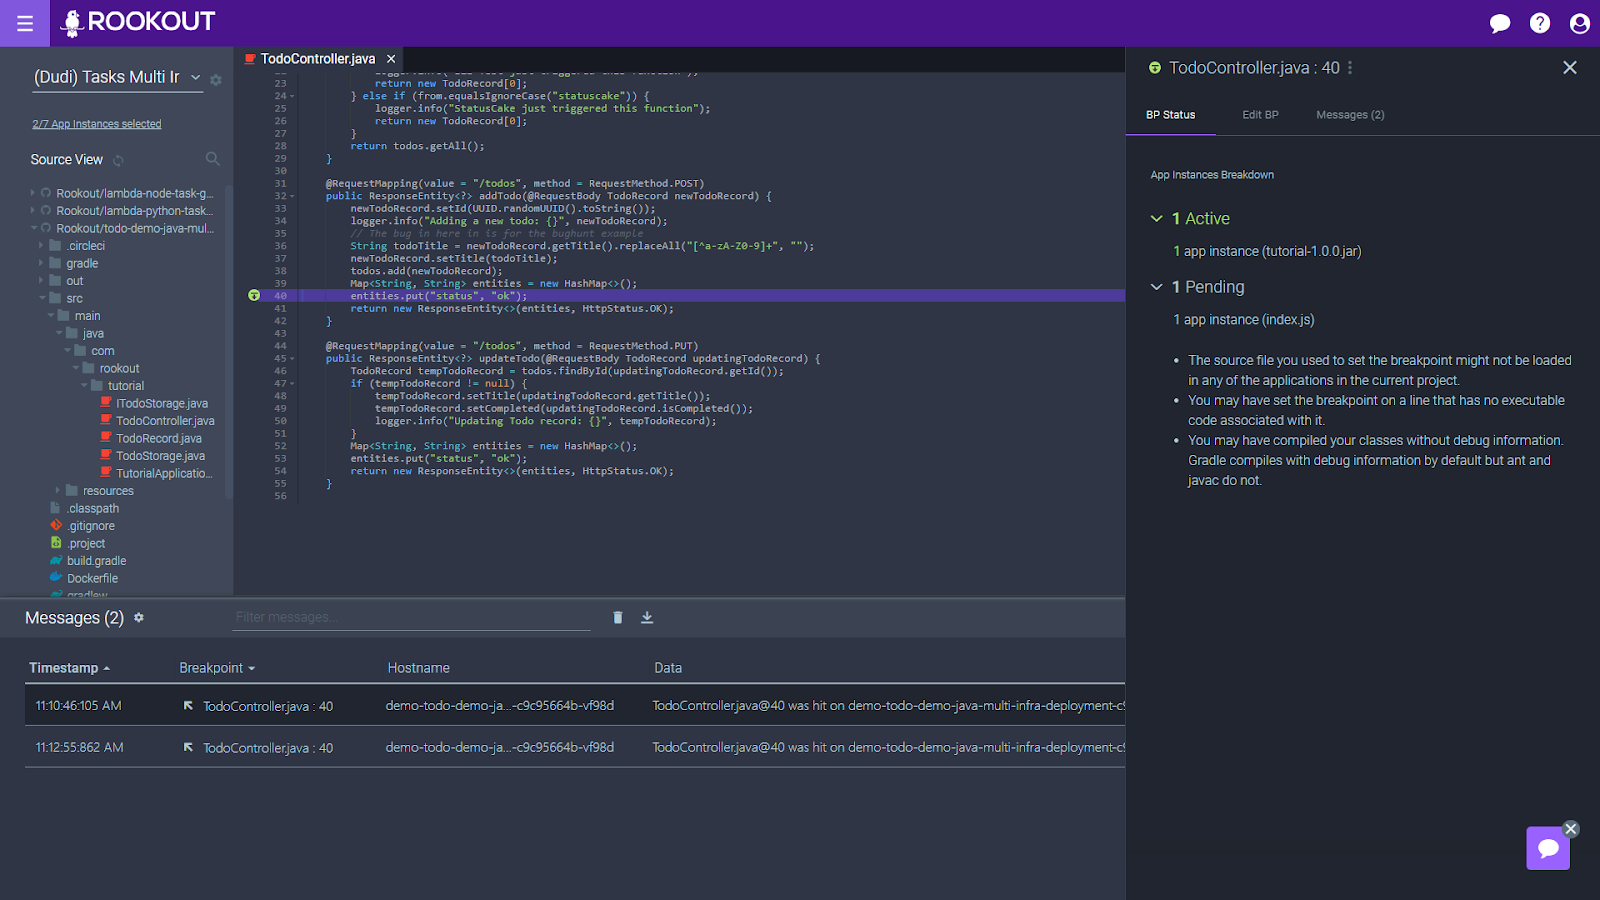
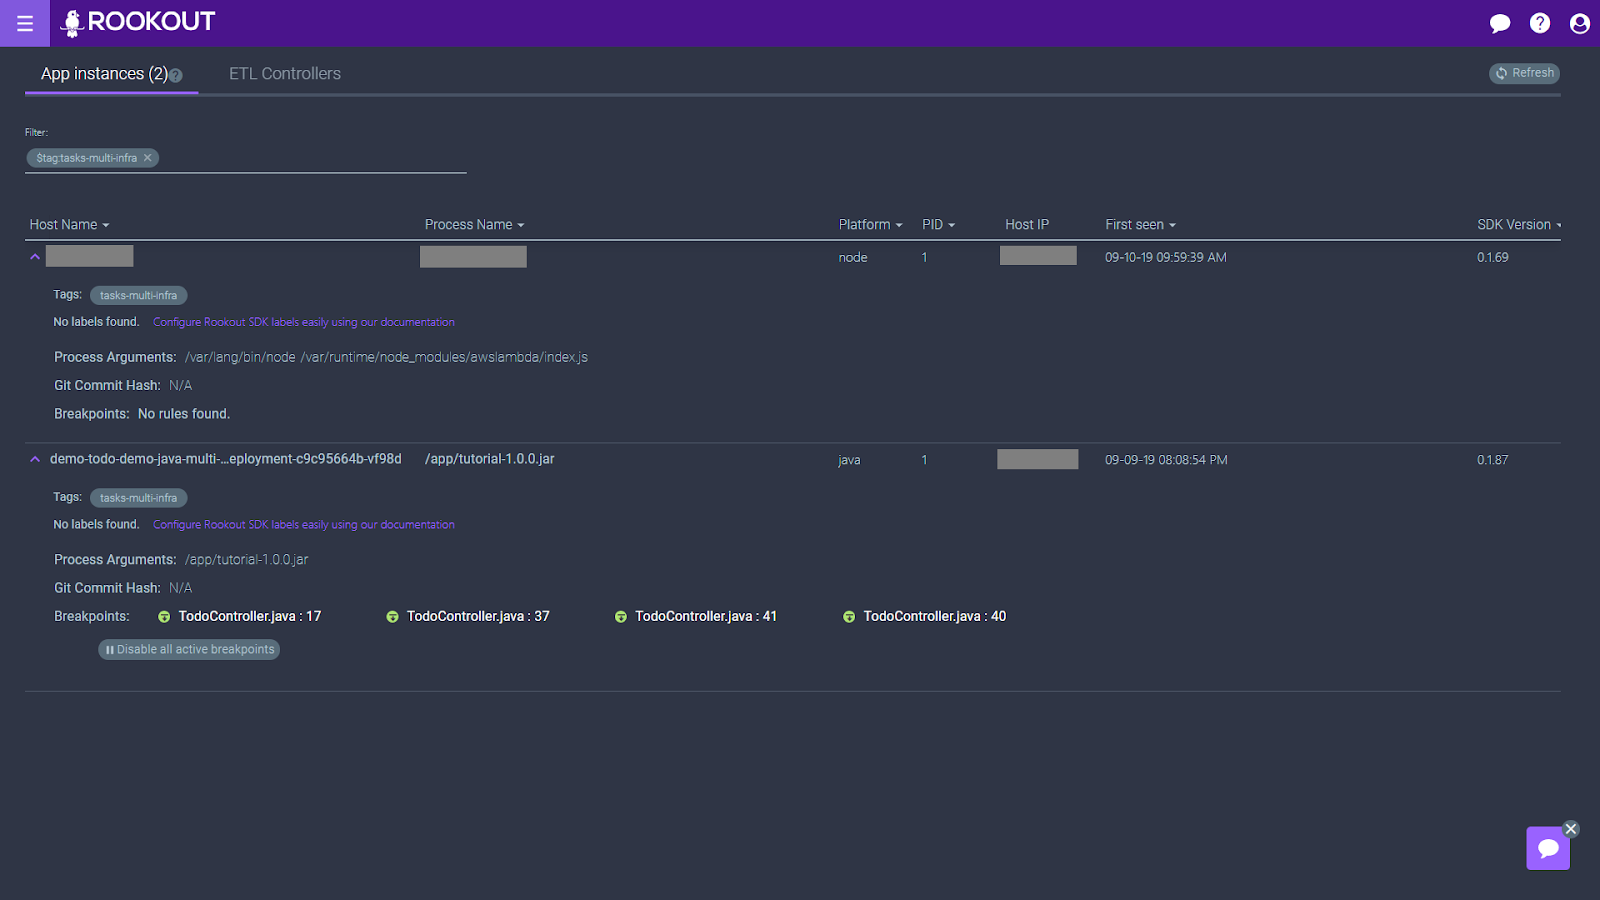
Hmm. This is interesting. Why do I see two apps when I was expecting one? And why is one of them grey and marked as “Pending?” Better read those troubleshooting tips…
In those cases, there are even more things that can stop you from seeing the data you need. For a start, there could be multiple instances of the app you are trying to debug. And each instance could have a different version of the code or a different configuration. Some of these instances may not yet be up at the time of setting the breakpoint, and others may be torn down after it’s been set.
So which instances should Rookout fetch data from? And which instances may require your or your DevOps team’s attention in order to guarantee observability?
Breakpoint status breakdown capabilities
To address these concerns, we have invested significantly in improving our Breakpoint Status Breakdown capabilities.
OK, it looks like something, somewhere, went terribly wrong. And that is why I’m not getting the log lines and debug snapshots I was looking for. Better fetch my DevOps expert and check why this version is deployed in both Staging and Prod and why my Rookout-Slack integration is misconfigured.
Now, expanding the Breakpoint Status pane will show you the following:
How many instances of your application has the Breakpoint been applied to?
Did Rookout fail to apply Breakpoints to some of these instances, for example, because they are running a code version that does not match?
Which instances have such problems, and how do I spot them?
With this information, we hope you will gain some insight into your app even before you start getting debug messages or log lines streamed into your observability pipeline. For example, you may discover that you see more instances or fewer instances than you expected. Or you may find that some instances are not deployed in the right environment, or that they aren’t using the right code version.
In fact, as we rolled out this functionality, we have learned that some of our customers even use this ability to keep an eye on their CI/CD flows, giving their DevOps team a quick health check of their current deployment.
Ah, this explains everything. My Rookout tags and filters were not configured correctly, and Rookout is trying to apply the same breakpoint to two apps – one written in Java, and one written in Node. Better clean this up so I can keep working quietly.
BP status breakdown for Rookout deployment
The breakpoint status should also allow you to troubleshoot your Rookout deployment. If you are missing the debug messages and log lines you were expecting, the breakpoint status indicator may hint at the underlying reason.
In some cases, we learn that the Rookout SDK was just not installed on the relevant instances, or that it cannot reach Rookout due to network connectivity issues. In other cases, we learn that specific frameworks behave differently than expected when we baked them into our app. If you are using Python forking servers, or Node.js transpiling frameworks, you may have already faced these challenges.
And as happens quite too often, Randall released this comic just as we were working on this blog post. We feel it’s a painfully true representation of us trying to write an error or warning message you should not have faced when troubleshooting a sneaky breakpoint. If you do see this error message in Rookout, please reach out to support@rookout.com and let us know.
We hope the new breakpoint status breakdown view will help you understand what’s going on when you set a Non-Breaking Breakpoint, and that in turn, will help you gain the observability you need. If you have any questions or suggestions, be sure to give us a shout!
Let’s face it: If you’re a developer, you spend a lot of your time logging. Today, as organizations are leaving on-prem servers behind and moving to containers and microservices, the importance of logging has grown. Finding the right logs is critical to understanding issues, fixing them and redeploying, yet searching manually through log data has become nearly impossible.
Sending logs to your management system of choice can be messy. Even experienced developers are challenged by configuring multiple microservices and deploying across all of them, especially when it’s not a one-size-fits-all solution. The process is different with every system. Configuring across multiple services can be error-prone, require many permissions and significant costs for large amounts of storage space.
Keeping up with the logs
Luckily, logging management systems have kept up with the changing software development ecosystem, and devs everywhere have access to the information they need. The management systems we work with today can not only store logs and alert development teams but provide reports and insights for different functional groups in organizations from business, to operations, to marketing.
At Rookout, we are first and foremost developers. We know how important logs are, but we also know how time-consuming it can be to write them and send them off to multiple services, each with their own integration process that varies from language to language. Our solution? Stream directly from Rookout to all of your favorite management systems without installing libraries, adding code snippets, or writing logs into your code, one by one.
Setting up dynamic logs
An application can be comprised of thousands of lines of code, and devs are prone to experiencing logging FOMO when writing the logs that accompany them. With logs being a valuable source of information, we spend a significant amount of time writing them into our code so that we don’t enter the dreaded rebuild/test/redeploy cycle. Well, what if you never had to set up a multi-node cluster on your machine or log every line? Instead of logging your code traditionally, you can set up Rookout’s non-breaking breakpoints as dynamic logs.
Dynamic logging simplifies the way you write, collect and send your logs. You can set non-breaking breakpoints to collect only the data you need, without writing extra code or redeploying your app.
A standard application might look something like this:
def func():
count = 0
for i in range(5):
logging.info(“My test index : %d” % (i))
count = count + i
time.sleep(1)
logging.info(“My count : %d” % (count))
func()
Now take a look at what our app looks like with Rookout installed:
import time
import sys
import rook
rook.start()
time.sleep(2)
def func():
count = 0
for i in range(5):
count = count + i
time.sleep(1)
func()
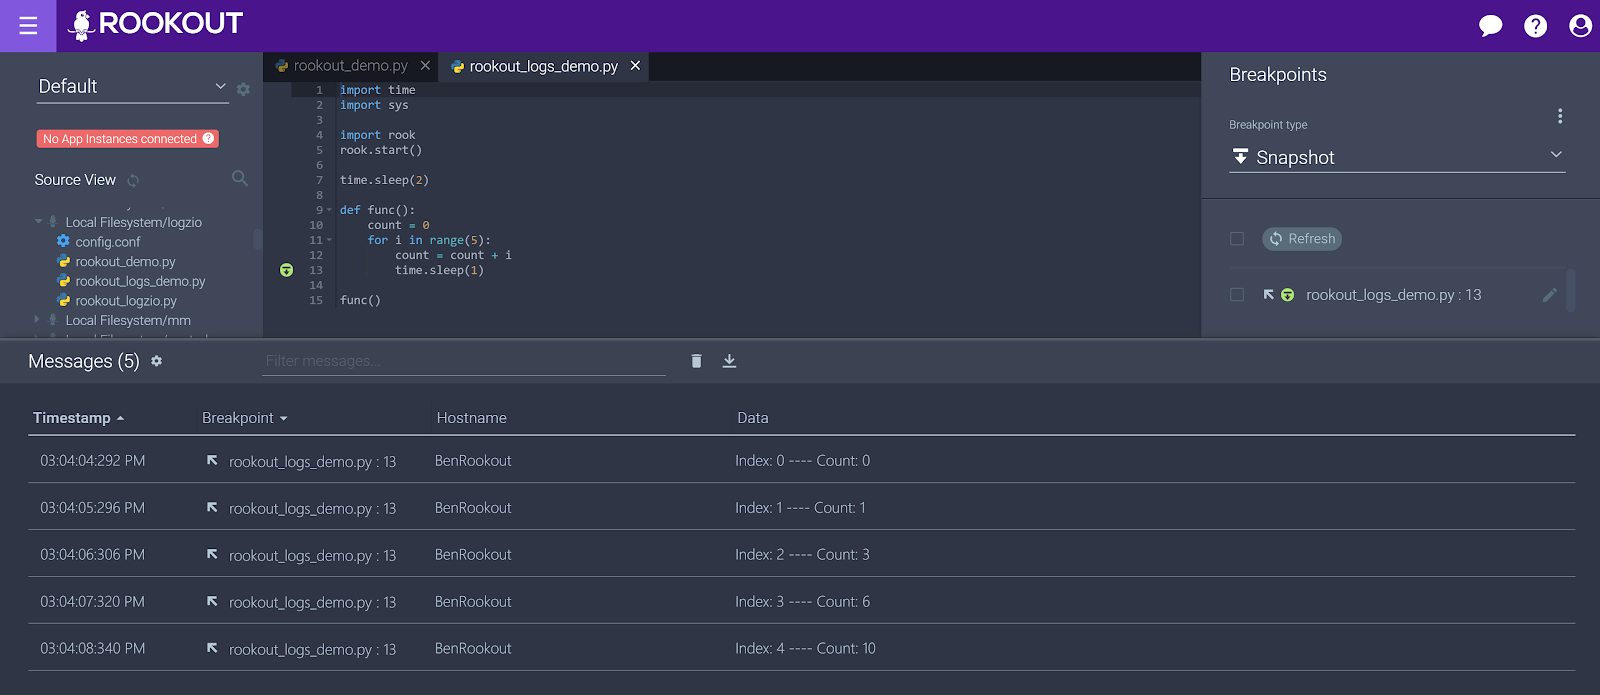
When Rookout is set up, you can simply set your breakpoints by clicking next to the line number and then see the data in the IDE-like interface.
Integrating Non-Breaking Breakpoints and Management Systems
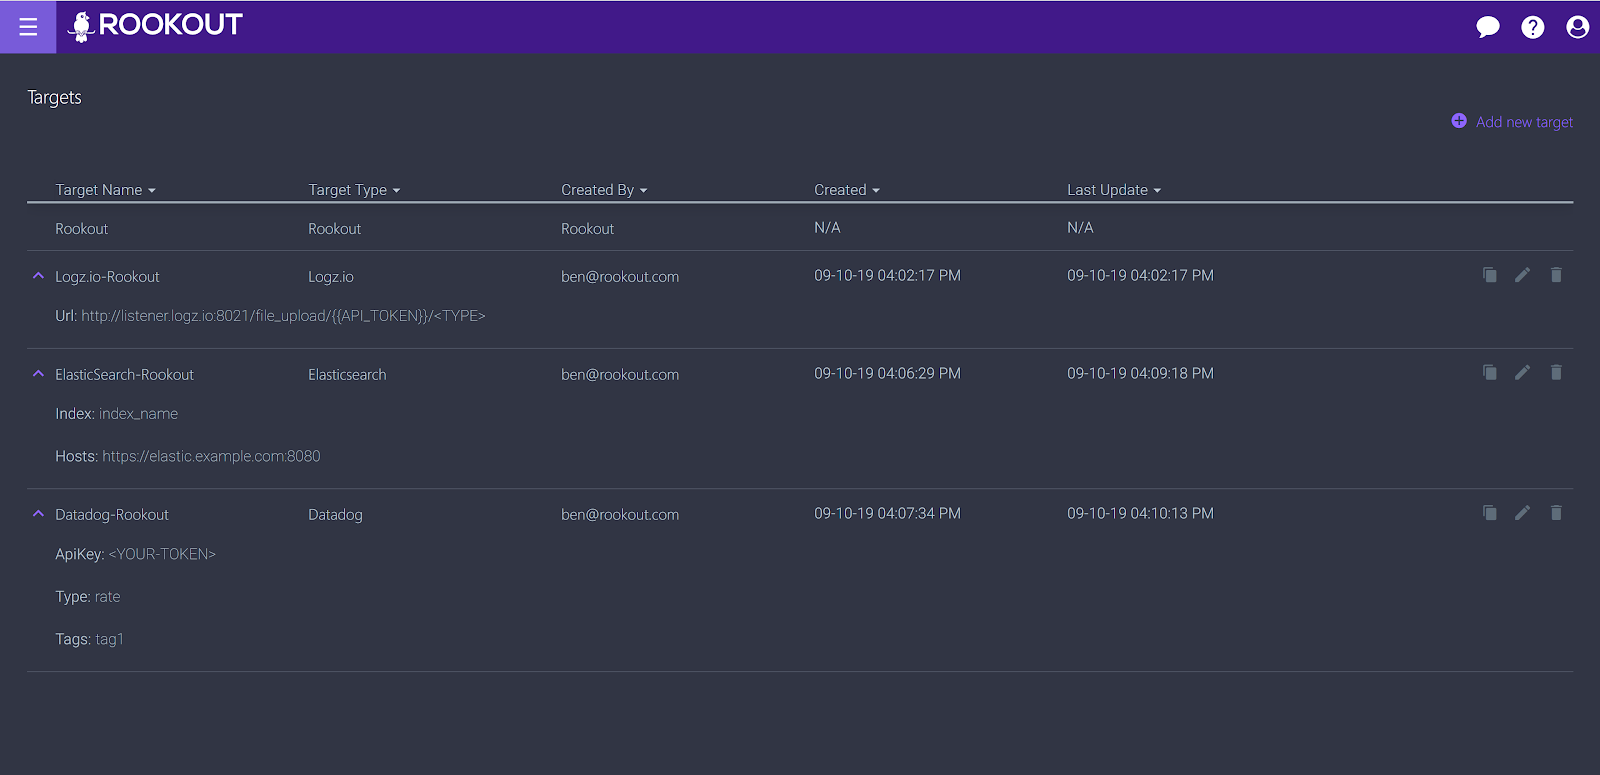
If you’re interested in streaming logs to your management system of choice, simply set custom targets for your breakpoints, using the URL, index, or API key of the system in the Rookout app. To do that, simply go to Rookout’s top left menu and select ‘Targets’. Whether you have legacy management services running or you’re setting up new infrastructure, the process is the same.
Once you have your targets configured, simply edit your breakpoints, select the target of your choice in the app and they’ll stream directly to your selected service.
We decided to stream our logs to Elasticsearch first. Your logs won’t appear in the Rookout IDE if you set up streaming, but if you query the Elasticsearch server you can see the result. Here’s ours (simplified):
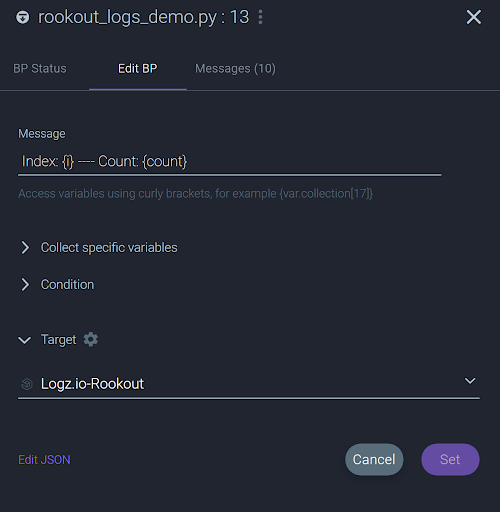
Let’s look at another example and stream our logs to Logz.io. Logz.io provides the ELK Stack as a managed service and could be a good option if you don’t want to maintain your Elasticsearch cluster on your own. In this case, all you need to do is set the target of your breakpoint for the service after configuring it, it’s as easy as that.
Now, if you run your app, you’ll see that the breakpoints you set in Rookout with the click of a mouse are streaming logs directly to Logz.io.
Letting the Information Flow
Development cycles can take months, and adding a single log line can often take over a week from writing to deploying it into your app. Modern software ecosystems require us to use dynamic, elastic methods, and to log compulsively so we can easily identify security issues and bugs in our code. With logging becoming a sensitive part of the deployment cycle for many companies, accessing the data you need on-demand before you rebuild and redeploy has become an essential part of the dev workflow.
“Logs, just like any other commodity, change in value. Sure, some logs might not be important 100% of the time. But the last thing you need when troubleshooting an issue in production is that a single message holding a critical piece of the puzzle not available. The result of compromising over what data to log, because of costs, is a dent in your system’s observability. “ – Daniel Berman, Logz.io
Every team has its own needs, from data collection to aggregation and metrics, but configuring new services as your team grows and your application changes can mean repeating sensitive processes. We believe observability should be at your fingertips, so you can invest your time into the things that matter most.
Give non-breaking breakpoints a try, and stream your logs quickly to all your favorite systems.
Ever feel like the world is moving by so rapidly, that it feels like something got left behind in the rush? That’s how we feel about being able to debug your applications easily. Technology has advanced rapidly, but the ease of debugging has not.
With the introduction of serverless computing, the way enterprises are designed and how they build their production applications was changed. The introduction of Serverless allowed developers to build and ship much faster, which in turn allows them to concentrate on coding rather than maintenance, auto scaling, and server provisioning, to name a few.
There are a multitude of serverless computing options, but for the sake of this article we will focus on AWS serverless applications. In short, an AWS serverless application is made up of multiple components, and the AWS Lambda function is what essentially connects these components and holds them together.
Debugging Differences: Monolith vs. Serverless Applications
The hype around serverless applications and microservices grows every day, and that growth engenders the negativity around the term “monolith”. Yet, as most developers know, when it truly comes down to the nitty gritty of debugging, monoliths win the debugging game with the ease of debugging that they allow. Due to the complexity of its architecture, Serverless Applications are much more difficult to debug. This difficulty has led to many challenges when using Serverless Applications.
Necessities of Debugging a Monolith App
Many developers would acknowledge that debugging is not their favorite part of the job, and when combining debugging with monolith applications, it gives them a moment of pause. There is no need for this though, as monoliths are simpler to debug.
So how does one begin? First start by choosing the preferred IDE, where a breakpoint will be set at the line of code you want to inspect. After the breakpoint is set, the app will then be run in debug mode. In monoliths, most issues must be debugged locally as there are only two failure points: database behavior or UI/backend. Both of these can be set up in a local environment. Debugging monoliths is a bit simpler because all tasks run on a single process.
So What’s Different? The Path to Debugging a Serverless App
As serverless has paved the way for new technology, it has also changed the process of debugging. When debugging a serverless application, the most common method is logging. This is because it allows the developers to understand real application behavior.
Serverless flows have more components, and are therefore more complex. Due to this complexity, they have more failure points. It isn’t possible to set up all of the components in a local environment in order to debug and there is no option for debugging in a remote environment due to the nature of a serverless application.
So what can go wrong? Plenty of things, as it turns out. Serverless applications are complex and have many components, which introduces many opportunities and variables for things to go awry. On top of that, the loose dependency between all these components makes it harder to understand when interface contracts or compatibility is broken, making the developer’s life even more difficult while debugging.
Serverless Debug Mode: The Challenges
A serverless application is complex. It is made up of multiple components in which a developer might have to debug any or all of these components when an issue arises. This can lead to many challenges that are common to any developer that attempts this.
Here are a few examples of these common challenges:
Challenges of Modern Distributed Architecture
The components of serverless applications are highly distributed. Having the ability to locally simulate these components is not always an option. Even more so, debugging them in a live environment is not easy and it can be quite costly. Having distributed architectures leaves room for things to go wrong in many areas of the stack. Having the ability to drill into the code as various services are running in their native environments is critical to quick defect resolution.
Gaps in Remote Serverless Debugging
Remote debugging is not a usual option for serverless applications, as there is a lack of access to server and OS level. When developers aren’t able to understand where the issue is and why it is happening this proves to be a major stumbling block, because they are then unable to debug live, which is necessary in order to fix the issue.
Serverless Functions are Ephemeral
When focusing on serverless computing, servers are ephemeral in their design. This allows for a limited opportunity to identify what the crux of the problem is in order to debug. As with microservices in general, serverless instances can blink in and out of existence. Different instances of the same function can be invoked for different sequential requests (load-balancing). This already makes it difficult to try and pinpoint which instances should be observed, but ephemerality in Serverless takes a step further by creating the logic that manages these motions that are almost completely invisible to us.
The Price is High
Most debugging is done in a live environment in a serverless application. This can prove to be an expensive process. This is due to the fact that when debugging, log statements need to be added. Once added, they need to be stored somewhere or to be aggregated to a 3rd party resource, such as logz.io or Datadog. Then, of course, comes the wait for redeploys and tests until those are actually operational. Essentially, this whole process and the overhead it causes raises the price of debugging.
Local Setup Frameworks are Scarce
Very few frameworks exist to set up Lambda in local environments. Those frameworks that do exist come with limitations that impact a developer’s ability to debug.
Debugging Serverless Locally with Serverless Framework
The Serverless Framework is an open-source framework that is universally used for developing and then deploying serverless applications. It can be used with other serverless providers because it isn’t closely connected to AWS. The Serverless Framework provides an open-source command line interface (CLI). The CLI gives support for commands, which allows serverless applications to be created and built using a .yml file template.
Debug Serverless In the Cloud: How To
In this article, so far we have focused on locally debugging a serverless application. The problem is, however, that when serverless applications run in live environments, new issues or bugs can be discovered when the functions of the applications connect to other services and some of the functions aren’t able to be tested locally.
API Testing Tools to Debug Serverless
In order to debug a serverless application on AWS, there is the option to begin with API Gateway testing. There are a variety of clients available in order to test the endpoint, the most common being SoapUI, Postman, or Insomnia.
AWS Console to Debug Lambda Function
A helpful option for testing Lambda functions directly without the involvement of an event source is the AWS Console. This option is useful when having to check real-time issues when deploying a Lambda for the first time.
To begin with, create test events. These events can be run directly on the function while building and writing the application. The test events are able to mimic what is anticipated from any AWS service.
Further metrics are able to be checked by using the monitoring tab. This tab has the ability to provide metrics that check throttling, error rate, etc. This can be very useful when debugging issues. Even more so, detail logs can be viewed by clicking on the “view logs in CloudWatch” button.
Use AWS Cloudwatch Logs to Debug Lambda Function
The primary source of information as to how an AWS application is behaving is AWS CloudWatch Logs. This applies to Lambda functions as well. By default, Lambda Functions send data to CloudWatch, which then creates a LogGroup for each Function. Within each LogGroup, there will be a variety of Log Streams that assemble the logs that are produced from each particular Lambda instance (multiple instances can be created for each Function). Log Streams consist of log events. If you click on an event, it will give you detailed information for the particular Lambda function that was invoked.
This shows the best way to see what’s happening with a specific invocation that has an issue with a Lambda function, when digging through logs to do just that. CloudWatch Logs are almost real time, and therefore as many logs as needed to debug an issue can be collected.
AWS X-Ray to Debug Lambda Function
CloudWatch may have many great features, yet it is limited in providing information for the Lambda Function. So how is that information obtained? X-Ray was introduced by AWS to provide answers to questions, such as what failures are the ones causing performance issues and how to get around integration. It generates a map of application components and also allows end-to-end tracing requests. X-Ray can also be used to analyze apps while they are in development or production.
Leading Tools for Debugging Live Serverless Code in the Cloud
Debugging an AWS application is possible when using native tools, such as X-Ray, SAM, and CloudWatch. Be that as it may, it is often necessary to use multiple tools to get all the information that’s needed. Commercial tools such as Rookout, Lumigo, and Epsagon do away with that need. Instead of getting buried under all these tools, the commercial tools are simpler to use, to set up, and provide a much more seamless experience for tracing, monitoring, and debugging Lambda functions as well as AWS and third-party managed services.
Lumigo
Lumigo is a SaaS platform that helps developers monitor and troubleshoot their serverless & microservices applications. The platform lets developers identify and fix issues in their applications before they impact the end user.
Lumigo was founded by former Check Point executives and is an AWS Advanced Technology Partner.
Epsagon
Epsagon, founded in 2017 by veterans of the Israel Defense Forces’ cyber intelligence unit, has built an AI-powered automated end-to-end performance monitoring platform for serverless architectures that can predict performance issues before they occur, allowing any company – from SMBs to large enterprises – to eliminate downtime by proactively identifying and flagging potential problems.
Rookout
Rookout is a data extraction and pipelining platform, which provides an unparalleled capability to collect any piece of data, from the deepest levels of live code, on demand. Save hours of work and reduce debugging and logging time by 80% – with zero friction, overhead, or risk. Using non-breaking breakpoints, Rookout empowers engineers to find the information they need and deliver it anywhere, in order to understand and advance their software.
Rookout is SoC2 and HIPAA compliant, and is currently available in Python, Node.js, and JVM runtimes, in all environments (from on-prem to Serverless).
The Holy Grails of Serverless AWS Lambda Debugging
Where are we ultimately running to in our haste to debug our applications? Serverless has already proven that it’s paving the way towards revolutionizing the way cloud applications are built and deployed. It solves many problems that developers have, but also introduces many of its own new challenges. Most specifically, these challenges arise in the areas of debugging, tracing, testing, and monitoring. The focus by commercial vendors on the building of tools is done as a result of the need to address these problems. So while you run straight to finally get rid of that pesky bug that’s been (no pun intended) bugging you for weeks: take a step back, relax, sip that cup of coffee, and realize that the tools needed to win the technological race exist and are right at hand.
Over the last few days, I have been hard at work writing an up to date comparison of Kubernetes tooling (check out the first and second posts if you haven’t already, which cover tools that help you reproduce issues locally). Going through the sprawling Kubernetes ecosystem and curating the knowledge that would be the most interesting to fellow developers and engineering managers has been no small task. That’s why section 3 will cover the heart of cloud-native development: the IDE.
Some of the questions I have been struggling with have been:
Which tools should I cover?
How do I categorize the tools in an easy-to-read manner?
Which tools are worth mentioning, and which are too niche or immature?
How do I write about the tools I have been using daily for years versus the tools I have never actually used?
I hope I have been doing well so far, and I would love to hear some feedback from you. In the meantime, I’ll dedicate this blog post to the set of tools that is closest to every developer’s heart. What IDEs support Kubernetes development, and how? Whether you are a fan of JetBrains, VSCode, Gitpod, or Lens you should check it out.
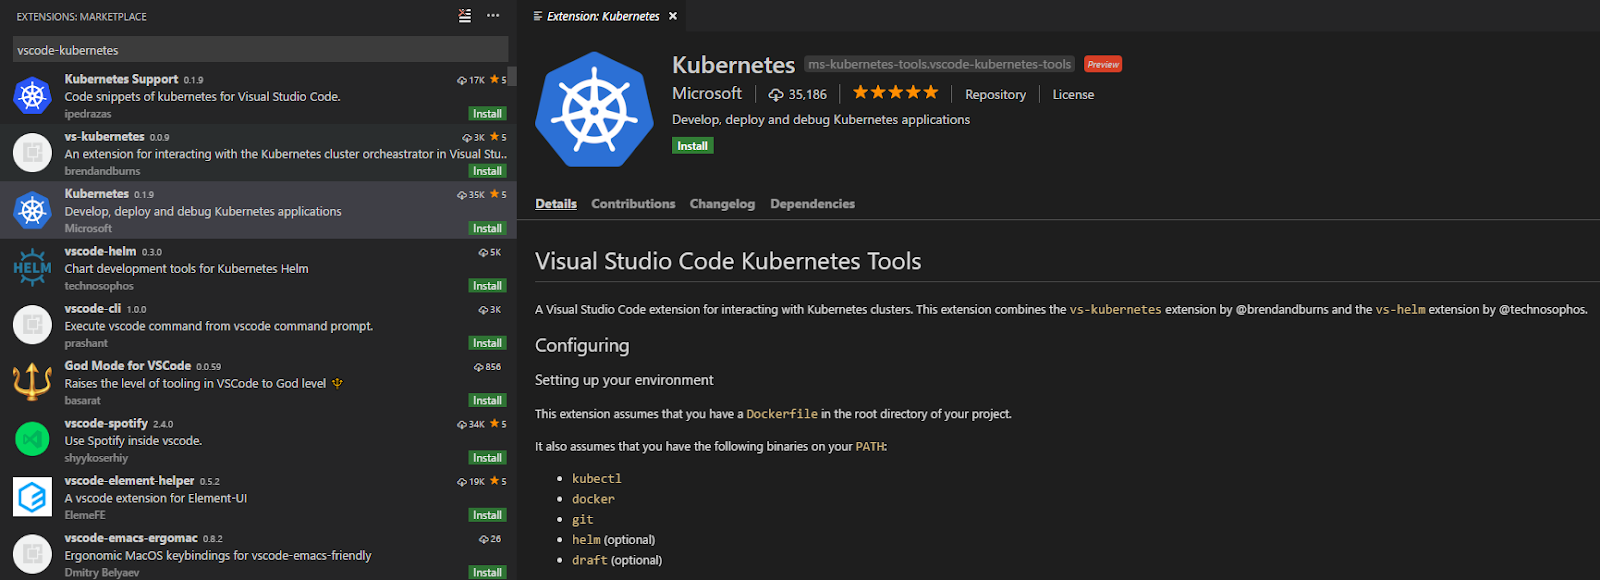
JetBrains
Ever since launching the first version of IntelliJ in January 2001 (what a start of the century!) JetBrains has defined the gold standard for the industry with its line of IDEs. With eleven different products for all the major programming languages out there, they are my personal favorite.
As a traditional IDE, IntelliJ focuses on providing you with the best possible experience as you are writing, building, and debugging code on your machine. It has built-in support for building and debugging Docker containers, but for Kubernetes support, we have to look to the extensive plugin marketplace.
From JetBrains, we have an official Kubernetes plugin. First and foremost, this plugin allows you to interact with Kubernetes clusters directly, viewing and editing cluster objects, seeing pod logs, and even running a remote shell. Additionally, the plugin provides rich editor capabilities for working with Kubernetes manifests, Helm charts, and Kustomize patches.
On top of that, all the major cloud vendors have their plugins for JetBrains. The Azure and AWS plugin deal mostly with Serverless workloads, but GCP’s offers many capabilities for working with Kubernetes.
VS Code’s Kubernetes Plug-In
Visual Studio Code, the (relatively new) open-source IDE by Microsoft, is making waves in software development circles. VS Code is plugin-oriented, and extensions implement even the most elementary features such as Git integration and language-support. The VS Code marketplace is enormous and filled with high-quality plugins from Microsoft and many third-party vendors.
The official Kubernetes plugin is feature-rich. This extension has all the basics, such as viewing and editing cluster objects, accessing logs, and running a remote shell. It also contains a few more advanced features such as browsing Helm repositories, port forwarding, and remote container building/execution.
If you happen to be using the Azure Kubernetes Service for running your Kubernetes cluster, two new plugins may be of particular interest to you. The first, Bridge to Kubernetes, enables you to run a local application on your machine within the cluster’s network perimeter, potentially allowing you to create a local development and debugging environment. The second is the Azure Kubernetes Service (still in preview), which offers a more profound integration with AKS clusters.
With the thriving VS code marketplace, there are many other relevant plugins. For GCP users, an appropriate plugin with a Kubernetes integration is available. Unfortunately, the AWS plugin for VS Code deals mostly with Serverless workloads and only has minor support for Kubernetes. Going through the marketplace, you are likely to find many more niche plugins, some of which might support other tools you happen to be using.
You might also want to keep track of the launch of Github Codespaces. Codespaces will empower you to migrate your development workload to the cloud in a (hopefully) seamless manner. It’s not Kubernetes focused yet, but I’m sure that day is not too far down the road.
Gitpod with Kubernetes
Gitpod is a new IDE taking a cloud-first approach to cloud-native development. When using Gitpod, you are getting a VS-Code-like IDE (based on Theia) accessible from your browser. Any task you will execute, such as building and running applications, will be performed in a remote Kubernetes cluster.
The UI looks and feels very much the same, and you get access to any VS Code compatible extensions. In addition to classic IDE capabilities, Gitpod adds collaboration features such as sharing live development environments, taking static snapshots of environments, and code review.
Gitpod is all about optimizing the developer’s experience and making it as smooth and fast as possible. As part of that mindset, Gitpod will spin up as many environments as you may need, and allow you to easily switch between them. Gitpod will even work with multiple environments simultaneously. Gitpod employs various performance enhancement techniques such as prebuilding environments, offering a Chrome extension, and optimizing development environments deployed to Kubernetes.
Gitpod is still very young and may not be mature enough for you. It offers an intriguing alternative, especially for those who don’t want to rely on spinning up complex or resource-intensive development environments locally. Get started by refixing any GitLab, GitHub, or Bitbucket URL with gitpod.io/#.
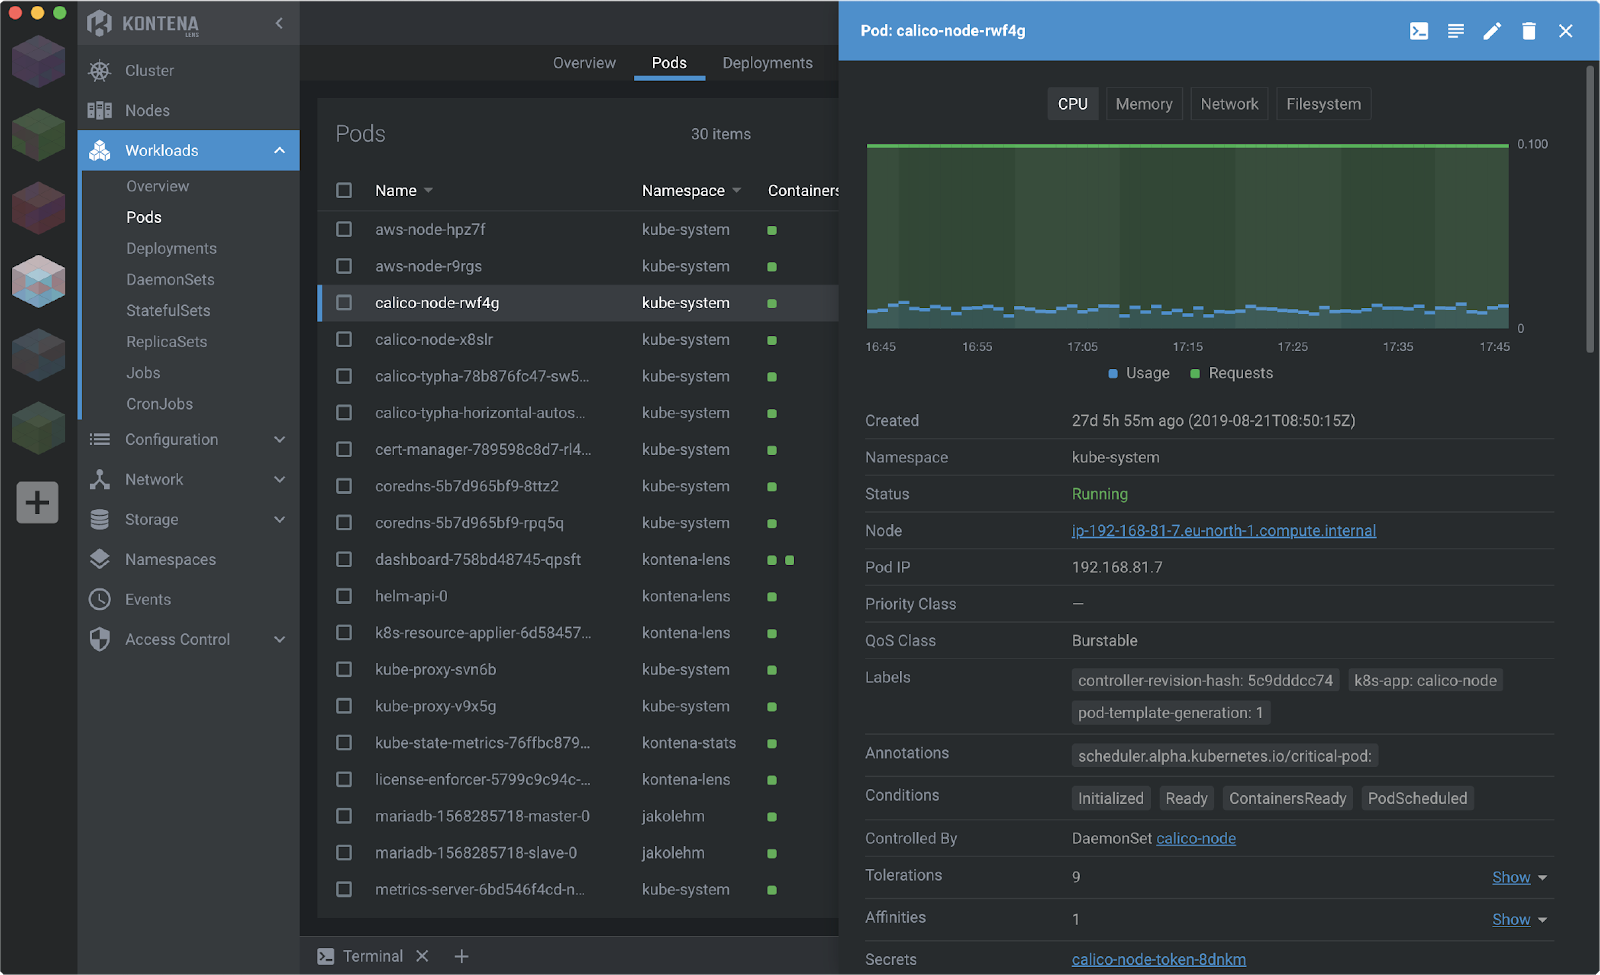
Lens for Kubernetes
For some of us, hearing the phrase “IDE for Kubernetes” brings to mind the image of a feature-rich interactive UI that allows us to see anything and do anything with our Kubernetes clusters. A kubectl on steroids. If that’s you, you will be happy to find Lens.
Lens is a standalone application that allows you to connect to your Kubernetes clusters and manage them on the fly. Lens will enable you to go through and update every type of Kubernetes object, including workloads (i.e., deployments), configurations, networking, storage, access control, and even custom resources. It is designed from the ground up to work in a multi-cluster environment and makes it an intuitive process. It even has built-in Helm support, allowing you to browse through repositories for available Helm charts, and see which charts are deployed on your cluster.
However, it’s important to note that Lens is not an IDE in the traditional sense. You will not be using it to create and edit source or configuration files. You will not be using it to build, execute, or debug your application. Lens is all about giving you full visibility and control over your Kubernetes clusters.
Summary
An IDE is an integral part of every software engineer’s daily workflow. When it comes to cloud-native software development, you have a couple of options:
Stick with a traditional IDE, relying on plugins and third-party tools to bridge your workflows over to Kubernetes.
Switch to a cloud-first IDE, one built from the ground up to provide a cloud-native and Kubernetes focused experience.
If your engineers are anything like any developer I have ever worked with, they already have a favorite IDE that they stick to religiously. Hopefully, by introducing them to some cool, sexy, new IDEs – with the added benefit of solving Cloud Native challenges they face every day – they may take your suggestion into consideration. My two cents here is that it’s usually better to empower team members to choose their tools or offer them a few alternatives rather than force a uniform, one size fits all, solution.
If you have been keeping track, I recently started a series of blog posts about the state of developer tooling in the Kubernetes ecosystem in 2021. The first blog post covered the topic of defining Kubernetes applications, i.e., how you go about declaring, packaging, customizing, and deploying them. You can check out that up-to-date comparison between category leaders Helm and Kustomize right here.
In that previous blog post, I also mentioned another tool – Skaffold. While Skaffold has limited ability to define Kubernetes applications and build and deploy them in CI/CD pipelines, it’s core functionality is creating a development environment for Kubernetes. In this blog post, I’ll discuss the alternative tools of doing just that – spinning up a development environment on Kubernetes. So let’s go into an in-depth comparison of Skaffold, Tilt, and Garden. I will not be covering Microsoft Draft, as the Github repository appears to be archived and has had no new versions in 2020.
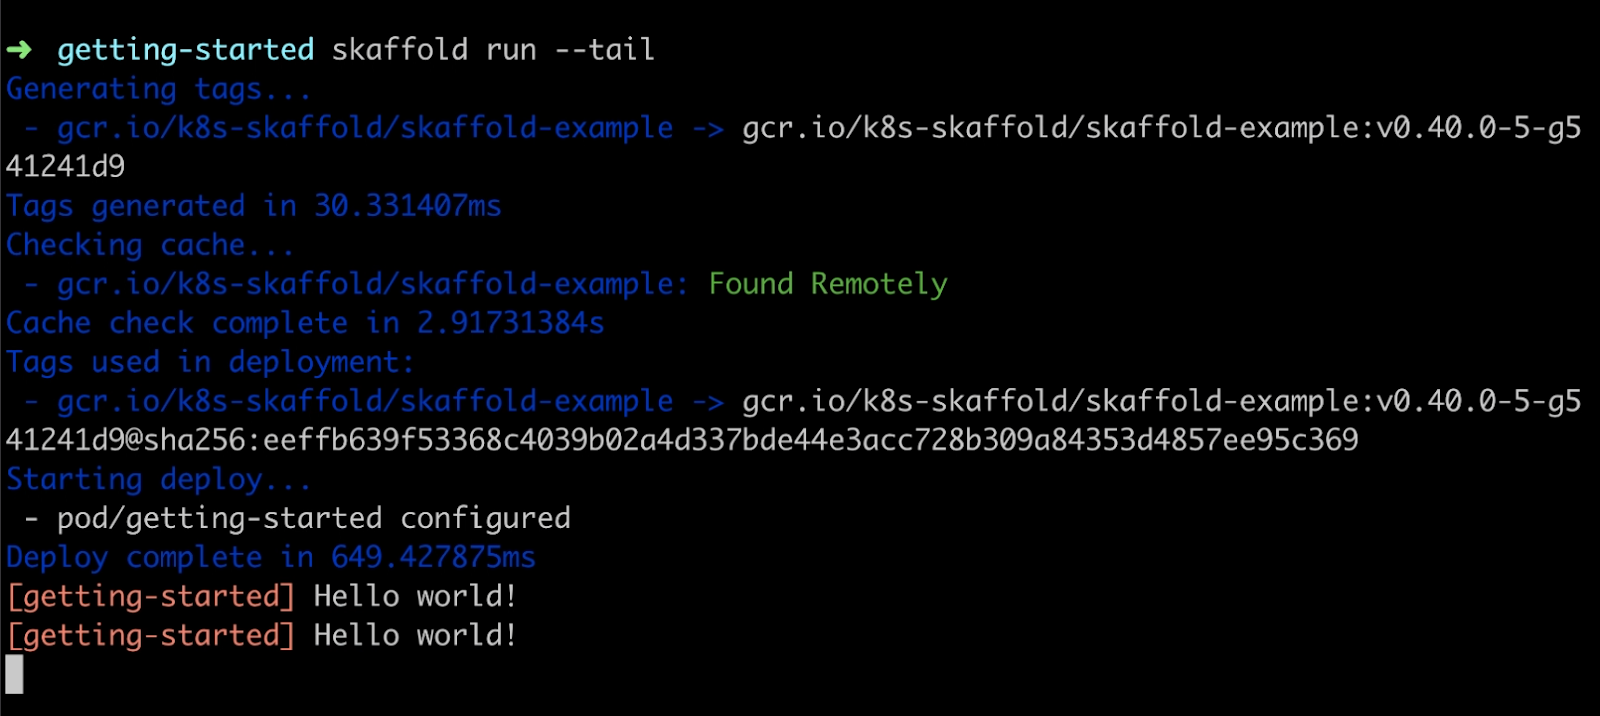
Skaffold for Kubernetes
Skaffold is an open-source CLI tool by Google. Its main selling point is a unified approach for building, pushing, and deploying your Kubernetes applications for dev workflows and CI/CD pipelines.
To configure Skaffold, you use the somewhat intimidating skaffold.yaml. Here’s a simplified outline of what the workflow looks like:
Watch – Skaffold watches your source code directories for any changes and then triggers the pipeline. This stage doesn’t apply when running in CI/CD mode.
Build – Skaffold builds the container images for your application. This stage is where many useful features come in:
Skaffold supports various configurations, including Dockerfile, jib, Buildpacks, Bazel, and even custom scripts.
Skaffold can run the build process locally, on the remote Kubernetes cluster, or Google Cloud Builder.
Skaffold will tag your images automatically based on configurable policies.
Skaffold may skip the build process and directly sync source files to running containers where appropriate.
Deploy – Skaffold binds the Kubernetes manifests for your application with the appropriate container images and deploys them to a local or remote cluster. Here you can use Skaffold’s built-in minimal templating mechanism, Helm, and Kustomize.
Execute – Skaffold monitors the application’s pods post-deployment per your specification. The highlights here include logs tailing and port forwarding.
What’s new with Skaffold?
As powerful as Skaffold can be, getting it up and running with simple configuration can be an intimidating task to the uninitiated. The Skaffold team has been hard at work on the skaffold init command to get new users over the hurdle. When using this alpha feature, Skaffold will search your repository for build configuration files such as Dockerfile and pom.xml. It will then create a default configuration file that should get you up and running in seconds.
Additionally, Skaffold has added built-in support for integrating with traditional debuggers via the (beta) skaffold debug command. When used, Skaffold attempts to configure the application runtime for remote debugging automatically. While this is a neat feature, using traditional debuggers in a microservices environment is tricky at best, especially when working with remote clusters. If you are having trouble with that, we highly recommend you check out non-breaking debuggers such as Rookout.
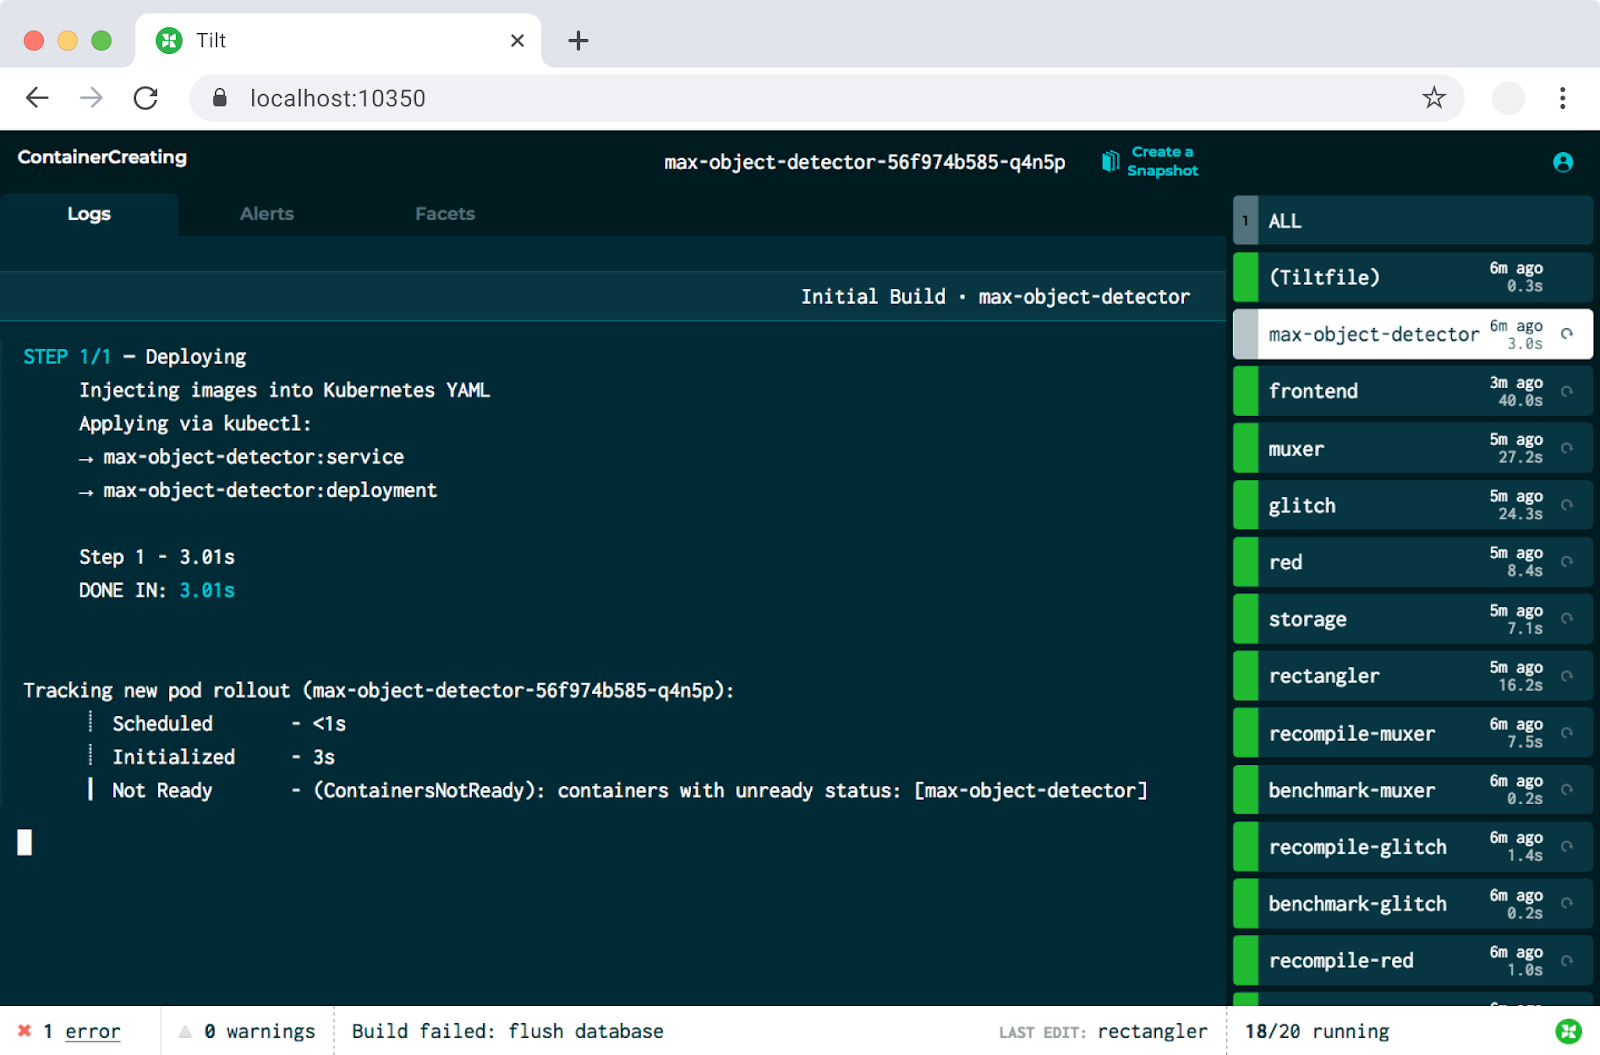
Tilt for Kubernetes
Tilt, a commercial open-source offering by Windmill Engineering, takes a different approach, focusing on creating the best developer experience. Tilt doesn’t settle for a simple CLI tool and provides a powerful web-based UI to give you detailed feedback on everything that is going on behind the scenes. Tilt web-UI will allow you to navigate each of your services’ health status, and their build and runtime logs, among other things.
Configuring Tilt takes place via a Tiltfile, written in a dialect of Python called Starlark. Getting started with Tilt is a painless experience, and your first Hello World application Tiltfile will probably only be 3-5 lines long. When you want to get fancy, features such as manually controlled updates, remote builds, Helm charts, and manual update control are all there for you.
Like any commercial open source software, Tilt also has an enterprise edition. If you require vendor support or have more complex requirements, that may be worth checking out.
What’s new with Tilt?
In the Kubernetes ecosystem, it often seems that Windows is shunned, regardless of Microsoft’s progress with the open-source community, not to mention the fantastic work they have been doing with WSL. Well, Windows is still the most common operating system on this planet, and if you or someone on your team happens to be using it, you’ll be glad to learn Tilt has released support for Windows in 2020.
Another prominent feature you might find interesting is a new plugin mechanism known as Tilt extensions. Check out publicly available Tilt extensions from this Github repo, or consider writing an extension yourself to enhance your Tilt experience. By the way, we have been wondering about adding a Tilt extension for Rookout, so feel free to give us a shout if that’s relevant.
Last but not least, Tilt has released a SaaS service known as Tilt Cloud to improve team collaboration even further. Tilt Cloud’s first feature is Snapshots, which allows you to share your live environment state with a team member to get his feedback. Check out an example of that right here.
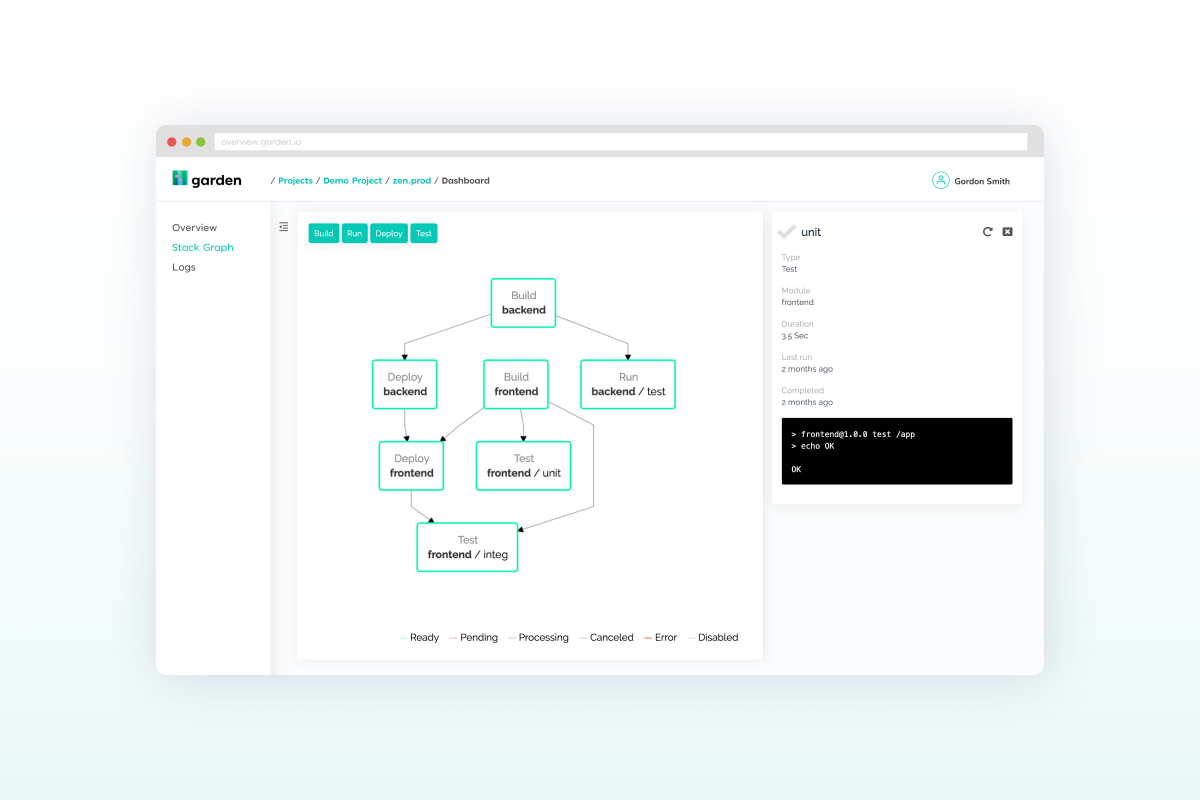
Garden for Kubernetes
If you read through Tilt’s docs, you will see they are great proponents of local deployment of Kubernetes applications during development. However, Garden’s team are firm believers in the opposite approach – you should always deploy to a remote, production-like cluster. If you are still debating what process works best for you, we have discussed the pros and cons of going local vs. going remote in the past, so please check it out.
Garden is a commercial open-source tool for “development automation.” Garden spins up Kubernetes applications in a (remote) cluster for development, automated testing, as well as manual testing and review.
Garden allows you to get started by using CLI helper commands such as garden create project. You will manage the Garden configuration through a graph of YAML configuration files. That’s a very flexible and modular approach, but it will require a bit of learning on your part. The key elements you will define in those files include:
Modules – Modules serve as Garden’s unit of building. Here you will specify how to build your containers.
Services – Services serve Garden’s unit of deployment. Here you will define how to run your containers on Kubernetes.
Tests – In Garden, tests are first-class citizens. There’s built-in support for both unit tests as well as integration tests.
Just like the other tools in this review, Garden has its own set of advanced features such as templating, predefined tasks, custom workflows, and more.
To achieve the best results, Garden recommends deploying a Garden service into a shared cluster. Once that’s up and running, Garden will spin up two types of environments:
Each developer will spin up a development environment based on the source code he has checked out on his laptop.
The CI will spin up environments for testing and review for every PR in the relevant repositories.
What’s new with Garden?
In mid-2020, Garden announced their Enterprise product, a commercial offering of the Garden product. The key features include central management, provisioning of users and secrets, and direct integration with Github and GitLab. If any of those features seem essential to you, the enterprise version may be the way to go.
Overall, Garden is the youngest of the three tools, with the company behind it (also named Garden) announcing their seed funding round in November 2020.
Summary
For software engineers adopting new technologies such as cloud-native, the question is always the same: how can I test my code while I’m developing it? And trust me, expecting every developer in your team to be a Kubernetes expert is not the right way to go.
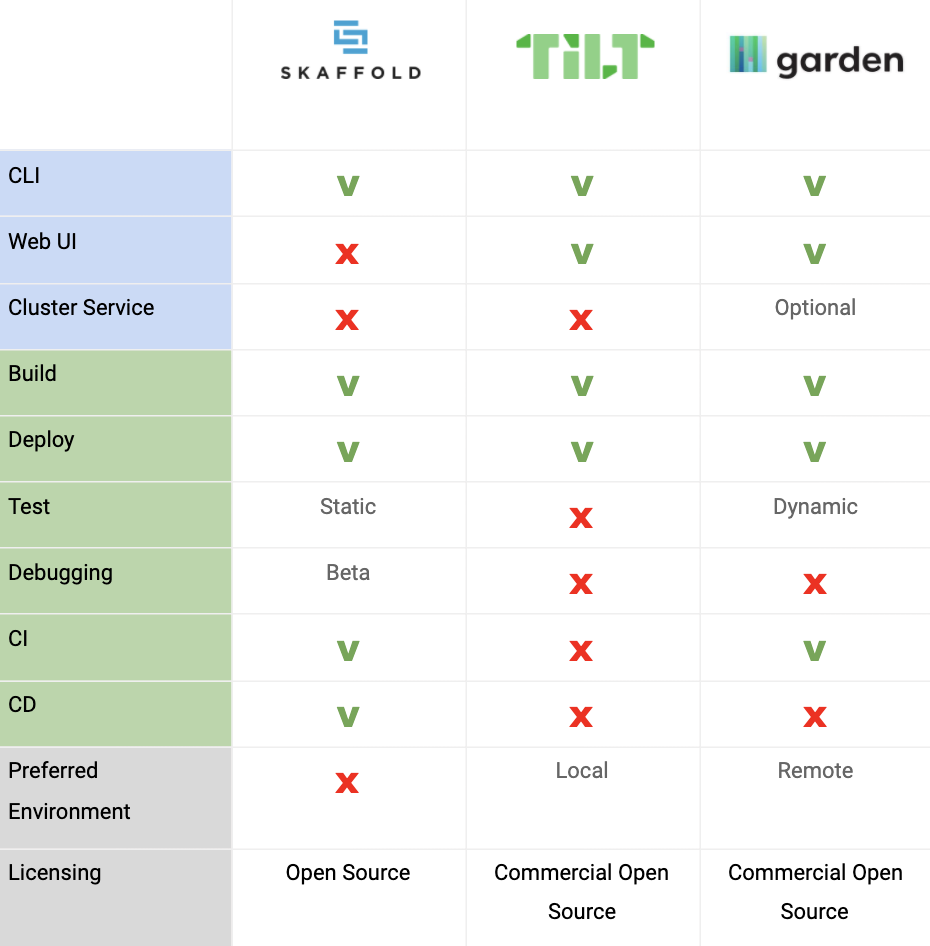
Each of the tools described in this blog post will provide your engineers with a shareable, consistent, easy to use, method to spin up their development environment. Those are all excellent choices, each with its pros and cons, and the right option for you will probably depend on your unique needs. To make your choice a bit easier, check out this quick comparison chart:
Regardless of which development workflow tool you end up choosing (if any at all), keep in mind that debugging in a (remote) microservices environment is far from a trivial task, so make sure to pick up some non-breaking breakpoints.
Take a look at your application as it runs on your server or the cloud. You’re so proud of it. Admire it as it’s processing data, interacting with the user, and doing magical things. You should be very proud of it- you wrote a lot of code to make it happen. But, honestly, how much of the code in your application is your code?
You know the answer. Most of the code making the magic happen is third party code, whether that means an npm package you’ve added to handle the JSON parsing, the libraries you use as a part of the runtime, or maybe even you’re running your Java application in JBoss. There is a ton of code that other people wrote, and you’ve added that code to your application or trusted that code to manage your application. But what happens when you have a bug in that piece of code that someone else wrote? How can you debug that which isn’t yours?
Using other people’s code
Looking back 20 years to when you had to write an application, you had two choices. Either you would need to write most of the code yourself or try to scavenge for libraries or open source implementations of what you needed. Since then the open source movement – and with it the world of package managers – has made a giant leap. Nowadays, when you need to perform a certain task in your application or use a framework, the first thing you do is go to your package manager. From veteran tools like the Maven Repository up to the newer ones like npm and pip, you’ll find these package managers everywhere. Installing the package that takes care of business is just a command line away, or even just an edit of a json or xml. In some big enterprises, a different department or team might have even developed a package that you use but are reluctant to share their source code. Even if you don’t explicitly use third party packages, you might eventually run your application on a PaaS such as AWS Lambda or App Engine and your application will be invoked and run by man-made code.
Nobody’s perfect
You might not be aware of it, but the first thing you do when you decide to use someone else’s package or code is to trust it. You wouldn’t install a tire on your car from a manufacturer that you don’t trust, right? You’d want that tire to not melt when it is too hot and not slide when the road is wet. The same logic applies to third-party code. You wouldn’t want it to crash your application or create random unexpected behavior (aka ‘a bug’).
Of course, when you encounter a package that has been downloaded by only a handful of developers or has a repository that isn’t maintained, you’ll likely get suspicious. Yet, when you see a package with a vibrant community and millions of downloads, odds are that you’ll blindly install it. Other times, you might even be forced to use it, as your team might be required to use another team’s package. Whether it be that million of downloads package, or that package that was outsourced abroad, there’s always a chance that it might be buggy.
Yes, you read that right. Even software that has that perfect CI/CD process and hundreds of contributors might be buggy. Or maybe it isn’t buggy, but its API’s documentation is outdated and you’ll end up using it wrong. So what are you going to do when you understand that something just isn’t right about that piece of software?
The blame game
In one of my previous roles, I had the chance of managing what I call a ‘code monster’. This developer was a talent. He wrote amazing code and was a self-proclaimed ‘bugless coder’. At the time, he was writing some complex code for Android, and every time he delivered code that had issues his explanation was: “it wasn’t me, blame Google, they have bugs”. To this day I don’t know whether he was right every time, but I still can’t figure out why he blamed Google. Maybe it’s because he wasn’t using the API properly? And how come he was so confident that the Google developers’ code wasn’t perfect…but his was?
When your application seems buggy, the first thing that you do is start debugging your code. Maybe you’ll re-read your code, add tons of log lines, spin up your application locally and attach a debugger, or maybe even debug remotely like a rockstar with Rookout. However, there often comes a time in which everything seems perfect in your code and you start blaming ‘the other guys’. You tell yourself, “My input to that function is exactly as it should be, but that function keeps outputting nonsense”. In some languages, like Python and Javascript for example, that third party code is usually accessible. You can basically treat it as your own by placing breakpoints with your IDE’s local debugger or even fork it and add custom logs. But debugging those third party codes in compiled languages such as Java and .Net, or even debugging JavaScript’s and Python’s third parties remotely, in production, might be a nightmare.
Non-breaking breakpoints without source code
If this is the first time you’ve heard about Rookout, then let me give you a TL;DR about what we do. We allow developers to place non-breaking breakpoints in their applications in any environment, on-demand. This lets them collect data from the application as if they were using a debugger without pausing or hurting their application’s performance. You tell Rookout to give you a snapshot of the application’s data when the code in file X at line Y triggers and Rookout does it. Rookout collects the local variables, function arguments, tracing data, call stack, and whatever is asked from it to collect. This works amazing with your own code, because you know your code best, and as such from which file and which line you’d like to collect the data.
Rookout’s technology doesn’t really care about the code itself. As far as we care, we can pretty much ignore it. All we really need in order to collect data for you is the file name and the line number and with that, the rest of the magic happens. But how will you know where to point Rookout to collect when it comes to third-party packages that you don’t have the source code, or, if you do have the source code, but don’t have the right revision? You can either try to decompile or simply to guess, as some of our customers do. We decided that we don’t want the task to be so difficult, we wanted to allow you to collect data from other pieces of code as easily as possible.
Giving you a glimpse into the darkness
When our customers told us that they needed our help to debug those third-party packages, we immediately tried to understand where the right place is for them to begin their debugging. We’ve definitely pondered and considered bundling a decompiler with Rookout’s Desktop Application but sometimes that’s too much of a hassle for the user. We also thought about trying to automatically detect and fetch the source code of open source packages, but that only solves the issue for open source scenarios. Eventually, our solution came from asking ourselves where we can pinpoint the places in which we definitely know where the third-party code is executed for our users and where that code has interaction with our customer’s code. That place is the good ole call stack. When you are looking at a call stack (or a stack trace), no matter where it is, you’ll see the code’s execution flow, and it doesn’t matter if that code is yours or not. When you don’t have source code, the light into that darkness can be the stack trace.
Follow the yellow stack trace’s brick road
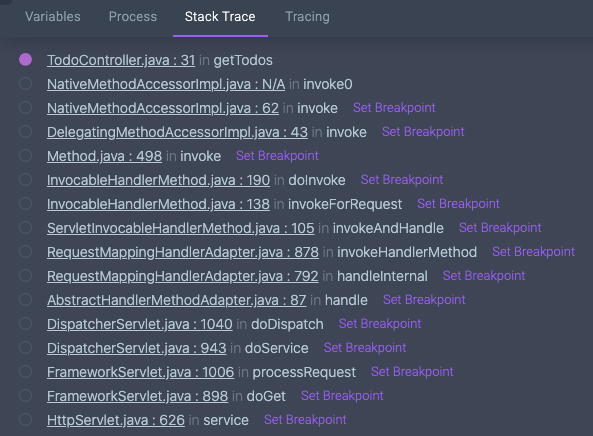
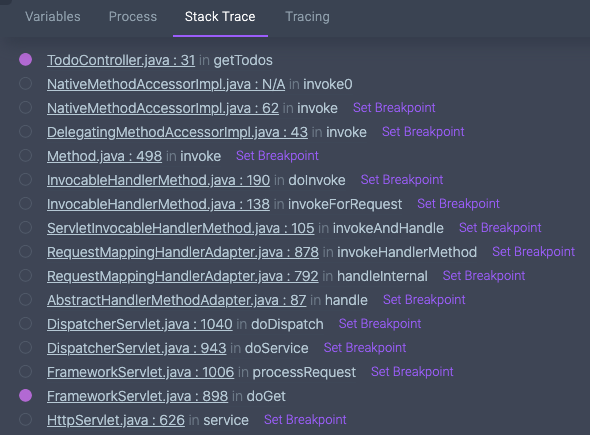
Let’s take a look at an example stack trace of one of our Java Spring demo applications:
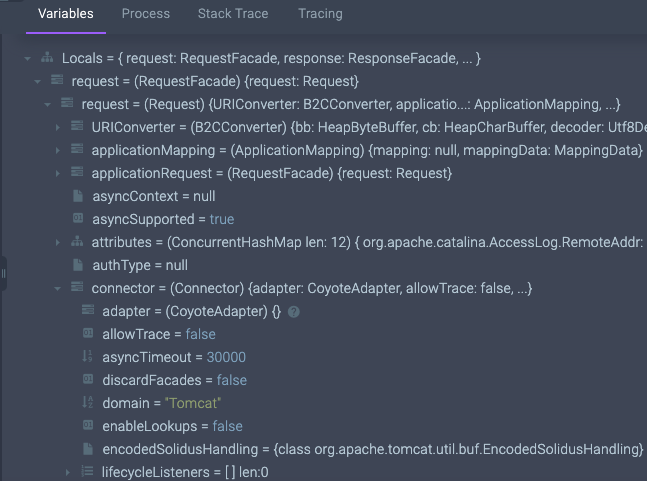
I have a breakpoint set in TodoController.java. I know that that’s my code. Let’s say something isn’t working correctly and I want to see what happens before my code executes. What is all that other stuff in the list? What happens in FrameworkServlet.java in the doGet method? Well, that’s no mystery. I can simply click on “Set Breakpoint” and Rookout will place a breakpoint in that spot for me. I don’t need the code, I just need to look at the information collected from that method.
And now, once we have a breakpoint, we can take a look at the data Rookout had collected for me when that method is executed next:
Check it out, I can see the values of locals and arguments in that method, such as URIConverter, ApplicationMapping, and more. These are objects that my web server’s framework is using. I don’t need access to the code in order to get a glimpse into the information the code processes.
Traveling up the stack
Placing breakpoints up the stack isn’t only for debugging other people’s code. We’ve heard our customers ask us to collect all the locals and all the arguments up the call stack once they place a breakpoint. Collecting all that information is very valuable, yet we limit ourselves to collecting variables only in the local scope of where our user places the breakpoint. Our main concern for our customers is to not affect their applications’ performance. Rookout is used as a surgical tool for your code. It collects data in order to solve a specific problem and thus only the information that is needed is retrieved. Collecting too much data can hurt performance. Placing a breakpoint up the stack allows our users to iteratively choose the places where they want to collect the data, making wider data collection possible, but still not blindly and irresponsibly collecting everything.
Good luck in your journey
Debugging code up the stack is open for all of our customers, so go ahead and give it a spin You will find that you will now have a powerful tool that will shed light into those areas that you’ve considered a black box until now.
In a recent blog post, one of my teammates, Josh, shared a few techniques for deploying Java agents in Kubernetes applications. We have been getting a lot of interest in the concepts we have shared and, per popular request, decided to raise the bar. Is it possible to add a Java agent without changing a single line in either the Dockerfile or the Kubernetes Manifest? Well, the answer is most definitely yes (!), and here’s how.
In case you are not familiar with them, Java agents are jar packages used to instrument a Java application. Java agents empower tools such as Rookout and APMs to provide insights into what’s going on in a running application. You add a Java agent in an application using the JVM flag -javaagent (read more about it here).
Quick Recap
In that previous blog post, Josh demonstrated how to edit an existing Kubernetes application manifest to add a Java agent.
The first step is to add an init container that will add the Java agent jar file to the pod’s filesystem. The second step is to add the JAVA_TOOL_OPTIONS environment variable with the -javaagent flag, instructing the JVM to load it. The final manifest will look a bit like this:
The final step is to create the container image for the init container that will add the Java agent to the pod’s file system. I have created a Github repository for your convenience and made the container image available on Docker Hub.
How can we do it without changing the manifest?
Using the technique mentioned above, all we have to do to install the Java agent is to add a few configuration options to the Kubernetes manifest. Unfortunately, that means we need to either change or fork the upstream manifest file.
For some of our customers, neither of those choices is appropriate, and that’s where Kustomize comes in. If you are not familiar with it, Kustomize adds, removes, or modifies Kubernetes manifests on the fly. It is even available as a flag to the Kubernetes CLI – simply execute kubectl -k.
For this example, we’ll be using Arun’s open-source Hello World Java application. For simplicity, I have taken the Kubernetes manifest, upgraded the APIs for the latest Kubernetes version, and made it available here.
We start by creating a kustomization.yaml file, the root of Kustomize based deployments. The file is relatively short and straightforward and comprises a reference to the application manifest, the patch to apply to insert the Java agent, and a secret generator for the token. Here it is:
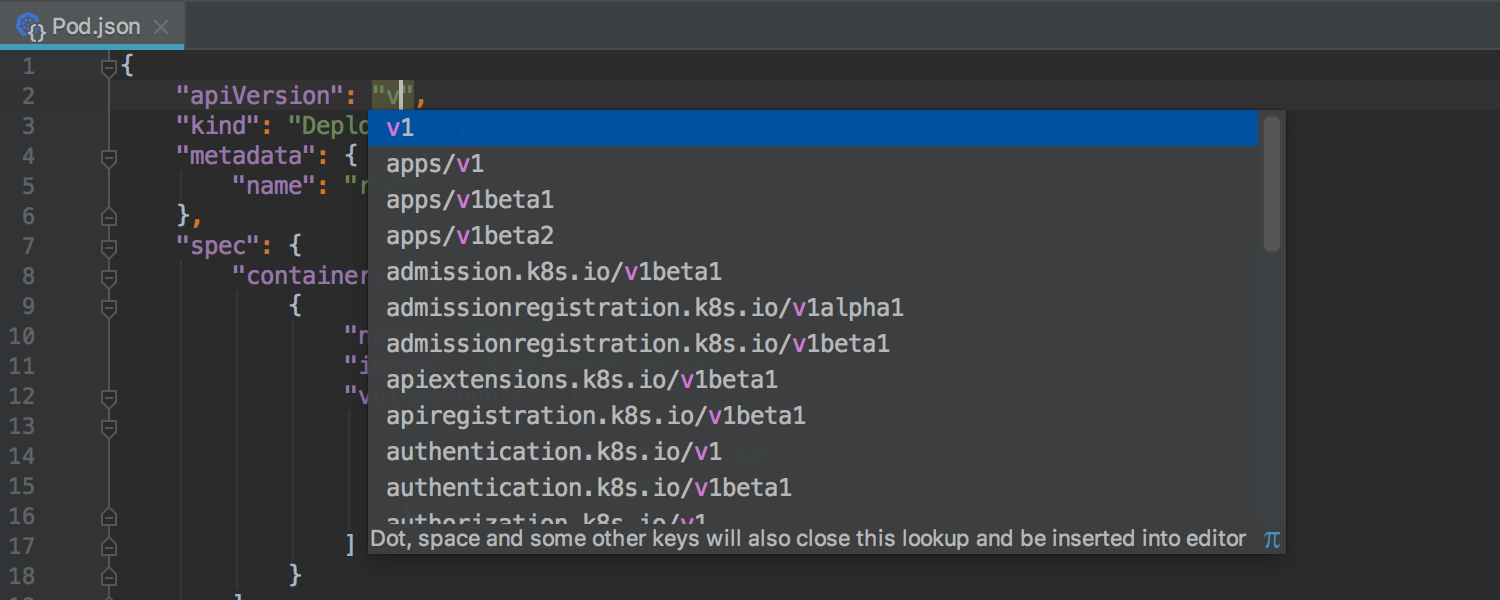
apiVersion: kustomize.config.k8s.io/v1beta1
kind: Kustomization
resources:
- deployment.yaml # This is the original application we are deploying
patchesStrategicMerge:
- java-agent.yaml # Here, we add the Java agent
secretGenerator:
- name: rookout
literals:
- token=<ROOKOUT_TOKEN> # Create any secrets the Java agent needs
Now we have to write the Kustomize patch itself. The patch has to take care of the following tasks:
Mount a shared volume in the application pod.
Set the needed environment variables in the application pod.
Add the init container that will place the Java agent jar in the shared volume.
Create the shared volume itself.
Here’s the final patch:
apiVersion: apps/v1
kind: Deployment
metadata:
name: hello-world
spec:
template:
spec:
containers:
- name: hello-world-pod # Edit the main application container
volumeMounts:
- mountPath: /shared/java-agent # Mount the directory where the Java agent will be available
name: java-agent
env:
- name: JAVA_OPTIONS # Instruct the JVM to load the Java agent
value: -javaagent:/shared/java-agent/rook.jar
- name: ROOKOUT_TOKEN # Make the token available as an environment variable
valueFrom:
secretKeyRef:
name: rookout
key: token
initContainers: # Add an init container that will drop the Java agent to the shared volume
- name: init-agent
image: rookout/add-java-agent:latest
volumeMounts:
- mountPath: /shared/java-agent
name: java-agent
volumes: # Create the shared volume
- name: java-agent
emptyDir: {}
Set the Rookout token in the kustomization.yaml file
Deploy the application by running kubectl apply -k kustomize
What about Helm?
At this point, you might be wondering, that’s a powerful approach, but my team does not use kubectl apply. We are using Helm, the Kubernetes package manager, to define, publish, and install our applications. And in the past, using Kustomize in addition to Helm has been quite cumbersome.
If that’s the case, I have some fantastic news for you. The release of Helm v3.1 in early 2020 changed that. Helm’s post rendering feature allows us to run Kustomize on a fully rendered Helm chart just before deploying it.
For this example, I’ll again use Arun’s Hello World application. He has kindly built a Helm chart, which I have updated for the latest version of Kubernetes and placed here. To migrate our existing Kustomize configuration to work with Helm, we have to do just a handful of steps.
First, we have to install Kustomize as a standalone application and place it in the PATH. Second, we need to mediate between Helm, which writes to the standard output, and Kustomize, which expects to read everything from a file. Finally, we need to create our Kustomize configuration. As it turns out, we can use the same configuration, so we just copy it to our working directory.
The final script looks like this:
# !/bin/bash# save incoming YAML from Helm to file
cat <&0> kustomize/deployment.yaml
# Copy our original Kustomize config
cp ../kustomize/kustomization.yaml kustomize/
cp ../kustomize/java-agent.yaml kustomize/
# modify the YAML with kustomize and print it to the standard output
kustomize build kustomize
rm kustomize/*.yaml
Now, all we have to do to install the Helm chart with our Java agent is to run:
Installing a Java agent is one of the most basic tasks when developing and operating Java applications, and moving to the cloud-native ecosystem doesn’t make it any less significant. Installing those agents by changing the container image is a relatively simple process but has multiple drawbacks. For many of our customers, installing Java agents has traditionally been the operations team’s responsibility, and that’s where it should remain.
In this blog post, I have shared an alternative approach to installing Java agents in existing applications, at deployment time, without requiring any upstream changes. I hope you’ll not only find it useful but benefit from a deeper understanding of a few of the building blocks I have shared with you.
It is no coincidence that “looking for a needle in a haystack” is a popular debugging metaphor. When a single missing `;` can cause problems, and you must go through hundreds and thousands of code lines to find it. That’s when the metaphor becomes all too relevant. So what happens when the problem is a bit trickier than a missing semicolon? When you need to print thousands of log lines just to try and trace it. Or, alternatively, you set a breakpoint and step-by-step your way to the root cause. That’s when the frustration behind this metaphor truly comes to life.
Now, what if we take the needle in a haystack metaphor even further? One could say that debugging cloud-native apps is like going through multiple haystacks that keep on moving. Only this time, you’re trying to figure out if the needle even exists. Of course, we’re probably overusing that metaphor. So maybe it’s time to break it down and replace the old-fashioned problem with a more up-to-date solution.
Who built these Haystacks anyway?
Some of the things that motivate us to build cloud-native apps are the very same things that make debugging these apps such a challenge. We build cloud-native apps so they can easily scale up and scale out. When user traffic is high, or when we need to process a big batch of data, we spin up additional, bigger boxes. Then, when things go back to normal, we tear these boxes down and revert to our smaller-sized machines.
We break our cloud-native apps into microservices to simplify our development, testing and deployment cycles. This ability to dynamically spin up and tear down cloud instances allows us to work on each service separately. It allows us to add features and fix issues in a single box without breaking the other boxes. But what does it mean when we try to debug such an application?
Stop moving my Haystack
The fact that instances are deployed and torn down dynamically means there is no app or process we can “attach” to in the traditional debugging sense. We have learned to live with the fact that the only way around that is adding tracing capabilities. We have accepted that we have to invest significant coding time and CI/CD cycles just to print too-many-logs. Logs we later have to sieve through, logs that impact our app’s performance, logs that take up cloud storage.
Then, there’s the fact that we broke our app into microservices which means we now struggle with new debugging challenges since our code is spread over multiple repositories. Each repository keeps shifting independently of the others, as we intended and worked very hard to achieve. But when we try to debug an app born of these multiple, ever-changing repos, things turn into a nightmare. Which code version(s) should I be looking at? Can I trust that adding a breakpoint or printing a log line will have the wanted result? Especially now that I’m not sure which code version is running in my test/staging/production environment.
Surely, there must be a more elegant solution to the problems I introduced by adopting the previous elegant solution.
Which Haystack should I start with?
One of the first steps towards efficiently debugging or logging a cloud-native app is flipping your perspective. Instead of zooming in, trying to attach to a single process, or printing logs on a specific code version, you may first want to zoom out. Remember: your app is running with multiple instances and code versions, and both are constantly shifting.
Start with looking at a thousand seemingly identical Kubernetes pods, then pick the ones that may be relevant to the problem you are trying to troubleshoot. Can you tell them apart by their environment label? Their app or process name? Or by their age or commit id? Can you pinpoint a specific box where the issue reproduces? Or pinpoint a characteristic that makes the bug more likely to happen?
Coarse grain filtering, zooming from the outside-in. [Rookout Projects and Filters]
That’s the approach we took when we first introduced Rookout Projects and Filters. Start by looking at every running instance of your application. Then, when you have a clue where the root cause of the issue is, start zooming in on the right haystack. Rookout will also make sure to track the right commit version for you.
This means that the next non-breaking breakpoint you set, or the next log line you add will only apply to the right subset of instances. This will make going through debug messages and log lines more efficient, both for you and for your log aggregator.
Sharpening the good ol’ needle
Now that we’ve narrowed down our search, it’s time to go back to basics. Set a non-breaking breakpoint, add another log line in a matter of seconds, and keep drilling down in search for the problem. But even after we’ve narrowed the search to a few dozen boxes or even one specific customer tenant, it is far from over. We’re down to one haystack but we still need to find that needle.
Some of the problems we have when debugging a local monolith still apply here. We may be iterating through the same code snippet hundreds, thousands of times before the issue reproduces successfully. Maybe it has something to do with specific data dependencies. Maybe it’s a configuration setting that affects app behavior. When debugging locally, this is where we would have used the good, old-fashioned conditional breakpoint. Wake me up when X is null or is a negative number, or when it’s a string that contains the substring “needle”.
Fine grain filtering: Conditional breakpoints for a new generation of apps.
Making the needle bigger
That was the use case we had in mind when we started working on conditional breakpoints, which we recently introduced into our product. We first introduced the feature to a couple of our customers and design partners. That’s when we learned that this “bread and butter of debugging” feature actually takes on a new form when it comes to debugging dynamic apps. In some cases, it helps our customers do a fine-grain filter to a smaller, dynamic subset of instances. Set a condition to only trigger the non-breaking breakpoint for a given hostname or tenant ID.
For our customers who use Rookout for debugging their production environment, this has another important benefit. By fetching debug data and printing log lines only for hand-picked instances, they guarantee an even smaller performance impact and only a negligible number of unnecessary log lines.
Searching for a new metaphor
As the dev community transitioned into a cloud-native mindset, we shifted our perspectives and adopted some new metaphors. We left step-by-step debugging to local environments, in favor of adding as many log lines as possible and tracing the issue with our log aggregators and APM dashboards. But as the Cloud and DevOps tool ecosystems keep on running forward, new solutions like Rookout allow us to shift our perspective again.
In some cases, you may solve the same problems in a more effective way. Keep adding log lines, but with a click of a button reduce the time and effort required by adding logs. Then, add log lines only for the right subset of environments, applications, and instances.
In other cases, you may find that some of the assumptions you’ve made as you took on the cloud and DevOps challenges, may be re-examined. You can add non-breaking breakpoints, fetching full debug data just as if you were debugging locally. Plus, a new take on conditional breakpoints helps you make sure you only get the relevant debug data.
So if you’re interested, reach out and get an early taste of the brand new conditional breakpoints. And we’ll keep looking for new ways to solve your debugging challenges, as we try to come up with new, more relevant metaphors.