Rookout is now a part of the Dynatrace family!

Table of Contents
Get the latest news

The Anatomy of a Dev Team

Tal Koren

8 minutes

Table of Contents

A team of developers comprises several roles, with each contributing their own unique addition to the mix. Sometimes, it feels quite similar to every TV show ever about a slightly dysfunctional group of friends, (cough Friends, IT crowd, silicon valley cough), with each developer adding their own particular touch to not only the product, but the company vibe itself. They are each crucial to the success of the team, contributing their special talents and abilities and ensuring that the team runs smoothly.

But what happens when an issue presents itself? Take for instance a situation where you get a certain piece of data from your backend, but this data is incorrect and/or misleading. It looks just as you’d expect it to, but it does not reflect the real state of your app. Depending on if and when your users notice it, this could be the difference between loving and embracing your product, or (the horror!) neglecting it for a competitor. So let’s go on a virtual game of ‘Guess Who’ and see who’s who of the dev team.

The dev team leader

The developer who is The dev team leader is often the one who has a holistic view of most things. This is the dev who reads code thoroughly, understands what it does, and avoids getting distracted (a small miracle!) by directed attention fatigue. This dev also communicates efficiently with the rest of the team to understand possible problem domains, draws control flow diagrams either mentally or physically, knows where to set logs or breakpoints as a result – and finally uses all of those to solve the issue.

When confronted with a problem – and even more so a problem related to misleading data – these are the steps that are likely to be taken by every team member. Yet, the Leader type is different, as they innovate and inspire others, but aren’t necessarily the team’s manager. Their ability to understand independently, and communicate the difficulties, challenges, possible solutions, and causes of the problem, is what makes them the maestros of the orchestra that is the dev team.

Depending on whether they are free or busy, they might choose to delegate the issue to the relevant team member or two, or just use their remarkable problem solving skills to do it themselves.

The Paranoid

We all know this dev. They’re absolutely certain that everyone is out to get them. If they work on microservice X and get corrupted data, then it’s surely microservice Y or Z that’s causing the issue (of course totally unrelated to them ). The Paranoid sets logs everywhere, which satisfies their need of feeling protected. As an added bonus, they also curse a lot – it could possibly be the multitude of log lines they’re now sorting through, but hey, don’t ask us- and carry a cup of coffee with them wherever they go. Are the two related? We’ll let you decide.

This is the dev who’s mostly quite good at what they do; they know how to make connections between problems and their domains, they know the majority of the system’s components even if they don’t work with all of them on a daily basis, and they are great mentors and problem solvers.

When it comes to data that is incorrect or misleading this dev goes nuts. They spray 15 different log statements in every file that calls a function that might have the slightest chance of affecting our data handling procedure. They somehow manage to pass a review or might be forced to remove a useless log line or two, leaving “just” 13-14 other log statements. They deploy to production.

When the data from the production environment arrives – it’s a hot mess. It contains a lot of data that may or may not be useful, with several contexts. However, sure enough, it helps our dev find the issue. It might take them another 5-6 log statements, some consulting with the infrastructure team, and a deployment or two, but hey, eventually they make it through. Bravo!

The “Character”

This dev takes their job seriously. As a possible overachiever, they get to the office in the morning, grab a cup of coffee, sit at their desk, and crunch away at whatever it is that they need to do to hit their personal goal – possibly and probably unrelated to actual business goals and absolutely related to their own personal standard of how things should be. When people mention them in random conversations around the office the first thing that comes to mind is “Now, that’s a character!”.

Aside from being very serious about what they do, these devs are great at problem solving and are some sort of human version of a Swiss army knife. They can get from A to Z with almost zero dependence on other parties and are phenomenal at what they do.

The Character would try to solve our problem by bringing out the big guns: they’ll start by seeing which queries are triggered by the client application, then they’d systematically add a log statement in a strategic location to avoid making too much noise in the company’s log aggregation service. Then they’d wait for a code review of that log, and after it’s approved – they’d merge to staging/master and deploy to production.

Hopefully not too long afterward, a wild log appears! And it contains just the info our beloved dev has been waiting for. They know exactly what the problem is, or at least where it originates from. They know how to proceed in order to solve it and they do it by themselves using the same strategy they’ve used so far. Eventually, they track the rogue SQL query and fix the bug independently. Joy.

The religious hipster

“Oh look! A new JavaScript framework!” – the religious Hipster, some time. Maybe. Probably. (Okay, definitely).

Of all our superstars, ninjas, rockstars, unicorns, or whatever you want to call them – this one stands out. Not because they’re particularly exceptional at what they do, but because of their perspective on things. These devs are well-informed of whatever it is that’s going on outside of their echo chamber that is their company. They’re well aware of whatever it is that other companies are doing to solve their problems, they thrive in developer communities, and they share their problems with other programmers to think of the best solutions – even when these solutions are a bit exaggerated. This dev wants to do it all with the newest tools that are available at their disposal, and if it depended on them – it wouldn’t matter how much it cost.

To solve the issue of incorrect or misleading data, they don’t want to waste time, but they might fail to realize that this exact ambition might make them look for the wrong, probably less-than-optimal, and time-consuming solutions.

They’d spend half a day looking for solutions that enable them to do some live debugging. This would lead them to some answers on StackOverflow about how to attach a debugger to their live testing/staging environment, using tools like gdb and others, depending on the platform. They would stumble across trending GitHub repositories that got some traction on Reddit, run some of them on their machines to test them out, only to realize that something isn’t working or that the repository itself is unmaintained.

After they’d realize this is a probable overkill, and that they’ve already wasted a lot of time for nothing – they’d go for the classic approach, maybe consult with a colleague, and place logs wherever needed. And 2 hours later? Bang, problem solved.

Teamwork Makes the Dream Work

Teamwork is important. You definitely have your own bunch of geniuses, each in their own field in your team, but having them work together is crucial for your team to succeed. During these times of distributed technology, having a distributed mindset in which all parties at least partly understand each other’s field and what they do, along with possible debugging strategies and understanding of their responsibility and work process, could make your team twice as successful, if not more than.

Ultimately, having your team share their knowledge with each other, amplifies and empowers each and every one of them, and yourself, regardless of whether you are the team leader or an individual contributor. The best way to have your team function optimally is to have 3 things available for them: understandability, independence, and asynchronous communication – with understandability being the most prominent.

Understandability and independence are achieved through mentoring and letting team members occasionally take a deep dive into a subject they’re unfamiliar with, or even just by solving bugs in an unfamiliar domain. Having one of your Front End developers take a look at infrastructure bugs along with minimal guidance can do wonders for both the team and themselves individually.

Gaining understandability into your code and your software leads to a skilled, capable workforce. So what is this holy grail of understandability? According to the financial industry, it means that a system’s information needs to be relayed in such a way that it’s easily comprehensible to the one receiving that information. Translating that into terms of your dev team, it means that the dev who is creating the software is able to easily receive and comprehend data from that software, and thus what is happening within it. Add all of this understanding together and bam! you got yourself a well-oiled and smooth-running dev team.

Rookout Sandbox

No registration needed

Play Now

Table of Contents
Get the latest news

10 Things To Do For Your Dev-Self

Tal Koren

12 minutes

Table of Contents

I just finished renovating the Rookout Breakpoint Editor area. It’s the place within the Rookout app that lets you set a breakpoint condition, hit limit, time limit, variable collection depth, and other settings. After every big feature or renovation, there’s always this void I encounter – pretty much the same one I experience after finishing a good TV series (looking at you, Better Call Saul) – it’s that notion that I’ve just finished doing something that I love, and that now it’s time to move on and do something else.

As developers, we have our hands full on an almost hourly basis. Features, bugs, meetings, defending ourselves against QA- you know the drill. If you’re not fixing bugs, you’re writing them (well, maybe not you – you obviously don’t write any bugs). So what happens afterward, or when you go home? What is it that you can do to entertain and/or educate yourself further?

Familiarize yourself with a new tool

A developer’s toolbox is only as big as they make it. It doesn’t matter whether you’re a backend, frontend, or a low-level developer – you can’t go wrong with learning something new. It is basically what we do as R&D day in and day out: researching all the things.

Personally, there are a number of technologies that I’d like to play around with or take part in, especially Rust and Deno, with the latter catching my eyes the most. As a developer who focuses mainly on JavaScript (ok, well, CSS too), I’ve learned to appreciate the need for a typesafe language. While JavaScript is incredible in its own way- powering anything from client-side browser applications to complex server-side logic and Internet of Things – it’s also fairly easy to write code that’s prone to errors.

In that aspect, Deno is very interesting, since it ships with a TypeScript compiler out of the box (no babel toolchain!), has added security measures (such as inability to access the file system/environment variables unless specified explicitly), has its own code formatter, dependency inspector, as well as a set of audited standard modules. Also, as the cherry on top – it’s written in Rust! So I hopefully will get to play around with that as well.

If I had to compare the current stage of life of Deno to an equivalent stage of life of Node.js, I would say that it feels somewhat like Node.js felt back in 2012 when everything was new and no one really had an idea of how big or popular it would get. These days are perfect for such experimentation.

Familiarize yourself with a tool you already know

Got you there, didn’t I? But seriously, if you’ve ever heard of T-Shaped people – people who know a lot about a variety of subjects but are experts in at least one – that’s exactly what it means. Having this type of specialty is invaluable to you, both as a person and as a professional.

If you’re a Front End Developer and you use Webpack on a daily basis without digging into it too much, now might be the time to do just that and learn a bit about compilers and ASTs (Abstract Syntax Trees), and the same goes for a variety of other subjects, like Docker and Kubernetes, CSS-in-JS and how it gets transpiled into CSS – or even Node.js and its internals. The choice is up to you.

Game your way to the top

As Jack Nicholson once wrote: “All work and no play makes Jack a dull boy”. Let’s put a happy spin on it and do the opposite.

Sometimes you just need to distract yourself, or simply disengage from work-related matters. As an avid gamer in the past (and less so in the present time, unfortunately), those precious moments are invaluable. Right now, when not working, I mostly write code for fun or play Minecraft. It’s another interesting twist I get as a developer who likes building things, although I mostly build underground dungeons. At other times I used to play World of Warcraft, The Witcher, Alan Wake (it’s pretty dated but it’s still amazing), Grand Theft Auto, and Elite: Dangerous.

Each of those has its own charm and they all provide a great way of clearing your mind – just like taking a short walk outside – which is especially important when trying to solve bugs. Games and some time out are a gateway to creativity and creativity helps with finding solutions faster, even when we’re not aware of it.

Look for new solutions to old, annoying problems

Let’s go back to Minecraft.

Minecraft consists mainly of blocks. Similar to Java and JavaScript, where (almost) everything is an object – in Minecraft, most things are blocks. You have a block of gold, a block of iron, a block of water, a block of ice, a block of packed ice… well, you get the idea. You have blocks.

I wanted to build my own lake, so naturally, I took a bucket, filled it with water from a water source block, and started filling an area with water. I was only beginning to do it and noticed it would take a long time, but was still at it.

Then a friend came along, threw a stack of ice blocks, and said “Hey, take this stack of 64 ice blocks. Just put them at the top level of the soon-to-be lake and break them – they would break into water and fill the entire area”. Boom! Problem solved. Now my boat has some roaming space.

When I first stepped into the Rookout offices and had my interview, my jaw quite literally dropped when I realized how much time this company saves for developers. No more waiting for ages-long end-to-end tests to pass just so you could add a console.log statement. From that moment on, I knew that even if I didn’t pass the interview, I would still use the product. I would break that block of ice and make my personal experience of debugging more fluid.

Look for solutions, be it when gaming, writing code, or living.

Watch a new TV Series

Not a very tech-oriented activity (or is it? ). TV content these days is nothing like it used to be when I was a kid 20 years ago. Sure, there were some fun shows back then, including Seinfeld, Friends, Family Matters, Saved By The Bell, The Fresh Prince of Bel-Air, etc. But our current times are different in one particular way: new shows are created by people who used to be kids 20 years ago, and this makes for a plethora of original ideas, resulting in brilliant content – when a large portion of it is witty and geeky at the same time.

Such shows are, for example, Upload and Mythic Quest (my personal favorites, but no worries – I won’t spoil anything ).

“Upload” uses the pretty common idea of “uploading yourself to the cloud”. It tells a story about a guy who gets his consciousness uploaded to a cloud, where he has certain limitations like a data quota, and where he stumbles across a lot of amusing scenarios. My favorite one would have to be where he’s swiping left to get a supposedly free drink from a machine, only to find out that he actually needs to pay for it. Freemium gaming trauma intensifies.

It’s a brilliant show with a lot of what humans like – it’s got humor, geekiness, and of course, romance. ¯_(ツ)_/¯

The 2nd show is Mythic Quest. It tells the story of a company that develops an MMORPG game and resembles a theoretical mix of the show Silicon Valley with South Park’s “Make Love, Not Warcraft” episode. The constant bickering between developers, the product manager, graphics designers, and of course the CEO, regarding game mechanics, items, and behaviors is all that you’d expect from a series created (probably) by gamers. It is exactly the type of content that was nearly impossible to create 20 years ago. The inspiration had to come from somewhere and that somewhere was millennials.

Get involved in the community

One of the great things about being a developer is that there are communities all around. No matter where you are, there’s almost always a community of developers around you, especially during COVID-19, during which these communities are more flourishing online than ever. There are developer groups in WhatsApp, Telegram, GitHub, Discord, gitter.im, even on good old IRC. All you have to do is look!

The benefits of joining such a community are countless. From my few years of experience in such groups, I have learned a lot about a variety of topics, be it things related to developer employment, self-learning, staying up-to-date with the latest tech, hypes, and trends, etc. Also, the people you get to know are fascinating and each come to this field with their own special experiences, perspective, and knowledge, which everyone can benefit from.

This is also the place where you can shine in a variety of ways. Being a part of a community also means opening yourself up to new opportunities. This can include job offers, the opportunity to contribute to open source projects, arranging meetups or study groups, etc. The sky’s the limit!

Spin up a side project

Have you always wanted to experiment with the Internet of Things and haven’t had the time or patience? Now may be the best time to do so.

Being a developer enables you to express yourself and experiment with a variety of technologies unavailable to people in other fields. You have the ability to build software that can affect other developers (Rookout, hint hint) and other people in general. It doesn’t even have to be for other people – it can just be for yourself or your family.

Follow worldwide influencers

The age of what used-to-be-called Web 2.0 brought us platforms like Facebook, Twitter, and the like. While Facebook is focused on making contact with your family and friends, Twitter is a global treasure trove of individuals writing about what interests them. This is an incredible opportunity to learn more from global influencers and individuals alike (and of course, look for cats).

As a JavaScript and a Front End Developer, I especially enjoy following Addy Osmani, Mark Dalgleish, Shawn Wang (otherwise known as swyx), and Nick Ribal who is also a personal friend. All of these individuals are well known in their field for the ways in which they have contributed to the developer community and for their original ways of thinking, as well as the knowledge they share with their audience on a regular basis.

This could also pose as an opportunity for you to do the same. Everyone has something to contribute to the community and you are no different, no matter what you believe your Impostor Syndrome to be telling you.

Optimize your personal workflows

A lot of what I do consists of computers. I have a Windows machine, a Linux machine, and a MacBook Pro with MacOS. Linux and MacOS are my daily drivers and I made all three of them as convenient as they can be.

Back when all I had was my Windows machine, I used to fiddle around with it for quite a bit. One of the most prominent tools I discovered during that time was AutoHotKey, which lets you bind text commands and hotkeys for pretty much anything, using a dedicated programming language. For example, at that time I didn’t have a keyboard with media controls, so I used AutoHotKey to write a script that configures custom media controls that I could play with. Another example was when I wanted a hotkey that would make the current window appear on top of any other window – and I did it with a single line of code.

Nowadays, on my Linux machine (used to be Arch Linux, now it’s just Ubuntu 18.04), I use AutoKey for similar purposes using Python (I do have a media-supported keyboard now, though ), although my AutoHotKey script is way more robust.

Another tool I absolutely loved when working under Windows is Everything – an incredible tool for searching files and folders quickly. All I had to do was bind the app to Ctrl+Shift+F (it’s configurable in the app’s settings) and that’s it. On MacOS I use Alfred for the same purpose, while on Linux I use Albert.

Discover your own productivity tools and make the best of them. Also share your config! It’s all about community.

Perfect your Interview-Fu

These times of COVID-19 force everyone to think about the future. Interviewing in tech is already a challenging endeavor and a tough nut to crack and perfecting your interviewing skills is something that would benefit you tremendously throughout your career and coming years. For developers, there are several ways of doing just that.

The first one is awareness. You need to know your strengths and weaknesses; which sides of you shine in interviews and which ones need some work. Your technical skills might be phenomenal, but if you lack the skill in showing them (i.e. you get nervous and suddenly forget things), nailing that 2nd interview can be tough. Some meditation and self-learning, just to feel more comfortable, goes a long way.

Another way of being more in peace with yourself when interviewing is just imagining you’re at home, working on a side project. I mean, naturally, you wouldn’t feel pressured if you were trying to traverse a tree while having your dog in your lap, right? Same point, only with doodles on a whiteboard.

And last but surely not least – and that’s the best way that’s worked for me in the past – is getting someone you know, who interviews people regularly, to do the same with you. A 2nd perspective is always a good one, especially when said perspective is both friendly and comes from a professional like yourself. You would discover that you might not be sending the right message across, verbally or even physically (body language means a lot), or that you might be going way deeper into certain topics than you’re supposed to.

Rookout Sandbox

No registration needed

Play Now

Table of Contents
Get the latest news

5 Ways to Empower Your Developers

Liran Haimovitch | Co-Founder & CTO

8 minutes

Table of Contents

You know the saying, “by developers, for developers”? Well, at Rookout, we take that quite literally. Developers are the heart and soul of Rookout. As developers ourselves, especially as ones who have had our heads stuck in code for many years, we look to make fellow developers’ lives easier.


There are countless tools that are available to developers. Whether they enable easier workflows, improve quality, aid in collaboration, and so on and so forth – the sky’s the limit. With all these options, how do you choose what’s best? Devs are notorious for their personal preferences when it comes to working on their code, and choosing their tools is no different. Like proud parents, they want what is best for their software. Going about choosing these tools is no easy feat, so we thought we could make it just a smidge easier for you in your search.


The Rookout team is dedicated and driven by hard-earned experience. That’s why they’re sharing their experience with you. Here are just a few of the tools that these awesome devs believe empower them most in their work. So sit down, grab your cup of coffee – or beer, it’s happy hour somewhere!- and read what tools might help you to optimize your dev workflow.

A tool that has everything

Let’s begin with one of our Backend devs, Zeev Manilovich. When pressed to share one tool that he loves above all else, he chose IntelliJ IDEA.

“IntelliJ IDEA is my go-to tool for everything development related. It has all the needed information and tools to do my job. The plugin system makes it an all-in-one development tool, essentially allowing you to develop an application end-to-end without leaving it.


Some of its best features are an IDE with all the needed language linters, various version control clients, a database client for all popular databases, code compare and merge tools, fetching documentation, integration with dependency management, and much more. For me, there is no way that I could have done my work without it. Simply put, all the alternatives just aren’t as good and I’m not even anywhere near thinking of replacing it.”

Work Smarter, Not Harder

When it comes to DevOps, we have Mickael Alliel, Rookout’s self-titled ‘jack of all trades’. His choice of tool was K9S.

“In my role as DevOps, the tools that empower me the most are the ones that save me time. So, I usually look at what my workload consists of for the day. At Rookout we are subscribed to and use more than 20 different SaaS tools, which all have their use. However, personally, if I don’t use something every day, then I wouldn’t rank it high on my list of helpful tools.


Managing a Kubernetes cluster is not an easy task, and even when using a managed service such as GKE, I still find myself buried in my terminal under kubectl commands switching namespaces and clusters to find out where a deployment went wrong. I then found out about K9S – a nifty open-source CUI (CLI User Interface). It could make everything easier, ranging from auto-refresh to color coding, showing more detailed information about pods, parsing base64 config and secrets at the press of a button, and of course providing a way to manage environments such as cluster contexts and namespaces.


I have been using this tool for the past year or so. When some of my colleagues at Rookout saw it on my screen, they were surprised they weren’t already using it. I of course pointed them to the Github repository and gave them a quick tour of the tool. I think the most annoying part about using it is that I want to contribute and give back to this awesome tool and team that made my life easier, but they are already so on top of things that I can’t send a pull request fast enough with a feature that I’m missing because it’s already been done!”

Less Stress, More Style

When it comes to our team’s Frontend, Tal Koren proves they’re just as dev-y as the rest. He has many tools he loves, but Styled Components has stolen his heart.

“One of the best things about modern Web Development is the concept of Styled Components. As Newman from Seinfeld once said – “Love is a spice with many tastes” – and so is CSS. This language that makes web pages and cross-platform apps pretty to the eye is often regarded as not-so-pretty itself and as unintuitive for a number of reasons. One of those reasons is the need to always think about specificity.


In CSS, specificity is taken very seriously. If you have a CSS selector that points to a specific element in a very detailed manner – it would take precedence over other less ‘detailed’ selectors pointing to the same element, and this is often the reason why people use the infamous !important declaration – which is something none of us should ever have to use – when needing to override that selector.


Styled Components and @emotion/styled (Emotion’s take on Styled Components) save us from all this trouble. They let us focus on the styling rather than on class names or specificity (since those two are being handled by the library, respectively), which ultimately makes life for Front End Developers much easier.


This, of course, doesn’t mean you shouldn’t know your CSS.  It’s an integral part of each and every Frontend Developer’s toolbox. But if your plan is moving forward fast in this age of Modern Web, where every component is encapsulated to be an entity of its own, then the ‘styled’ philosophy is something you should probably keep in mind.


And as a way of showing we walk the walk and aren’t just talking the talk – we are in Emotion’s examples in the wild.”

Keeping Bugs in Line

Our VP R&D at Rookout, Dudi Cohen, is emphatic about making sure his devs have the right tools. The ones that best serve his devs though? Bugsnag and Sentry (sorry, he couldn’t choose just one!).

“When thinking of a tool or service that empowers me as an R&D manager, I think of how those tools must be something that gives great value to both my team and me. One of the main problems that Rookout’s product solves is debugging and solving bugs. Yet, before you can fix and solve the bugs, you must first find the bugs and understand the state of quality your product is in. At Rookout, we use Bugsnag and Sentry. Their value is amazing and empowers our team of developers. It does this by allowing them to hunt the bugs and gives them a headstart on fixing them.


As a manager, I know that my devs have the right tool to help them find bugs, while also giving me a high-level understanding of the quality my team delivers. I don’t often dig into the details of every bug, but when I do I am able to get a wide insight into my system’s status. I can look at the amount of bugs for each application and service we have, see the amount of new bugs that surface when we deploy a new version, and then identify overall trends. I am able to easily decide whether I want my team to put more or less effort into bug smashing and can then raise a flag to our sales engineers and support engineers when things heat up.

If you don’t have any error reporting framework, go ahead and integrate one. Whether it be Bugsnag, Sentry (which has excellent integration with Rookout) or any other service – you won’t understand how you managed to get by without it.”


Doing Things Right

As CTO of Rookout, Jira is my favorite tool. Why, you ask, out of all of the tools in the universe, did I choose this specific one?

Well, for starters, as the CTO, Jira gives me the management capabilities that I need. I know, I know, most devs everywhere are less than fond of Jira. But let’s be honest! They (especially our dev team) end up liking the end result. The impact that an empowered and well-managed product team has on their workflows is incomparable. While they may dislike the software, they do like that their tasks are clear and unconfused. It lets them know exactly what they are working on and why.


Jira allows us to break down the roadmap we have in place into byte-sized pieces of work that can be executed on a day-to-day basis. It also enables our product and engineering leadership to stay on top of things, knowing where they should focus their time and energy to make sure things are progressing smoothly.


Tools All Day, Everyday

As the saying goes, “if the shoe fits…”, but really, it’s if the tool fits. In our experience as software developers, no tool does it all, no matter how hard their marketing might want you to believe. That doesn’t mean, though, that you should give up all hope.


Rookout, for instance, as a data extraction and pipelining platform, will empower you to find the information you need and deliver it anywhere. This lets you understand and advance your software, saving you hours of work and reducing the time you waste logging and debugging. But hey, the possibilities are infinite! Whether you choose to adopt Rookout or one of the above tools (or even better, why not adopt a few?), just remember that it’s about what’s best for you and your code! We’re looking forward to hearing which worked for you 😉


Rookout Sandbox

No registration needed

Play Now

Table of Contents
Get the latest news

Jenkins and Kubernetes: The Perfect Pair

Liran Haimovitch | Co-Founder & CTO

5 minutes

Table of Contents

As the world is adapting to new and unforeseen circumstances, many of the traditional ways of doing things are no longer. One significant effect of this is that the world has gone almost completely virtual. Whether it’s Zoom happy hours and family catch-ups or virtual conferences, what used to be in-person has digitized. Before the world seemingly turned upside down a few months ago, I was meant to speak at a conference about our experience at Rookout running Jenkins on Kubernetes these past few years. Yet, alas, it was not meant to be. So, I figured I could impart whatever I have learned thus far, here (digitally! ;)), with you all. The world is going virtual, so what better way to connect over learned experiences, right?

Jenkins and Kubernetes

Why would you go about running Jenkins on top of Kubernetes?

The TL;DR of why we chose Jenkins is that we needed a high degree of control over build-processes and the code-reusability enabled by Jenkins Pipelines (in the time since we have made that choice, CircleCI and GitHub Actions have made great progress in meeting some of our requirements). You can find the full details of that specific journey in this blog post, but let’s focus on this one.

Running Jenkins on top of Kubernetes takes away most of the maintenance work, especially around managing the Jenkins Agents. The Jenkins Kubernetes Plugin is quite mature, and using it to spin up agents on demand reduces the maintenance costs of the agents themselves to virtually nothing.

The Ugly Parts

While we greatly enjoy the day-to-day benefits of this setup, such as fast build times, highly customizable CI/CD processes, and little to no maintenance, getting it up and running was far from a trivial task.

Along the way, we ran into various limitations of both Jenkins and Kubernetes, looked ‘under the hood’, and discovered little-known nuggets of knowledge. By sharing them here, with you, I hope your own deployment experience will go much smoother.

The Deployment Process

The easiest way to get Jenkins agents deployed on Kubernetes Cluster (we are using a dedicated cluster for Jenkins, but that’s not necessary) is to build your own Helm chart (if you are not familiar with Helm, check it out) relying on existing helm charts as dependencies and adding any additional resources you might need.

The first chart dependency you’ll add is, quite obviously, Jenkins itself, and we chose this helm chart from the stable helm repository. The most important configuration options to define are:

  1. Make sure to pass a Persistent Volume Claim as ExistingClaim to the Jenkins Persistence configuration.
  2. Figure out the amount of memory your Jenkins Master requires based on the amount of jobs you are running and set the JVM arguments -Xmx, -Xms, and -XX:MaxPermSize in the hidden master.javaOpts argument (we use 8192m, 8192m, and 2048m respectively).

The most challenging part of running Jenkins on Kubernetes is setting up the environment for building container images. To do so, follow these three simple steps:

  1. Add a deployment and a service running the official Docker image for building containers docker:dind to your Helm chart.
  2. Mount a persistent volume to /var/lib/docker to make sure your layers are cached persistently for awesome build performance.
  3. Configure pod templates to use the remote docker engine by adding the DOCKER_HOST environment variable to point to the relevant pod  (i.e. tcp://dind-service:2375).

Operational Considerations

The next step on your journey is to enable your team to access Jenkins while, at the same time, avoiding exposing it to the world. Jenkins has a multitude of plugins and configuration options and struggling to keep everything up to date and secure is nearly impossible.

We chose to handle that by having our ingress controller, HAProxy performs the OAuth2 authentication before passing any incoming requests to Jenkins. Follow this guide to configure the HAProxy OAuth2 plugin to use the OAuth2 Proxy Container. If you configure Jenkins to use the same OAuth2 identity provider (for instance using this plugin for Google Authentication), your team will only have login once. Alternatively, you can always get a commercial, off the shelf solution such as Odo.

Once you have everything set up, you’ll want to make sure your Jenkins Master is being backed up regularly. The easiest way to achieve this is to use this neat little script.

Resources and Scaling

As I previously mentioned, we found that one of the biggest benefits of this approach is the ability to easily scale your resources on the fly. We use two separate Node Pools on our cluster, one for long-running pods such as the Jenkins Master, Ingress, Docker-In-Docker, and a second node pool for the Jenkins Agents and the workloads they are running.

For our master itself, we chose a single-master deployment for our Jenkins. This is running on a single node with 16 CPUs and 64GBs of RAM. This means that master upgrades and other unexpected events can lead to short downtimes. If you need a multi-master deployment, you are on your own 🙂

The second node pool is running the Jenkins Agents and their workloads and has auto-scaling enabled. To allow Kubernetes to smartly manage resources for that node pool,  you have to make sure that you properly define the Kubernetes Resource Requests and Limits.

This has to be done in two separate configurations:

  1. Set the Jenkins Agents resources in the helm chart under agent.resources.
  2. Set the resources for the workloads themselves as part of the Pod Templates in the Jenkins Kubernetes Plugin.

Keep in mind that the second node pool is actually a great opportunity for cost savings and is the perfect candidate for Spot Instances, either directly or by leveraging Spot. As an additional benefit, when running on GKE we found that nodes’ performance deteriorated over time, probably due to the intensive scheduling of pods. When using Google’s Preemptible VMs that are automatically replaced every 24 hours (or less), we noticed significant improvements to the cluster reliability and performance.

It all boils down to…

In my work with both our customers and Rookout’s R&D team, I have found that deployments are often the bottleneck that is slowing down day-to-day operations and engineering velocity. I hope that by sharing with you a few of the lessons we learned running Jenkins on Kubernetes, you’ll now be able to improve your own CI/CD processes.

Having said that, it’s still important to note that adopting tools such as Rookout will enable you to do even more, while not requiring as many deployments. So go forth and get started, I’m looking forward to hearing how your experience went!

Rookout Sandbox

No registration needed

Play Now

Table of Contents
Get the latest news

Reassessing My “Works on My Machine” Certificate

Dudi Cohen | VP R&D

8 minutes

Table of Contents

I recently remembered that about 13 years ago I was fully certified with the “Works on My Machine” certificate program. Although I went through the entire evaluation process as was required by Joseph Cooney in this blog of his, to be honest, I didn’t quite like how his certificate looked. So, I decided to go the extra mile – well, really, the extra few steps-  in order to get the revised certificate issued by Jeff Atwood’s version.
These are the steps I had to complete to achieve this shining moment:

  1. Compile your application code. Getting the latest version of any recent code changes from other developers is purely optional and not a requirement for certification.
  2. Launch the application or website that has just been compiled.
  3. Cause one code path in the code you’re checking in to be executed. The preferred way to do this is with ad-hoc manual testing of the simplest possible case for the feature in question. Omit this step if the code change was less than five lines, or if, in the developer’s professional opinion, the code change could not possibly result in an error.
  4. Check the code changes into your version control system.

Since that momentous occasion, I’ve issued numerous such certificates to my co-workers, employees, and, of course, to myself. I started managing Rookout’s R&D team about 9 months ago, but I was a bit baffled to realize that I didn’t have to issue any “Works on My Machine” certificate to my employees yet. As I sat down to ponder this, I thought to myself: how come? How could it be that none of them have received it? Have none of my employees deserved this certificate?

There is no “My Machine”

When looking at our tech stack and architecture, and specifically in regards to the “machine”, a variety of challenges can be seen. In all cases, the “machine” isn’t enough, and there is always one other thing that’s missing to factor into the equation. This is true even when we have total control over our machines in all environments.

In our web application, we basically have the same challenges that all FrontEnd developers have: the elusive and vastly fragmented world of browsers. Ranging from mobile web views through Firefox, Safari, and Chrome – we meet them in all shapes and versions. Our functionality is pretty much supported on all browsers, but all of our CI/CD and automation is dedicated to Chrome (Chromium, to be exact). We think that this covers most cases and that asking our customers to use Chrome/Chromium for the perfect experience is a legitimate request.

Our web application might not look perfect on all browsers, but the core functionality fully works. Since we decided to dedicate our browser support to Chrome, we have been using the headless chromium tests using TestCafe for our complete sets of regression and end-to-end tests. Considering we’re no longer in 2007, replacing the “machine” is simply editing our Dockerfile and Jenkins will do the rest. Apart from testing and focusing on a specific browser, we of course use Babel for Polyfilling.

Works on that machine

The area that looks as if it is the most complicated, with the biggest variety of machines, is our SDK. Rookout’s SDK supports Python, Java, Node.js, and .Net. Each of these languages has multiple versions, dialects, frameworks, and environments. If that didn’t add enough pressure, we have to completely test each one and make sure they don’t break every time we change anything (which, as we all know, is a very real fear).

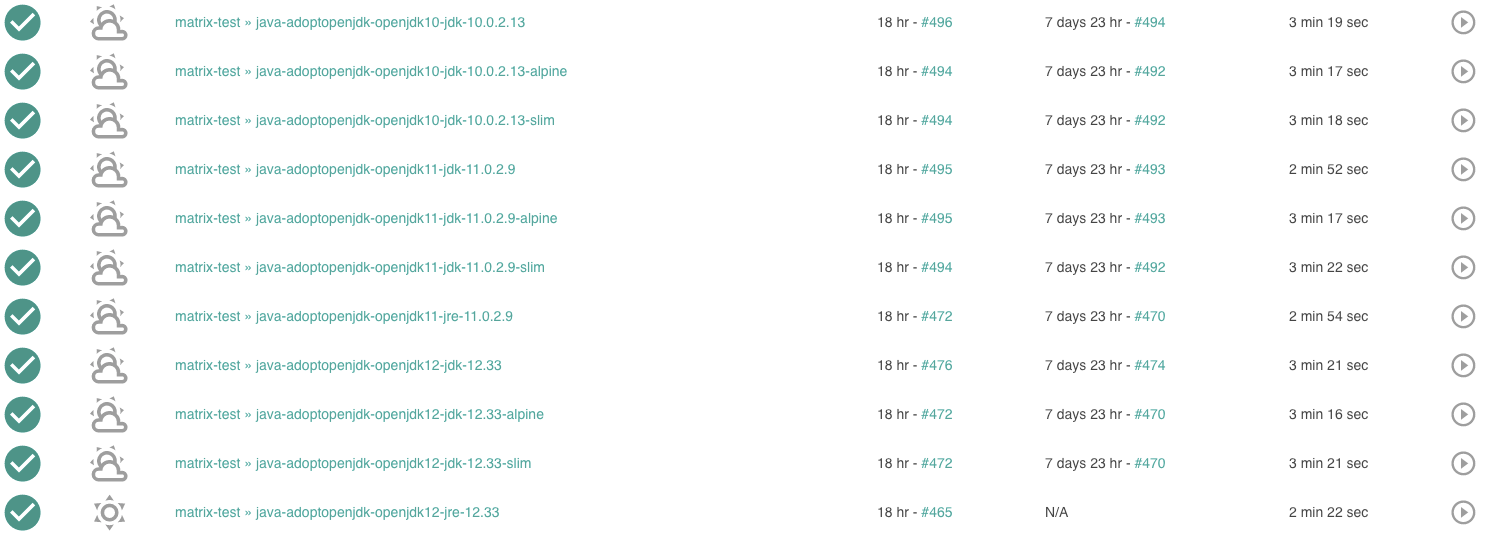
To this extent, it seems that we can actually have a new sort of certificate program, which we can call: it “Works on That Machine”. Instead of only acquiring that one measly certificate that says you’ve tested it on your development machine, what we need to do in actuality is to stack up those certificates on everything you test out. We have our own test matrix which consists of testing out our SDKs on as many permutations as we can test. Looking at Java, for example, we take into account the permutations of the JVM runtime and version, the OS, and other different environment configurations.

Whenever a customer asks us whether we support his specific tech stack, we would go back to our wall of certificates and check whether we’ve earned that specific “Works on That Machine” certificate. In essence, we would basically keep working on issuing ourselves more and more certificates, similar to army veterans that look like they might fall over from the sheer weight of all those medals on their chest. And yes, that’s exactly what we anticipate our wall would look like.

Backend – Thinking you’re in control

Things start to get really weird when you look at your BackEnd. Since the world started working with VMs, containers, dockers, and all of those other types of technical wonders, you feel pretty much covered. Develop on your machine, shove it into your Dockerfile or whatever works for you, and – voila! –  you’re testing and working on the same machine as in production. There are no “end users” or weird machines that your application is installed on. Then “Works on My Machine” is good enough here, right?

Wrong! It will definitely boot up properly and work fine when you are interacting with it and sending in the data that you are used to sending. However, you need to keep in mind that all hell breaks loose (no exaggeration, trust me) when real users start interacting with your machine. Your code and thus your application are merely “extras” in this movie and the main actor is the data. Whether it’s the data you weren’t expecting, or that that huge amount of data comes all at once, the fact remains. Data is the main actor.

Let’s be honest. Nobody cares if you have the “Works on My Machine” certificate. What you really need is that luxurious “Works with Real Data” certificate. This isn’t true only for the backend where you have control over your machines, but everywhere.

“Works with Real Data” certificate

In order to make yourself ready for the real world, you need to simulate the real world in advance. Seems simple enough? Here are a few ways to do just that:

  1. Manually create the data – use a demo environment that you know and can expect its behavior.
  2. Automate data generation – bombard your application with “random” or intelligently crafted data.
  3. Mass copy real data – copy data from your production database and use it in your testing environment.

All of these are valid methods to prepare your application for the real world. Using real data that’s been copied from production is “as good as the real thing”, but it’s not so recommended to do this as part of your routine. Your users’ real data is usually private data that must be guarded and shouldn’t be moved around. As they say, security first!

How do I get certified?

No matter what you do, and how you prepare yourself, you must interact with the real data in order to get your “Works with Real Data” certificate.

In my experience, I’ve found that the best way to do this is by working with real data. I have actually discussed this in a previous blog post about getting your code really fast into your production environment and seeing how it interacts with real data. You won’t -and shouldn’t -do it blindly. Of course, we use LaunchDarkly’s feature flags to do so gradually and carefully. Some companies, alternatively, also use multiple environments and have A/B testings on different production environments with different versions.

Once your application has handled a variety of real data (different users and varying scale), you will definitely be able to self-issue a “Works with Real Data” certificate. However, take note and keep in mind that you will always be surprised with new data that you’ve never seen before because sometimes it seems that the Spanish Inquisition uses your software.

I’ve been certified, now what?

So, you’ve been certified, congrats! You chill and watch your application behave, but something isn’t really working. Perhaps you see your application crash or maybe Bugsnag or OpsGenie is trying to get your attention to tell you that something is wrong. Usually, you will have some of that data collected, whether you’ve proactively collected it with your logs or your exception caught it. However, from our experience, that real data is very elusive, and you’ll always be missing out on what was the data that challenged your application.

This is exactly why we started Rookout. We believe that your application isn’t only code. Your application is the tight bond between your code and your user’s data. Our product allows you to collect real data from your application anywhere, anytime. With Rookout, you don’t have to plan ahead and worry about that unexpected data you didn’t future proof against. Sit back, relax, and enjoy that certification.

Rookout Sandbox

No registration needed

Play Now

Table of Contents
Get the latest news

Remote Debugging: Everything You Need to Know

Maor Rudick

7 minutes

Table of Contents

Nowadays, the term ‘remote debugging’ instills fear into even the bravest of dev hearts. Palms sweaty, knees weak, and arms ready (to code) they dive into what they’re sure will end in much pain and possibly a few broken pieces of code. This scenario and these feelings are common to devs everywhere, where many opt to take the trusted path of debugging on their *own* machines. While this may be a tried and true method, the future of debugging is here and, you’ve guessed correctly, it comes in a remote form (cue heart palpitations).

Service architecture has become increasingly complex and the old days of monolithic applications are behind us (well, not entirely, but that’s another discussion for another time). With the rise of new software techniques such as microservices or serverless, not only has the way we write code changed, but also the way we debug it. This change necessitates taking a leap of faith to try and adopt new means to work the bugs out of the system. Enter remote debugging.

In simple terms, remote debugging is debugging an application that runs in a place other than your local environment. This is usually done by connecting the remotely running application with your development environment. Intrigued but also a little terrified? We get it, but don’t run just yet.

When Should You Use Remote Debugging?

If you are a developer or an executive (or both), you know that debugging is crucial. Even more, you understand that while classic debugging might be yielding results now, remote debugging – when done right- can save you a significant amount of headache and time. Remote debugging becomes crucial at some point for you, whether it’s because of difficulties you’ve encountered with classic debugging or the simple fact that the classic debugging method has become near impossible to use.

Believe it or not, there are high chances that at one point you used the technique of remote debugging without even realizing it. Crazy? Not so much.

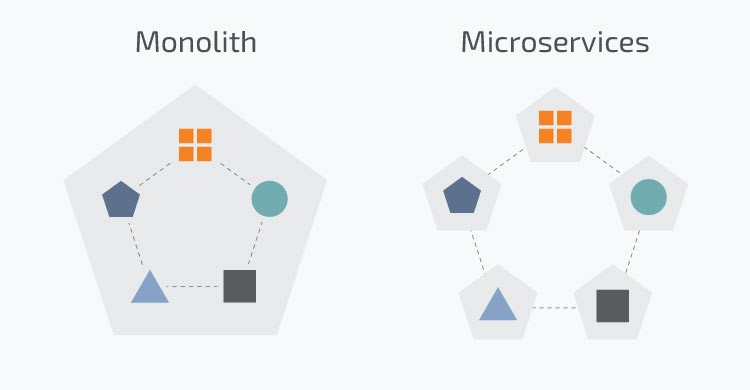
For a deeper understanding, let’s look at the problem with the old way of troubleshooting the code for modern software architecture. Let’s take a look at microservices, given that this method has been used by developers for a longer time than the serverless approach.

As we know, microservices came into place as a solution, as well as a substitute for monolithic applications. At its core, this technique is defined by the following principle: divide a big application into smaller parts that are easier to manage, and distribute the workload among developers.

As you can see in the below scenario, the application is distributed, thus making it much more difficult to reproduce a bug, due to the simple fact that it’s difficult to trace it back to the source. On top of this, logging is decentralized and harder to analyze.

monolith vs microservices production debugging

If you are going to attempt production debugging of such an architecture, you will have to access and sift through many log files and write often necessary additional logs, after which you’d need to redeploy and restart your application, just to get additional data. This process is not only time-consuming but it also requires more practice and patience. So yes, we understand why you try to avoid debugging microservices like the plague.

What About a Serverless Application?

Serverless, comparatively to microservices, is a much more distributed architecture. The underlying premise of serverless is that it works by default abstraction of underlying infrastructure and abilities related to it. Thus meaning, we decouple our application at function level. Function levels are single-purpose, programmatic functions that are hosted on managed infrastructure.

The downside in microservices is that developers who are working in normal conditions aren’t able to run their processes and can’t debug their serverless applications on their IDE or local environment.

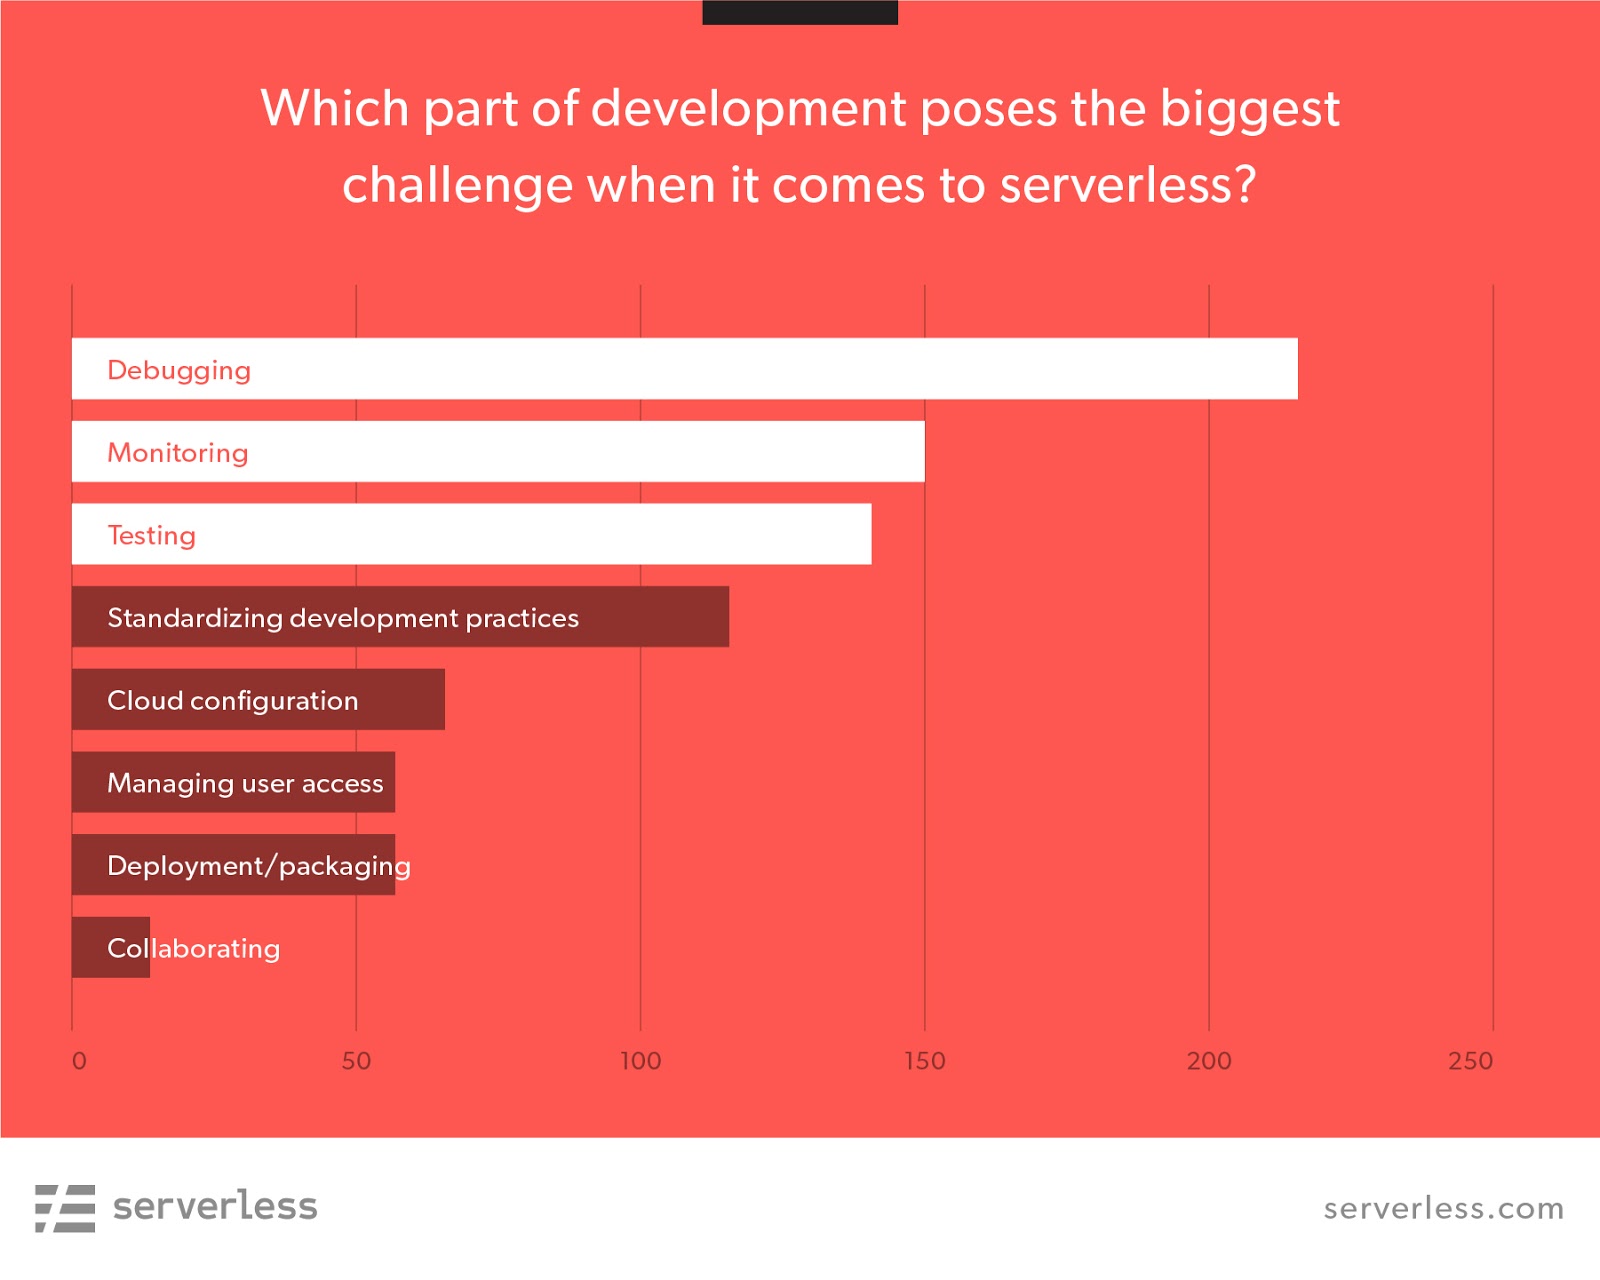
A 2018 community survey of the biggest serverless challenges showed that the most notable one to be debugging. This with the addition of monitoring and testing clearly points back to a lack of proper tooling.

serverless community survey debugging

These examples represent situations where remote debugging can bring surprising value, making the process simpler and faster, most significantly in cases where regular debugging is impossible.

A more classic case where this can be seen is with a web application that has a problem on mobile phones. In this situation, remote debugging with the help of different tools made available by modern browsers is the only solution.

How To Go About Remote Debugging Properly

As wise men have taught through the ages (well, the debugging ages at least), debugging is 99% about collecting data about your application until you reach the point where you figure out what is causing the problem.

Remote debugging is the same, but because the application runs on a different host than yours, collecting data from it can be really problematic and can have a lot of caveats in terms of performance.

Luckily enough, nowadays we have a powerful suite of tools that allow you to debug defective code running on a different host as if it were your local code. Yes, you read that right: remote debugging can be done so that it’s basically like classic debugging.

To properly explain, let’s go with Rookout for a demo of just this.

We mentioned that the core of debugging is represented by data collection.

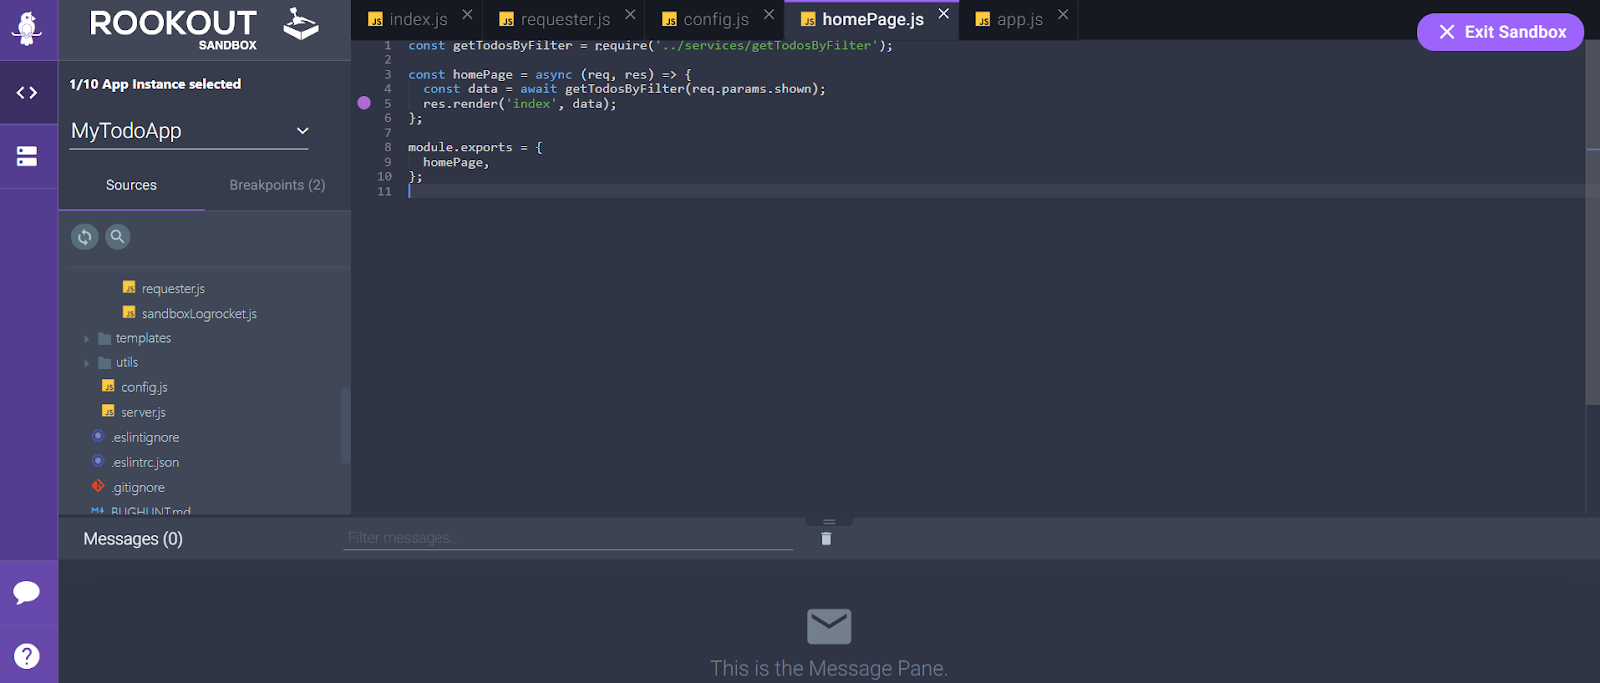
Let’s take this application for example, which is a demo To-Do application provided by the Rookout sandbox.

If, for example, we want to see the entire to-do list, which is sent to the front-end application, then all that has to be done is to set a Non-Breaking Breakpoint (similar to regular breakpoints, these don’t actually touch your code, letting you get data from your code without stopping or breaking your app) at the corresponding line. This is exactly the same action you would take had the code been running on your local machine.

Rookout remote debugging platform

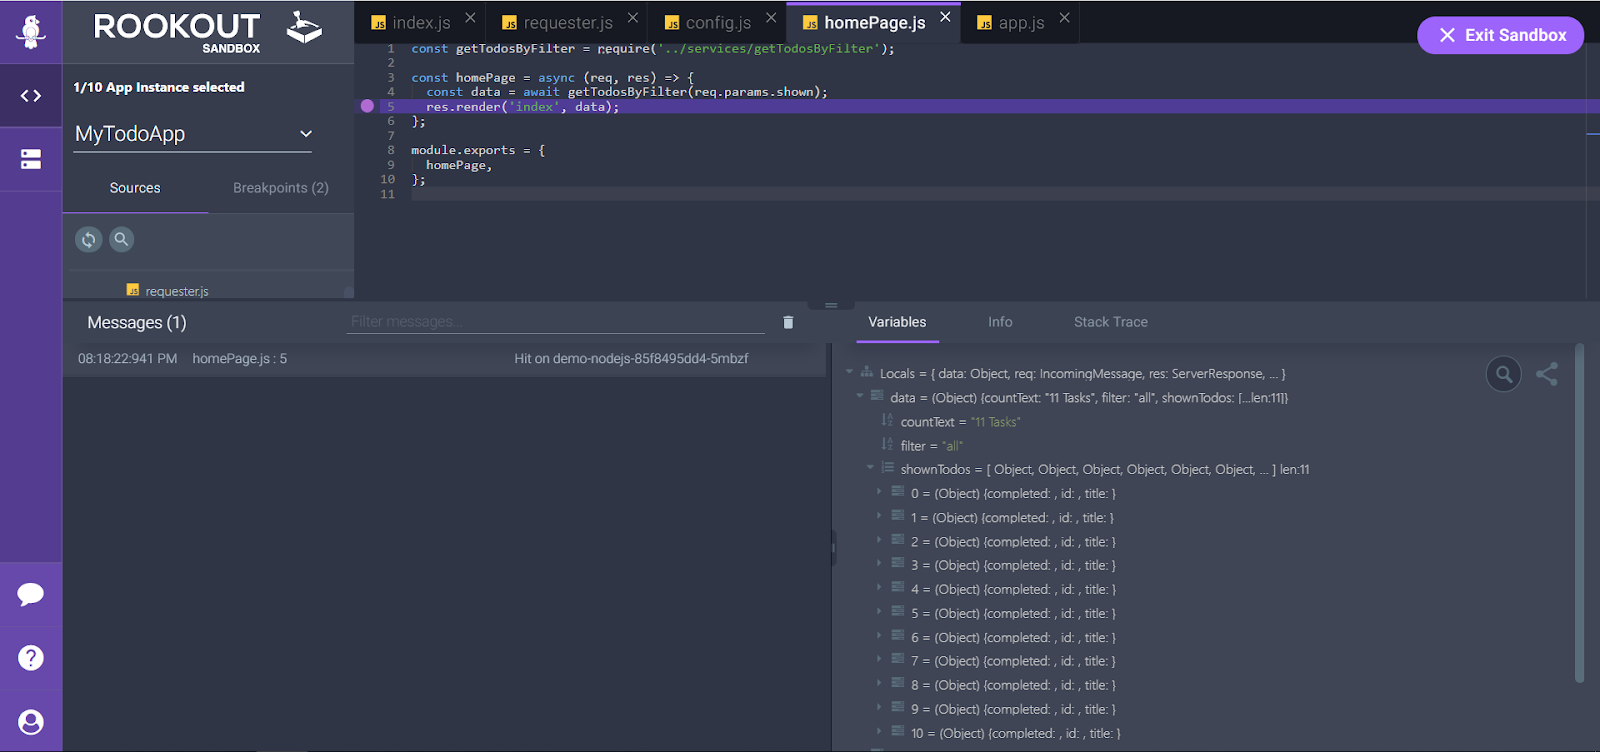
Then, when application’s page is refreshed, inside the Message tab a memo will pop up, notifying you about the data that was collected:

Rookout remote debugging ui

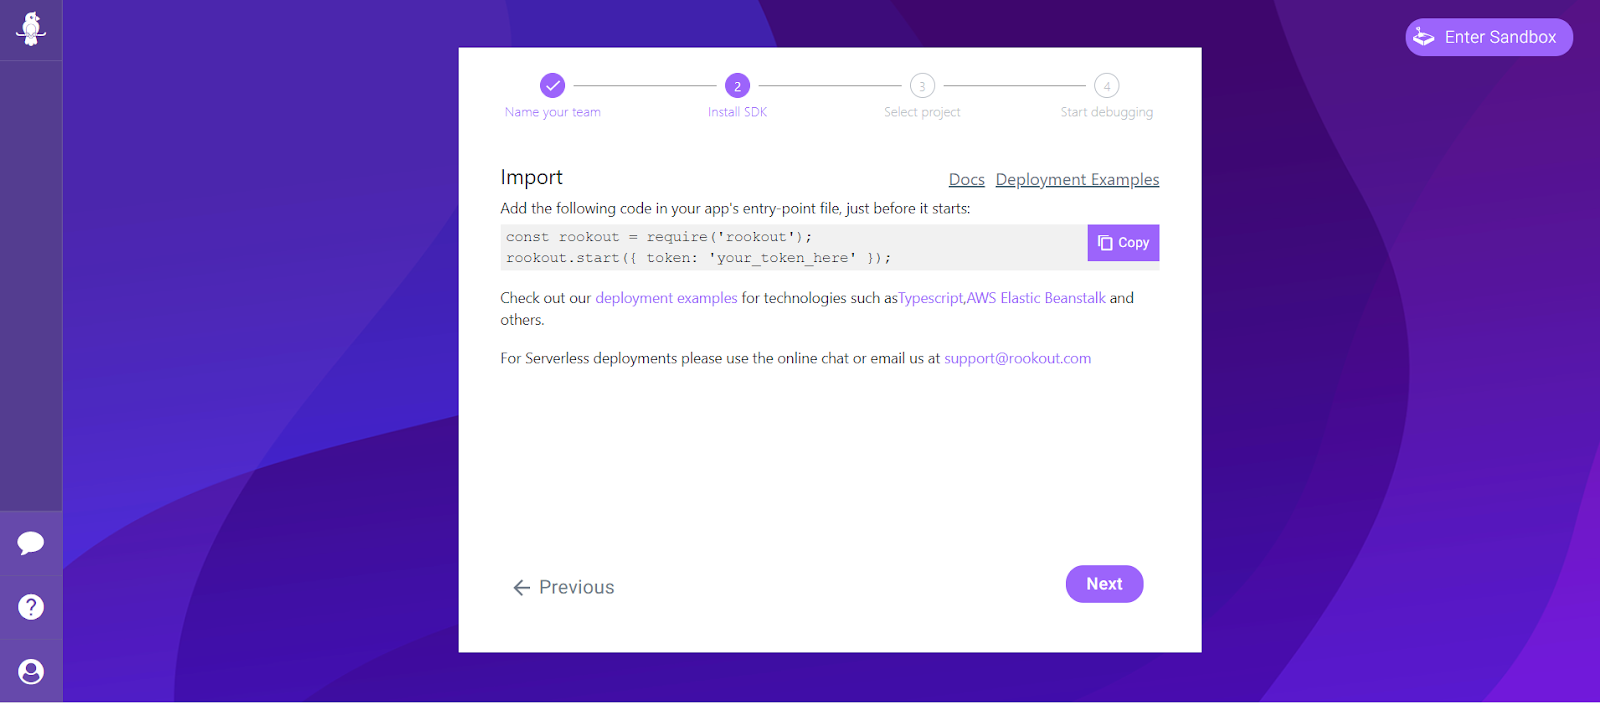
If you want to get started and use it within your application, all that has to be done is to install the SDK for your programming language and include your token (just like the below example).

Remote debugging SDK agent install

There are plenty of examples of different types of architectures and languages, including Java, from which you can choose.

A simple solution

As the above examples show, Rookout allows you to debug your software remotely in production. Rookout saves the user a lot of configuration steps by minimizing the configuration needed. All that has to be done is to simply add one line of code to their app’s entry file and – surprise!- that’s it. They are able to connect to their app without changing or configuring anything else.

You will also find that Rookout doesn’t affect your performance. In fact, it adds no more performance overhead than setting your own log line. Even better, Rookout is completely secure and never sees your source code, because the source code sits between your browser and your local file system or your git provider. The sources are only for you to see when you’re setting your breakpoint. It all happens in the Front End, so all Rookout sees is the file name and line number.

Further yet, with the capabilities Rookout affords, such as data extraction, debugging, and data pipelining, hours of work are saved, and debugging and logging times are reduced by 80%. As the saying goes “time is money” and Rookout saves you having to make that compromise. Save time and money with Rookout- no compromise needed.

Debug all day, every day

As the people standing at the helm of the future of technology (okay, yes, as developers of modern applications), remote debugging comes as a handy solution for everyday problems.

We have improved the architecture of our applications, as well as the way we write and distribute code, yet at the same time we must improve the way we troubleshoot these new services or the progress will look like an unprofitable solution.

The key is speed and ease of development. Thus, when it comes to remote debugging, choose a tool that can give you both.

Rookout Sandbox

No registration needed

Play Now

Table of Contents
Get the latest news

An Engineer’s Dilemma

Liran Haimovitch | Co-Founder & CTO

7 minutes

Table of Contents

Working with Rookout customers, I have noticed a significant pattern in how they describe engineering routines in the days before our software became a part of their daily workflow. It shows up in various engineering tasks such as developing new features, reproducing and fixing bugs, or even just documenting the existing system and how to best utilize it. It is also consistent across industries and tech stacks.

I want to take this opportunity to share this pattern with you, one which I find to be much in line with my own experience not only as an engineer but also as an engineering manager.

Facing the Paradox

As an engineering team working on an existing code base, your first and foremost source of truth is the code itself. After all, software documentation is notoriously difficult to maintain and is predictably out of date when you need it most. With manual labor traditionally being automated and placed in the code itself using modern software methodologies, such as Infrastructure as Code and Database as Code, this is even more prominent.

That being said, it’s important to remember that reading source code only tells half the story of what’s happening in the software as it’s running (and running it locally doesn’t help all that much, though that’s an entirely different blog post). This is where other data sources come into play, most notably the Observability and Monitoring tools such as logging, tracing, metrics, and BI in place.

Unfortunately, more often than not, engineers lack the data required to design and execute their day-to-day assignments to the best of their ability. Still, getting more data requires writing more code, getting it integrated, and deploying it to the relevant environment, all of which can be just as expensive (and sometimes as risky), as doing their assigned tasks in the first place. This brings us to the Engineer’s Dilemma:

Do I develop the task ahead of me with the information I already have, or do I develop a feature that will get me more data?

The road to understandability

Reading this, you might be wondering: what are the missing pieces of information that all those engineers can’t get without writing more code? Well, here are a few of the most notable examples we are seeing:

  1. User Behavior – engineers (and Product Managers!) are interested in knowing how the system is utilized in real-world scenarios. While APM tools often provide basic metrics, such as which APIs are called more often than the others, they provide little insight into what arguments are passed in, which users are using which parts of the system, or dozens of other questions that provide a better understanding of the application.
  2. Real Data – engineers need to know what data is flowing through and where it’s stored in the system. This is even more important with dynamic languages, NoSQL databases, and unstructured data, where even the types of data might be hard to infer from reading the source code. By seeing examples of real data in various parts of the code, engineering is able to gain a better understanding of the application.
  3. Dependencies – engineers are always wondering how the services integrated with their own software behave in different scenarios. Software applications are becoming ever more interdependent, both internally with the move from SOA (Service-Oriented Architecture) to Microservices and externally with many new SaaS offerings. By observing the interactions of those incoming and outgoing APIs, engineers can gain a better understanding of the application.
  4. Complexity – engineers are tasked with staying on top of their evolving codebase. As software scales, it is constantly repurposed and retrofitted to meet new requirements, causing the codebase to grow in size and complexity. New engineers who join the team might not be as knowledgeable about the codebase itself. As code becomes more complicated, debugging it offers unique insights into its behavior, allowing engineers a better understanding of the application.

Do The Job

The most straightforward approach for engineers when working is to do the job in front of them with the information they already have. Naturally, performing a task while lacking critical information is hardly the best way to go forward.

The classic example is when developers are attempting to resolve a bug. They find that the lack of data means they have little ability to pinpoint the root cause and have to quite literally change code at random in the hopes it may fix the bug. Worse, when lacking the data to understand and/or reproduce the bug, the team has no way to verify the bug has even been fixed.

Yet, even when developing a new feature, the shortage of an understanding of the existing code base and how it’s being used presents a hurdle for engineers. This means extra time and effort that will be spent on handling potential “what ifs” that might not even be relevant, all the while failing to address real issues that will inevitably arise in production. Overall, this leads to more expensive, slower to develop features that have higher failure rates when rolled out.

Get More Data

Alternatively, engineers can dive into the rabbit hole, chasing those missing pieces of data. Once such a missing piece of data has been identified, they then have to develop an entirely new feature, one that will collect for them the data they need.

While this is (usually) a relatively simple feature, it is a feature nonetheless. One has to figure out where in the code to collect the data, how to process it, and where to send it out to, be it a new logline, a new alert, or a new metric. The new feature has to be integrated into the software’s mainline, and then verified that it is working properly, alongside regression tests for the new version. Last but not least, the new version has to be approved and deployed by whatever organizational processes in place and such changes are associated with their own set of risks.

Unfortunately, even after going through this process, an engineer may find that he failed to get the piece of data he was looking for, or that the new piece of data doesn’t provide as much clarity as he was hoping for, and might have to endure this process again.

Over and over, we have heard software engineers and architects lamenting that this process is so cumbersome and expensive in their own organizations that individual contributors prefer to skip it and act on whatever little data they already have.

The Real Purpose of Observability

I’m sure at this point you are asking yourself: how this can be? Organizations spend a fortune on the aforementioned Observability and Monitoring tools. How can these tools fail to fix these problems?

Well, the truth of the matter is that those tools were never meant to solve those problems. The main use cases for those tools are to:

  1. Minimize Service Disruption: the most basic use-case is detecting service disruptions as fast as possible, alerting the relevant (on-call) personnel, and aiding them in understanding the root cause and restoring service.
  2. Optimize Production Performance: the more advanced use-case is detecting performance bottlenecks and anomalies, as well as providing operations and engineering teams insights into why and where they are occurring.
  3. Auditing and Logging: another big use-case that provides long-term outputs of the system for consumption by customer-facing representatives such as technical support, as well as storing those logs for security and compliance purposes.

There’s a very good reason the use-cases above have been prioritized and solved by these tools. The financial incentives for solving those problems are very clear and ROI calculations tend to be very straightforward. At the same time, these use-cases have little to do with the day-to-day work of the majority of the engineering workforce.

Solving the dilemma

I have seen this pattern come up time after time in every organization we have worked with. Day after day engineers make suboptimal choices based on poor information, due to the sheer difficulty of collecting additional data to educate themselves. Besides causing a deep individual frustration, this has a big impact on software development velocity and quality.

That’s the very reason I founded Rookout. We strive to empower engineers to collect the data they need on the fly while maintaining all the software parameters including correctness, performance, availability, security, and compliance. Reach out to learn more about the huge difference this can make for you.

Rookout Sandbox

No registration needed

Play Now

Table of Contents
Get the latest news

Devs Who Inspire Us (Who Happen to be Women)

Tal Koren

8 minutes

Table of Contents

Honestly, we didn’t need International Women’s Day to chat about these devs. We follow their knowledge leadership, tips, and tutorials all year long. In tech, gender is irrelevant; innovation is the name of the game. These strong, brilliant, brave, charismatic, humorous, and intelligent women are laying the stones for the road to the future of technology. Also, we needed a break from the COVID19 chatter.

We picked who we believe to be changing the name of technology. They embody the true meaning of the word “leader” and are our heroes in not only their knowledge and ability to create new tools and projects, but also in their ability to inspire people everywhere in the fields that they have established themselves as experts in.

Meet The Devs

Sarah Drasner

Looking for cool dev-related content? Sarah Drasner is the one we go to! We’ve been following Sarah ever since she started speaking way back in 2015, which resulted in her writing for CSS Tricks, and eventually being a Staff Writer. She even interviewed Una Kravets, who is also on this very list!

Sarah is a key figure in organizations, gives workshops to spread her carefully culled knowledge, takes part in open source communities and library maintenance, but most importantly- has an awesome Twitter profile which we, along with many in the dev community and beyond love to follow, because it’s just that remarkable.

One of Sarah’s most insightful talks in our eyes, is the “SVG can do that?!” talk, where she goes into great detail about how you can style SVG icons, handle typography, utilize physics with animation, while playing around with JavaScript libraries/frameworks like React and Vue.js. Some of the things she does in this talk are still mindblowing to us.

Drasner is an award-winning speaker, Head of Developer Experience at Netlify, Vue.js core team member, former Cloud Advocate at Microsoft, and co-founder of Web Animation Workshops with Val Head, among many other roles. She has ultimately worked 15 years as a web developer, while at times working as a Scientific Illustrator and a Professor in the Greek Islands, as if all of her previous experience and accomplishments weren’t cool enough.

Una Kravets

Una Kravets is a voice of inspiration for techies everywhere; it’s her defining factor in her influence on the dev world. We can’t get enough of Una’s creative content, talks, and podcasts. Her ability to combine tech and design is unparalleled and we’re always looking forward to what she comes out with next.

We remember discovering Una’s blog a few years ago. Her posts still spark a twinkle in our eyes, as she writes about CSS, Web standards, the past and future of the web in general and CSS in particular. A personal favorite of ours is the “On Learning and Comprehension” post, where she writes about learning, focusing on tasks, and basically getting things done; something all of us can relate to, developers or not.

The last time we saw Una, was at YGLF 2019. It was right after lunch when we sat down to see her give her amazing talk on CSS Houdini – a tool that lets developers tell the browser how to read and parse CSS. We were blown away to infinity by the mere possibility of a thing like that – and are still heavily inspired when we watch this talk today.

Una hosts a biweekly podcast called toolsday that covers cool tech tips and tricks as well as her web series: Designing in the Browser. Una is also the creator of Dev Doodles, an Instagram page that describes dev terms or concepts and mnemonics to remember them by in small doodle pictures.

Tamar Twena Stern

We first encountered Tamar approximately two years ago when we went to a JavaScript Israel meetup. It is one of the longest-standing meetup groups in our area and is run by fellow developers who give insightful lectures. Tamar was at the conference, giving a talk about the JIT Compiler used by Node.js, and the Chrome’s V8 Engine used to actually run Node.js. It didn’t take long until we were absolutely immersed by her descriptive insights about the way the engine utilizes optimization by using the Turbofan Compiler, and why using the ‘delete’ operator causes deoptimization.

A lecture of hers that really captured us was “A Journey into Node.js Internals”, filmed at one of the JavaScript Conference events. It includes a wide overview of some of the Node.js internals, be it the event loop’s different phases and how it enables non-blocking IO, the JavaScript “single-threaded” nature, the JIT compiler and Chrome’s V8 Engine, or the memory leak detection.

Tamar Twena Stern has a special capability to reach others through her talks. With over a decade of experience in server-side to mobile, web technologies to security, as well as big data, Tamar has established herself as a tech guru, especially when it comes to Node.js server architecture and performance.

Lea Verou

We are long-time fans of Lea Verou, even before Rookout was founded. We remember reading her blog posts more than a decade ago; some of them even include references from “The Matrix” in them, which we absolutely cannot resist. It’s inspiring to see how much creativity, enthusiasm and ambition a person can have, especially when used as a way of contributing to a community (in this case, the dev community).

Lea has authored the book ‘CSS Secrets: Better Solutions to Everyday Web Design Problems’. She works at MIT’s Computer Science and Artificial Intelligence Lab, where she researches how to make web programming easier (did we mention she’s our hero?). Lea has given over 100 invited talks at different web development or web design conferences and is a strong advocate of open source (which is something close to our hearts), having started several popular open source projects and web applications, such as Prism, Awesomplete, and Mavo (her research at MIT), among others.

One of her many given talks is the “More CSS Secrets: Another 10 things you may not know about CSS” at W3Conf 2013, which to this day continues to boggle developers’ minds, as they discover CSS tidbits unknown to them before; especially things related to animation and CSS Gradients. Also, as fans of peculiar tools (some of our engineers really love CSS, Vim & Regex; don’t ask), we noticed that making those tools more approachable to developers by demystifying them is of great service to the community. Lea does just this, both by being an advocate of CSS and by giving a brilliant presentation on what Regular Expressions are and why they aren’t as frightening as they seem.

Sarah Novotny

We’ve been following Sarah Novotny’s path for quite a while now. Being huge fans of microservices, it’s only natural for Sarah to be one of our favorite developers and tech leaders to follow. We especially like her insights about why open source is more important now than ever, since we’ve also noticed that our clients need the ability to freely choose which combination of services will best meet their needs over time. Being a big fan of open source, Sarah also joined the Kubernetes Podcast for an episode focused around the evolution of Kubernetes, governance models, and how open source communities can learn from it.

Sarah Novotny is a leader who manages to influence all areas of the dev world. She wears many hats as the leader of the Kubernetes Community Program for Google, the co-founder of Blue Gecko, and as a technical evangelist for NGINX, to name a few. Sarah is a leader for all: in her free time, she serves as the Open Source community champion in various communities and runs large scale technology infrastructures. She also speaks and writes regularly about technology infrastructure and her true passion: geek lifestyle (our two favorite words!). Her unique capabilities and experience have given her the platform to create and inspire, influencing devs worldwide.

Michelle Noorali

We’re huge rock fans, and this is one of the reasons Michelle Noorali’s “Highway to Helm” (a pun at AC/DC) talk made us turn up our speakers even more. We first encountered her giving this very talk almost 3 years ago, where she introduced everyone to Helm, a tool that helps you manage Kubernetes applications, be it installations, upgrades, and much more. Since then, she has been one of the most prominent voices spearheading the Helm project, and currently sits on the Kubernetes Steering Committee. We absolutely can’t get enough of her.

Michelle Noorali is not only leading the way in the dev community as a dev herself, but also as an advocate and creator. Her day job is being a Software Engineer at Microsoft, though she often spends the rest of her free time advocating for strong distributed systems and working with Draftcreate, CNAB, and Service Mesh Interface to bring new technology to life. Michelle is passionate about end user experiences and the impact of open source software. Her love of what she does has enabled her to become the force that she currently is in the dev world.

Looking Forward

We were excited about these awesome techy devs because they’re inspiring the tech world to always go one more step forward, reach a bit further, and think a bit bigger and brighter. We are honored to be a part of and witness to the ingenuity, talent, and growth that these fantastic devs engender. And that’s it. Happy dev binging 🙂

Rookout Sandbox

No registration needed

Play Now

Table of Contents
Get the latest news

3 Takeaways from the O’Reilly Software Architecture Conference

Josh Hendrick | Senior Solutions Engineer

4 minutes

Table of Contents

Last week the Rookout team, myself among them, participated in and sponsored the O’Reilly Software Architecture Conference in New York. New York is a city I personally love – the energy, the food, and the views are always top notch- there’s really just no comparison to the city that never sleeps. On top of that, I had the  opportunity to mingle with some of the brightest minds in software architecture from many of the most successful companies in the world. Mix all of that together, and you really couldn’t dream up a better week.

As usual, there were many vendors and talks throughout the conference that focused on modernizing software architectures, discussing new trends in the industry, and of course strategies on building and deploying cloud native applications. The week went by in a blur, but now that I’ve had a few days to rest my feet and lean back into the chill California lifestyle, let me share with you a few thoughts from the conference this past week.

It’s Time to Accelerate

As we talked to people from the many companies who stopped by the Rookout booth- shoutout to all those who did, we hope you’re enjoying your Rookout swag!- one thing seemed clear: organizations are extremely eager to adopt new technologies that can save them time and accelerate their development process. Of course, developers have always wanted to optimize their processes, but more and more we’re seeing organizations put big money and specific focus around cutting edge tools that can help them improve the software delivery experience. And as we know, developers want to go where they can work on cool, cutting edge technologies with progressive learning based cultures. I mean, honestly, who doesn’t?!

It’s definitely evident in today’s market that software developers and software architects are in demand and organizations are realizing that spending money on automation, efficiency, and productivity tools is not only an investment in their company, but also an investment in those developers and their quality of life. Today, organizations are not only trying to build brand loyalty for their company or product, but also trying to build work environments that drive internal employee loyalty. Organizations that do those things well are the ones that thrive over the years.

Drifting to the Future

As we all know, there has been a huge push to the cloud over the last 5 years. Organizations are going all in on migrating applications to cloud providers that promise cost savings in infrastructure and avoidance of managing costly on-prem data centers. The talks and workshops at O’Reilly definitely echoed this with many of them giving attendees views on architecting applications for the cloud. Now that cloud computing is no longer an afterthought, organizations are putting resources and spending into cloud native technologies that can both ease migrations as well as allow them to operate more efficiently in cloud environments.

In an interesting talk by Pivotal, Nathaniel Schutta explained that it’s not always just about technology, but rather company culture that plays a huge role in determining the success of the adoption of cloud computing as well. Yes, adopting things like Kubernetes, containers and microservices may be part of the journey, but culture often times needs to fundamentally change with such a dramatic shift in strategic business decisions involving new technology. As we continue to push the boundaries of what’s possible with new and evolving technology, don’t forget to focus on effective communication, transparency, and of course, leave time to make mistakes along the way.

Service Meshes have gone Mainstream

What would an architecture conference be without the mention of service meshes? With microservices taking over as an architectural pattern of choice for many companies, service meshes can play a critical role in some of the key challenges which microservices bring about in the areas of service-to-service communication, security, and monitoring. In particular they provide a way to simplify network communication in a consistent and secure way across services while giving hooks into your existing monitoring systems. When you’re building distributed applications at scale, service meshes can bring a lot of simplicity to your overall architecture.

This year O’Reilly brought some great talks from folks from Google, Buoyant (the makers of Linkerd), and many more. Megan O’Keefe from Google talked about how Istio (an open source service mesh tool) can help to manage service interactions across both containers and VM based services. In addition, Charles Pretzer from Buoyant got into the benefits of using Linkerd as your session mesh platform of choice. Organizations adopting Kubernetes are finding huge amounts of value when deploying Istio, Linkerd, Consul, or one of the other service mesh solutions in their Kuberentes environments.

All in all, it was a great conference with the team at O’Reilly this year.  There were many thought leaders in the building and we had the pleasure of talking to many of them throughout the week and in direct conversations at our booth.  It’s truly an amazing time to be in the world of software — the tech future’s looking brighter than ever –and we look forward to many more years of engagement with the O’Reilly community.  We’re looking forward to seeing everyone at O’Reilly 2021!

Rookout Sandbox

No registration needed

Play Now

Table of Contents
Get the latest news

Debugging Workflows Two Ways

Hannah Culver

6 minutes

Table of Contents

Today, service architecture is becoming increasingly complex with the explosion of new software techniques such as microservices. Zhamak Dehghani, a principal technology consultant at ThoughtWorks, shares why organizations undergo such a transformation:

“The ones who embark on this journey have aspirations such as increasing the scale of operation, accelerating the pace of change and escaping the high cost of change. They want to grow their number of teams while enabling them to deliver value in parallel and independently of each other. They want to rapidly experiment with their business’s core capabilities and deliver value faster. They also want to escape the high cost associated with making changes to their existing monolithic systems.”

However, the performance of a system often is dependent on engineers’ ability to debug gnarly problems. The increase in complexity that comes with new microservices architectures makes debugging that much harder. In fact, some companies are considering reverting back to monoliths because of the increased difficulty of debugging, among a host of other challenges.

Luckily, there are some best practices for debugging that you can keep in mind that are specific to your organization’s architectural model: monolith, or microservices. Of course, everyone’s taste in workflows is as different as to how they take their coffee — the taste is often acquired — but these practices can help you adopt a high-level mindset that accelerates debugging in the context of your environment.

The monolithic method

Debugging in the context of a monolith is how most of us learned to debug — it’s tried and true, just like half-and-half and a spoonful of sugar in a strong cup of Folgers. Broken down on codementor and supplemented by Simple Programmer, this debugging workflow (called active debugging) goes a little like this:

  1. Reproduce the bug: You can’t fix something you can’t find. Worse yet, if you can’t trick the system into reproducing the bug reliably, it’s likely you don’t really know what’s causing it. There’s something missing…  So you sit and think. And you get an idea (or two, or three!) of what could be causing the bug. 
  2. Write a unit test: Next, it’s time to write a unit test that focuses on those potential problem areas. Good unit tests should be easy to write, readable, reliable, and fast. Remember, your bug is still out there! Once you’ve written your unit test, it’s time to check it. 
  3. Check your hypothesis: Now, if you’re lucky, your unit test has discovered the elusive bug. But if your unit test passes, no worries. As John Sonmez from Simple Programmer writes, “Every time you write a unit test and it passes, you are eliminating possibilities. You are traversing through your debugging journey by locking and closing doors behind you as soon as you find out they are dead-ends.” Keep plugging along!
  4. Teamwork makes the dream work: If you run out of options and feel trapped, it’s time to call a friend. Your colleagues may have dealt with a similar bug before, and hold the key to your freedom. Even if they don’t have previous experience with a similar issue to draw upon, fresh eyes can work wonders.
  5. Write it down: You fixed the bug! Now, you need to write down your process. Make sure that if something like this happens again, you and your teammates have the information needed to fix it without so much effort. This step can also mean verifying that the fix works, and writing a regression test. Precautions like these can help prevent further issues.

Now, you might have noticed that we don’t mention pulling up your trusty debugger. With monoliths, it’s quite possible that you won’t need one, or at least you don’t need one right away. Opening the debugger right away is, according to John: “like when your car breaks down and you don’t know jack shit about cars, so you open up the hood and look for something wrong.”

If you want to use your debugger, or if the bug is too difficult to write a unit test for, then it’s time to rely on that trusty tool. But the key to the monolithic approach is critical thinking and unit tests.

The microservices method

The microservices method is similar to a latte: same basic ingredients, more complicated method of caffeination. Debugging microservices uses a lot of the same practices as with debugging a monolith, but with one major exception: the debugger is almost always necessary.

First of all, the many communicating parts of microservices make it much harder to reproduce a bug because it’s difficult to trace it back to the source. Additionally, logging is decentralized and harder to decipher, making active debugging a massive chore. As Rookout team member Maor Rudick writes in an article about production debugging, “This is not only time-consuming, as you will have to access and sift through many log files, but it’s also often necessary to write additional logs, and then redeploy and restart your application, just to get additional data.”

So it’s time to utilize passive debugging. According to Daniel Bryant, “The advantages of this approach is that debugging can be unobtrusive (i.e. a user’s request to an application is not paused or blocked during the debugging process), and the cycle of hypothesis identification and testing via setting multiple breakpoints can be rapid.”

Now that we’re doing passive debugging, what does the workflow look like? According to SREs Liz Fong-Jones and Adam Mckaig, it may look like this.

This doesn’t appear to be too different from the monolithic workflow; you still need to formulate hypotheses, create the fix, and verify that it worked. However, the formula/test hypothesis and develop solution steps will almost always require a debugger to find where the issue is. So opening up the debugger might now be your step one. If you can reliably reproduce your error without it, using the debugger tool might move to step two. However, it will be extremely difficult to move on to writing unit tests without it.

So has the traditional workflow been totally abandoned? Not at all. Developers comfortable with the monolithic method can relax a little. The transition to microservices won’t turn debugging on its head, but it will require an alteration to your workflow. Certainly the communicating parts of a microservice-based system complicate debugging, but your workflow can remain clean with the addition of a debugger early in the process.

So, how do you take yours?

Like trying someone else’s coffee, debugging with an unfamiliar workflow is something most people tend to avoid. You like it your way, and you’re comfortable with what is familiar.

Debugging microservices is difficult — it requires patience in working through problems that could be caused by numerous factors, and often takes testing incremental changes. However, as outlined above, there are steps you can take to adopt a more systematic approach by upholding processes. Of course, it’s important to find your own workflow based on your architectural model and tooling.

Finally, share your debugging fixes with your coworkers! While your workflows may differ slightly, documentation is always essential so you and your team spend less time wading through similar defects in the future, freeing up time for the things you enjoy.

Rookout Sandbox

No registration needed

Play Now

Table of Contents
Get the latest news

Groove Out to Rookout

Rookout

1 minute

Table of Contents

What do you listen to while you code? 

With Valentine’s Day right around the corner, this year we thought of a different Valentine’s gift: a playlist while you code!

We thought it would be cool to share a playlist with each other of what we listen to while we build Rookout

Yeah, true, it’s a bit random, ‘cause we each pitched in to make sure our individual style is captured. Feel free to add to it – we’d love for you to join our mix!

Listen to it, share it with your friends, your loved ones, and dance around with your pets to it. Even use it for your next office Karaoke night (yeah, Bob, we’re looking at you). There’s no judgment here- the world is your soundtrack!

Rookout Sandbox

No registration needed

Play Now

Table of Contents
Get the latest news

Fantastic Bugs and How to Resolve Them Ep2: Race Conditions

Or Weis | Co-Founder

9 minutes

Table of Contents

Come, come sit! Let your weary legs rest, the journey can wait, fellow developer. Have you had a second breakfast yet? You really should have one, but you must be sure you finish your first breakfast, first; Otherwise, there can be quite a race condition in your stomach.

But don’t worry fellow code-traverser, you’re in good company. I can teach you every secret of the trade regarding those pesky bastards. Starting from the very basics, through how to intuitively identify them, and finally, the best practices of how to resolve them.

What are race conditions?

What are race conditions you ask? Well, let me tell you. A race condition is a scenario where two or more flows take place concurrently, affecting one another in an unplanned manner and often manifesting as a bug. Race conditions are the most natural and most common bugs to be found in asynchronous systems (e.g. multi-process, multi-threaded, multiple microservices).

Race conditions are often encountered in the wild. A classic example used to be found in some old Coca-Cola vending machines, where a customer could get two cans for the price of one. The machine would release a soda can just a fraction of a second before it decreased the amount of money saved. Then, a second click on the “buy a can” button would pass since the check for “is there enough money for another can?” would succeed in the time between the approval of the first can and the payment subtraction.

Let’s look at how the code for a vending machine like that might look like using this React JS example:

Try it yourself, put in $1 and try and see how many cans you can get for it.

At first glance, the code seems ok. When the user buys a can (via the buyACan function) the money counter is checked for sufficient funds, and only then does the machine continue to produceACan.

Things in this code get tricky when setTimeout is introduced. This function asynchronously executes the code it is given, after the set time (in this case 500 milliseconds). One can imagine a developer adding these to the code to enable a flashing message feature, displaying text for a brief moment while the machine is working. This simple and seemingly cosmetic change creates a bug that ruins the most basic functionality of the machine.

In the 500 milliseconds between the call to the setTimeout which will update the money-count via setMoney, setCans is called once – outputting one can. So far so good. But now, when the user clicks the button again, the flow repeats and since setMoney hasn’t been called yet, the condition passes again and another can is released. Now that’s not good for business.

The example above is, of course, a simple one. It can be simplified even further — the bug is resolved by moving the call to setCans into the setTimeout callback — and yet it is still easy to miss. Real-life race condition bugs are often far more complex and frequently involve multiple moving parts, each adding more obscurity to the whereabouts of the bug.

Intuiting race conditions

Race conditions can indeed be tricky to spot and combat, but an experienced developer can recognize a race condition miles away. The secret is not to look for certainty but to notice the facts pointing to a race condition as the likely cause, and then hone in on it. As you probably already know –  the treasure intuition to spot race conditions was inside you all along!

Credit: Nedroid Picture Diary

Here are a few rules of thumb to help you intuitively realize a bug you’re working on is likely a race condition.

Sporadic

The bug is sporadic, i.e. it doesn’t appear every time the code runs or its side effects keep on changing. Being sporadic is an attribute race conditions share with Heisenbugs (see Fantastic bugs and how to resolve them ep1: Heisenbugs). In fact, race conditions might be Heisenbugs as well. In fact, a large percentage of Heisenbugs are race conditions or have a race condition aspect to them.

Performance dependent

The bug appears more/less often due to resource utilization (CPU, network, disk). As their name hints, race conditions are all about speed and conflicts in time between two or more async components. As a result, things affecting performance and execution speed will affect the race condition.

Asynchronous nature

An async flow is a prerequisite for a race condition. If the code has a high dependency on asynchronous components, the likelihood of a bug being a race condition increases. Common design patterns that are indicative of race condition likelihood include Microservices, Worker threads, async-queues, readers/writer locks, spinlocks, promises, timers, pub-sub.

First times

Implementing async flows well can be challenging even for experienced developers. Code written by devs implementing async flows for the first time should be suspected to contain race conditions. These may include networking, and basic threading/multi-processing code, on top of the design patterns listed above. Git blame, ‘git ask’ “is this your first time?”, ‘git forgive’ the young fool.

Time-dependent

The bug is time-dependent, e.g. happens a certain amount of time into program execution. Under similar constraints, race conditions have a tendency to repeat in cycles; these cycles are usually a result of the relationship between the async components. This is often the case when using patterns like worker threads, or async queues. The bug’s effects surface when the queue fills up.

Identifying the root cause of a race condition

Of course, the battle to vanquish race conditions doesn’t end by detecting them. The task still requires identifying the root cause that brought the race condition into existence. Turning to classic debugging is a solid option. Setting a good old breakpoint can be just the thing to get to the bottom line of a suspected race condition, but this can be tricky for two reasons.

The first reason is Replication. As we discussed before, race conditions are highly affected by the execution environment. This can make replicating the bug in a local environment extremely difficult. Worse still, even if we do manage to replicate the bug or, more accurately, an aspect of it, we can’t be sure of the precision of the replication.

The second reason is async behavior. Async flows are notoriously hard to debug with classic debuggers since setting a breakpoint and stopping one thread won’t stop the others. This will often affect the pace of the race or worse, throw the entire system out of balance. Due to this point of friction, regular debuggers often turn race conditions into Heisenbugs.

Addressing race conditions with minimum effort

While it may be tempting to turn to the dark-arts (necromancy and Test-Driven-Development 😉 ) do not despair. Here are some sure-fire ways to address race conditions with restrained effort:

Static analysis

The complexity that creates a race condition starts with the code running. Much of this complexity can be ignored by, well…simply not running the code. Reading the code and looking for the main suspects mentioned in the intuition section of this article, can not only identify a race condition but also its root cause. Combining this with attention to bottlenecks (e.g. shared resources, locks), and perhaps even old-school trace tables, can take us a long way.

Async reduction

Unlike with other, simpler bugs, reducing the application (i.e. gradually removing code until the bug disappears) won’t work so well. This is due to the cascading nature of race conditions. Instead, we can perform the race condition equivalent by removing async flows from the code and replacing them with synchronous ones. We can go through this process and replace flows with mock flows, or implement synchronization mechanisms on existing flows. This is obviously easier to do when we have a local environment in which we are able to replicate the bug. However, if we plan well, we can also apply this technique to live environments. This means taking the time to go over the suspect code elements for reduction and planning the steps and the versions/deployments needed prior to starting the process.

Production debugging

Production debugging, the modern version of debugging with non-breaking breakpoints is a good alternative to old-school debugging. It solves the replication problem by working directly on the live environment in which the race condition first raised its ugly head. It also solves the async flow problem since non-breaking breakpoints do not require stopping executing, thus maintaining the basic temporal aspects affecting the race condition. With production-grade debugging solutions, we can hunt down the race condition, by simply instrumenting and intercepting the various suspect points, until we hit the root cause. It’s still good to plan out the search path in advance. If needed, this technique can be combined with the async-reduction suggested above.

Resolving race conditions

Once we identify the root cause of a race condition, we need to fix it. No matter the reason, situation, environment, or other aspects of a particular bug, the resolution will always be one of two. We either separate the concurrent execution threads (threads, processes, microservices, etc.) making sure they do not affect one another at all by removing the dependency on a shared resource, for example. Or, we synchronize them and make sure that the order of the interactions is regulated when they do interact with a shared resource.

For synchronization, we usually need to pick one of two options: locks (e.g. mutex, spin-lock, semaphore, etc.) and atomic operations. The decision here is mostly dependent on constraints, solutions provided by the existing framework (Server, DB, etc.), and performance requirements (the more locks, the slower the solution would run – at best). My recommendation for you, fellow bug-slayer, is to start with the simplest solution that resolves the race condition, making sure the beast is dead and gone, and then considering optimization.

As important as it is to resolve a race condition, it is even more important to make sure it doesn’t return in other execution scenarios, or whenever someone changes the code. With race conditions, it’s best to use defensive programming. RAII techniques (Resource acquisition is initialization) are especially useful, both for preventing race conditions in the first place and for preventing their return. By applying RAII to the shared resources and other suspect bottlenecks as well as to the execution threads themselves, we’d make it a lot easier for developers to read and intuit race condition risk, and a lot harder for these sneaky bugs to slip in.

Happy hunting and Happy travels!

Rookout Sandbox

No registration needed

Play Now