Rookout is now a part of the Dynatrace family!

Table of Contents
Get the latest news

Onboarding In Full Remote

Dudi Cohen | VP R&D

9 minutes

Table of Contents

When taking a look at how we had to change the way we work, going from seeing everyone in the company almost everyday into a fully remote mode, several challenges are apparent. I’ve written about some of the lessons I learned in having to manage my team remotely. My main concern, and I believe the concern of most managers, is making sure we’re staying on track. Our company is a train moving forward at high speed and we need to make sure it keeps going forward at the same speed without falling off the tracks. I’ve received several points of feedback about my previous blog post, mostly from other tech managers, and most of the feedback was centered on coping with new employees. My colleagues’ concern was the fact that they know how to keep that train running at full speed but are hesitant in making sure that they can get new employees to jump on that train.

Growing in uncertain times

The first thing to note is that the hiring process has changed. It is different in two aspects: how you recruit and who you recruit. The good news here is that your pool of candidates is now bigger than ever. Since your team is now anyways fully remote, you are no longer confined by geographical limits. Since no one is physically working in the office, you can hire that talent from Australia or Brazil. You can interview and hire candidates who live far away from where you’re based. In essence, the world is your oyster.

However, interviews have now become more of a challenge, as you won’t be able to meet the candidate in person and everything will probably be via a video conference meeting. It takes time to get accustomed to skipping the face-to-face interview, though there are many advantages to conducting all the interviews by way of a video meeting. You’ll be able to record all the interviews, get the next interviewers better prepared for the interview, and be able to rewatch the interview in case you want to revisit your thoughts.


With that being said, I believe the most important thing to note is properly preparing for the interview. Ask the candidate to use a front-facing camera, make sure he/she uses a computer and not a phone, and prepare the tools you’ll be using ahead of time (whiteboard tools, presentations, demos, etc).


Surviving the onboarding

If you try to methodically define the employee’s lifecycle, the first stage that they will experience is ‘survival’. Survival is the part in which he/she starts working in a new company and needs to show his skills, pick up new skills, and learn how to ‘get things done’ in your company.


Surprise surprise though- learning how to get things done for a new employee in a fully remote setting isn’t that different than in non-remote settings. Make sure the new employee has a buddy, a mentor, a go-to-guy- or whatever your company calls it. Have that mentor walk the new employee through the maze of his new position, shadowing him a lot at first, and gradually showing him the ropes. Things can get a bit tricky because communicating remotely isn’t that easy, but setting a regularly timed meeting can make things easier. Or, try a “what we learned today”, where they sum up every day together. Not only is it practical, but guaranteed your employees will be super close by the end of it.


What is often forgotten in the ‘survival’ stage is where they learn ‘how things work’ in your new place of work. And that’s not a part of ‘getting things done’. This is the part that includes the “how and where do we eat lunch?”, “can I talk to the CEO directly?”, “how socially acceptable is it to drink 3 coffees before lunch?”, and “who is supposed to give me permissions to this system?”. Now, in fully remote settings, we get a whole new bucket of ‘how things work’. And that bucket includes “how do I communicate with people?”, “is it ok to Slack call out of nowhere without a proper warning?”, “how available am I supposed to be when I’m working from home”, and well…the list goes on.


If we miss out on the fully remote section of  ‘how things work’, then that new hire will be lost. He will probably be in constant fear about whether he is communicating enough or over-communicating with his managers and colleagues. I’m guessing that looking ahead, in a few months or maybe in a year, most new hires will have that ‘fully remote muscle’ already trained and ticking. But, by the time everybody knows what ‘fully remote’ means, we will need to invest a lot of time in teaching them how it is supposed to work.

When fun, games, and perks aren’t enough

Remember the time that your employees stayed in the office for hours and didn’t want to go home? They stayed because it was fun and they enjoyed being there. Most companies try to make their office the employee’s second home (or sometimes it goes so well that it becomes their first home), from a fridge full of beers, endless food, to a gaming console. Some of the big ones even give laundry services and errand runners. The list of perks grows longer and always manages to surprise me.


Well, as of now, all of this doesn’t matter. Those beers won’t age well in the fridge and the gaming console might be obsolete with a newer version by the time you return to the office. But it’s important to note that the dominant factor that caused your employees to stay longer in the office wasn’t all of these. It’s because your employees had a tight social bond with their teammates, which made everything tick. They (gasp!) actually enjoyed spending time with one another. Coffee in the morning, eating lunch and dinner together, drinking beer together when smashing bugs – that’s all the fun for them. This bond helped your team work better. When everyone knows each other, and more importantly likes each other, they do the job not only for the company but for each other.


Getting the new hire into the company’s vibe and making him socially accepted is another challenge. This is quite a tough one when you can’t even eat lunch together (and eating lunch together via Zoom is quite lame, if we’re all being honest here).


Goal and vision

How can we compensate for the loss of the office that brings everyone together? How can the new employees wiggle their way into that tight social bond that your veteran team has? Unfortunately, I don’t think there is a magic recipe, though you can try to make it happen with always open Zoom rooms, online happy hours, and the like. But let’s be real- it’s not the real thing.


I think this is the time to get back to basics and invest your time as manager into the roots of team (or company) motivators. Your new employees won’t do the job ‘for the team’, because they don’t know them and will probably have a hard time getting to know them. You want your employees to do the job ‘for the company’ and ‘for the goal’. If, in the past, your company’s goal or company’s vision wasn’t clear and the social bonds compensated for them, well, this time you can’t get away with it. It is time to make sure your team- and especially your new employees – understand the goal and vision. Regardless of working fully remote, in times of uncertainty it is imperative to have a clear vision for the company and the team.

The “Why”

A good measure of success with setting goals and visions is to ask your employees ’Why’. Ask them why they are doing what they are doing. For your veteran employees, that answer might be ‘because it’s fun to work with all of my friends’ and that might be enough for the short term. However, for the long term and for new employees, that answer should be aligned with your company’s goal and vision. A good reference on the ‘Why’ and its importance is discussed in Simon Sinek’s book Start With Why (or if you’re short on time check out his TED talk).


Talk talk talk

The last tip I wish to share is about talking. You probably already know your current employees to the point that you can identify a sad or a worried face on them or be able to identify a sarcastic tone when they write via chat. When it comes to your new guys, it will take time to get to know them as well as you know the rest of the team.


The only way to get to know them is to talk with them as much as you can. However, when speaking with them, don’t focus solely on their tasks. Instead, speak with them about how their weekend was or how they’re dealing with the fact that their barbershop is closed. Talking with them about their personal life and engaging in as much small talk as you can will earn you two important things:


  1.  It gets them to open up and have them understand that they can talk to their manager about anything. By opening the floor to talk about their pet’s medical issues, it can also open up the floor for them to talk about their challenges at work.
  2. It helps you, as their manager, to better understand how they handle and react to challenges. By getting to know them, you’re better equipped to be able to identify their bad mood when they get a task they hate or can’t handle. Hiring new employees isn’t just about having them to do their job. It’s about being a part of the team, a part of the family. And that’s what a family does – they talk about everything.

Nothing new under the sun

As you’ve been reading through this article so far, you might have found yourself saying “Well, duh, isn’t all of this quite obvious?”. Well, yeah. I didn’t invent anything new. But regardless of this, all of these methods and tips should be practiced even when you’re not fully remote. In the past, you might have neglected some of them because everything went smoothly. However, it is now, in times of great change, that you must bring out and use the entire arsenal of your managing toolbox. Because as we know, the proper tools are key.


Rookout Sandbox

No registration needed

Play Now

Table of Contents
Get the latest news

Want To Release Faster? Address These Bottlenecks

Shawn Jacques

7 minutes

Table of Contents

Develop fast, release, learn, repeat. That’s essentially the (not-so-secret) innovation formula, right?

Most of us spend our time enhancing the products we have already released. We want to be innovative, releasing new features with the velocity of an unencumbered startup. Yet, we also have customers with quality expectations we need to meet.

Guidance on shortening release cycles often centers on adopting agile (or similar) development methodologies. But most companies are already there. This post addresses bottlenecks that emerge or still remain in agile-oriented processes.

Most DevOps processes have phases that look something like this:

Plan > Code > Build > Test > Release > Deploy > Operate > Monitor > (and back to Plan).

When attempting to accelerate releases, testing and debugging are two bottlenecks that slow everything down. Teams spend a lot of time creating, running, and fixing tests. When bugs are found, developers also spend significant time going through multiple deployment cycles.

For this post, I’ll highlight a couple of bottlenecks that slow down release cycles. I’ll also discuss how you can address them through faster, more stable automated testing and the right tools to pinpoint code-level malfunctions on the fly.

First, terminology

When I talk about faster releases, I don’t mean POCs or prototypes where the goal is to see whether something works to test a concept. They don’t need to scale and quality is a secondary concern.
Instead, I’m talking about releasing MVP (minimum viable product) features to your customers and then iterating with feedback to evolve them. Your customers expect functional quality. Bugs, even in an MVP feature, reflect poorly on the entire product.

Second, the case for quality

For many organizations, their application is their brand. When the application is useful and functioning, customer satisfaction rises, but when users encounter quality issues, they become dissatisfied and are more likely to choose alternatives.

The financial impacts can be significant. According to a 2018 Accenture survey, 48% of consumers have left a business site due to poor customer experience and purchased on another site.

Low quality can also impact customer retention. According to Frederick Reichheld, Bain & Co., it can be 6-7X more expensive to acquire a new customer than retain an existing customer. Boosting customer retention by as little as 5% can increase profits by 25-95%.

Bottlenecks to faster releases

There are many potential bottlenecks or inefficiencies in a release cycle such as a poorly defined spec, gaps in team collaboration, fruitless debugging, ineffectual testing, or manual steps between automated processes.

Let’s focus on two areas that slow down fast-moving teams: end-to-end testing and debugging. Why these? Typically, they are both very iterative and people-intensive.

Debugging can slow down releases in coding and testing phases. Debugging typically involves stopping the application, inserting a breakpoint, running the application, and digging through data to find the error.

Most organizations would agree that their software development teams spend a large portion of their time each week debugging issues that arise in new releases or on technical debt that slows down the time to release new software. When a new issue is found, it often requires backtracking in the release process, redeploying applications for further testing in lower environments, or constant loops between testers and developers where the typical response is often, “it works on my machine.” Through the use of a remote debugging solution like Rookout, teams can diagnose issues in the native environment where they occur (on-prem or in the cloud) and eliminate much of the back and forth time that happens between teams over the course of a release.

Testing can generate bottlenecks in two primary areas: the time it takes to author end-to-end tests, and time to maintain existing tests. Many QA automation engineers state that it takes two toand eight hours to write an end-to-end test on an open-source automation framework. QA teams also report spending 30-40% of their team’s time maintaining existing tests. Devs and automation engineers are critical and expensive resources. If they are writing tests, they aren’t writing features.

Failing tests create additional work to identify the root cause. Was it a bug in the application, a poorly defined test, or an element not found? Failed tests need to be fixed and rerun, adding time to release cycles.

When you couple a complete testing strategy with a powerful production-grade debugging solution like Rookout, your development and testing teams will have the ability to pinpoint and resolve new issues immediately and improve team velocity.

End-to-end tests

E2E tests manipulate the browser to simulate real user journeys. For example, an e-commerce application might use E2E tests to simulate a user searching for a product, viewing the results, clicking into details, adding an item to a cart, logging in, and completing a purchase.

The significant number of user journeys, devices, browsers, data (valid and invalid), as well as different network and server response times create a massive array of possibilities. Manual testing quickly becomes too slow and costly.

Yet, many organizations use manual testers rather than automating. In fact, in a June 2020 survey on E2E testing by Testim, 74.6% of respondents said less than 50% of their E2E tests were automated—including 12.7% who said none of their E2E tests were automated.

There are many commercial and open-source test automation frameworks for E2E testing. You can see a comparison of some popular ones in this blog.

A modern approach to E2E testing

Several functional, UI and E2E testing solutions use artificial intelligence to speed test authoring and increase stability.

Instead of coding tests that can take hours, a user flow is recorded and then configured in the tool. Now tests can be created and configured in less than 20 minutes, reducing the amount of time to achieve test coverage.

Here’s the cool part: these tools use AI to identify each element uniquely and lock it in. Rather than using CSS, propertyID, or XPath, tools like Testim capture information about the entire DOM to understand the application and the relationships between different elements. If one or more of the element’s attributes change due to an application update, the test will still find it, minimizing flakiness.

AI-based locators minimize test updates for minor code changes. Developers are free to experiment without breaking the UI tests. UI tests should work this way—simulating how a user would see the new button and act on it.

Work smarter to release faster

Release bottlenecks are caused by a variety of issues, such as slow test authoring and flaky tests that consume time and resources, as well as long and inefficient debugging cycles. Some organizations make up for inefficiencies by staffing up or using a variety of partial solutions—but that’s not a scalable model.

You need a combination of a test automation solution that enables fast authoring and adapts as your application changes, as well as a tool that allows developers to gain instant, laser-focused data from their code, allowing them to understand their code better and resolve issues faster.

The combination of proper testing and a production debugging tool will enable developers to be at the forefront of innovation. No more slow releases and wasted time. Fast innovation is the future, and it comes with this awesome pairing of two great tools.

AI-based test automation tools like Testim can help accelerate the authoring of functional and end-to-end tests with a record/configure/customize model. Faster authoring shrinks the testing phase and builds the coverage to catch regressions. The AI-based locators help improve the stability of the tests so that they don’t break with every code change. Rather than spending your time troubleshooting tests, you can focus on the application bugs.

Live production debuggers like Rookout can help speed up debugging by providing the data you need to diagnose a defect without interrupting the application. With a non-breaking breakpoint, developers are able to get the data they need from any line of code, even when their application is running live. This helps them skip the endless deployment cycles needed to get data to understand the source of their bug. Rather, they are able to build a deep understanding of the application to better interpret what’s happening in their code, fix it, and get back to shipping fast.


Rookout Sandbox

No registration needed

Play Now

Table of Contents
Get the latest news

Debugging Kubernetes Applications on the Fly

Josh Hendrick | Senior Solutions Engineer

8 minutes

Table of Contents

Over the recent years, software development organizations have seen a major shift in where they build and run their applications. Teams have transitioned from building applications that run exclusively on-prem to microservices applications that are built to run natively in the cloud. This shift gives businesses more flexibility as well as quick and easy access to enterprise services without the need to host costly applications and infrastructure. As part of this migration, many organizations have adopted the use of containers which aim to solve many issues developers have typically faced in portability and scalability of applications. Kubernetes has quickly become the defacto standard for container orchestration when building modern cloud native applications.

While the power of cloud native and Kubernetes based technologies promises organizations the ability to build software quickly and scale effortlessly, debugging these Kubernetes based applications can often prove challenging.

Traditional Challenges with Debugging Kubernetes Based Applications

One of the biggest challenges with debugging applications built to run in Kubernetes is that local debugging is a major obstacle for developers. While there are Kubernetes solutions like Minikube which allow you to spin up clusters locally on your laptop or desktop, the fact is that there are oftentimes major differences between Kubernetes platforms that make such an approach impractical. For example, if you’ve built an application and are running it in production in Google Cloud’s managed Kubernetes offering GKE, local testing in Minikube may be more trouble than it’s worth. Anytime you’re debugging, you ideally want an environment which mirrors your production environment as closely as possible.

Many developers choose to utilize local debugging options such as Docker Compose, which is a tool that allows the running of multi-container Docker applications. This approach allows developers to define a YAML file containing information needed to run the relevant services making up the application.  While this approach can often work well for local debugging, there are security and infrastructure specific conditions which might not be reproducible in a Docker compose environment when your production environment is Kubernetes. There are solutions which are being developed that aim to make local development easier, such as telepresence, but these require that you proxy into the network where Kubernetes is running, which could be a security risk.

Looking beyond the infrastructure itself, Kubernetes has many new commands and technical areas to become familiar with in order to effectively debug the services you develop. Debugging applications running in Kubernetes pods can be inherently difficult due to the fact that pods are ephemeral in nature and can be spun down anytime based on the Kubernetes scheduler (yes, even if you are in the middle of debugging one of them).

Real Time Debugging of Production Workloads

Looking at the debugging challenges above, it’s clear that there is room for improvement and potentially a better approach. One such approach, enabled by Rookout, allows for debugging applications live in their native environments by allowing developers to add “virtual” log lines on the fly and collect snapshots of data from those running applications. By simply placing a “Non-breaking breakpoint” on a line of code, developers can extract information typically only found in a local debugger from their applications without ever stopping them or needing to redeploy.

With this approach, developers can effectively debug their code by decoupling the code itself from the underlying infrastructure where it’s running. This allows teams developing applications for Kubernetes to focus on what their code is doing when a defect happens. Teams spend far too much time trying to reproduce defects in staging or pre-prod environments where attempts are made as much as possible to simulate the configuration of production environments. While this can be possible, it’s far more effective to debug and collect relevant data from the same environment where the defect occurs. Having a real time production grade debugging tool in place can dramatically improve the understandability of the code developers both write and maintain.

Deploying a Kubernetes Application and Real-Time Debugging

One of the best ways of understanding how real time debugging works is to take a look at a hands-on example. In this section, we will look at the following:

  1. Instrumenting a sample application with the Rookout SDK
  2. Deploying that application into a Kubernetes cluster
  1. Note: We’ll assume that you have a cluster provisioned and can connect to it with kubectl for this example if you want to follow along.
  1. Perform real-time debugging of the application

Instrumenting the Application

To start, let’s take a look at how the Rookout SDK is configured within an application.  This example will use a To-Do application written in Python.

  1. To start, open up the repository found here: https://github.com/Rookout/tutorial-python
  2. Next open up the app.py file
  1. Scroll down to the bottom of the file and take note of the following:

import rook

rook.start()

This is how you import the rook package into your application and tell it to start processing.  The SDK should be started just before the application begins executing.

  1. Note that the rook package can be installed via the following command:

pip install rook

  1. There is a Docker file inside the repository which allows you to build an image, but for this example, to simplify things we’ll use an image which has already been built and is hosted on the Rookout Docker Huge page here: https://hub.docker.com/r/rookout/tutorial-python

That’s all that is required to configure the Rookout SDK to work within an application.  In short, the Rookout SDK is deployed as a dependency of your application running side by side with your codebase. In the next section, we will take a look at deploying the application to a Kubernetes cluster.

Deploying the Application

Now, let’s deploy the application to a Kubernetes cluster.

  1. To start, you’ll want to clone the repository here which contains relevant Kubernetes YAML files for the Deployment and Service in Kubernetes: https://github.com/Rookout/deployment-examples/tree/master/python-kubernetes/rookout-service
  2. Before they’re ready for deployment we will make a few changes to ensure the correct environment variables are being passed to Rookout:
  1. Open app-deployment.yaml.  Notice we’re using the tutorial-python image from Docker Hub:

      containers:

      – name: rookout-demo-app

        image: rookout/tutorial-python

  1. Next, notice that we’re passing the Rookout token as an environment variable.  The token is a key specific to your organization and should be kept private.  We’ll be creating a secret key to store this in our cluster later.

        env:

          – name: ROOKOUT_TOKEN

            valueFrom:

              secretKeyRef:

                name: rookout

                key: token

  1. When using Rookout it’s also helpful to pass a label which is tied to your application instance so that when using Rookout you can filter on specific application instances or services that you want to debug or collect data from.  A label is simply a name:value pair which you can name as you see fit. To do this we’ll add one additional environment variable with a label:

        env:

          – name: ROOKOUT_LABELS

            value: “app:python-tutorial”

          – name: ROOKOUT_TOKEN

            valueFrom:

              secretKeyRef:

                name: rookout

                key: token

  1. Finally, we’ll create the Kubernetes secret and deploy the application:
  1. Create the secret:
  1. kubectl create secret generic rookout –from-literal=token=<Your-Rookout-Token>
  1. Deploy the application:
  1. kubectl apply -f app-deployment.yaml -f app-service.yaml
  1. And finally access the external IP address of our service:
  1. kubectl get svc rookout-demo-app-service

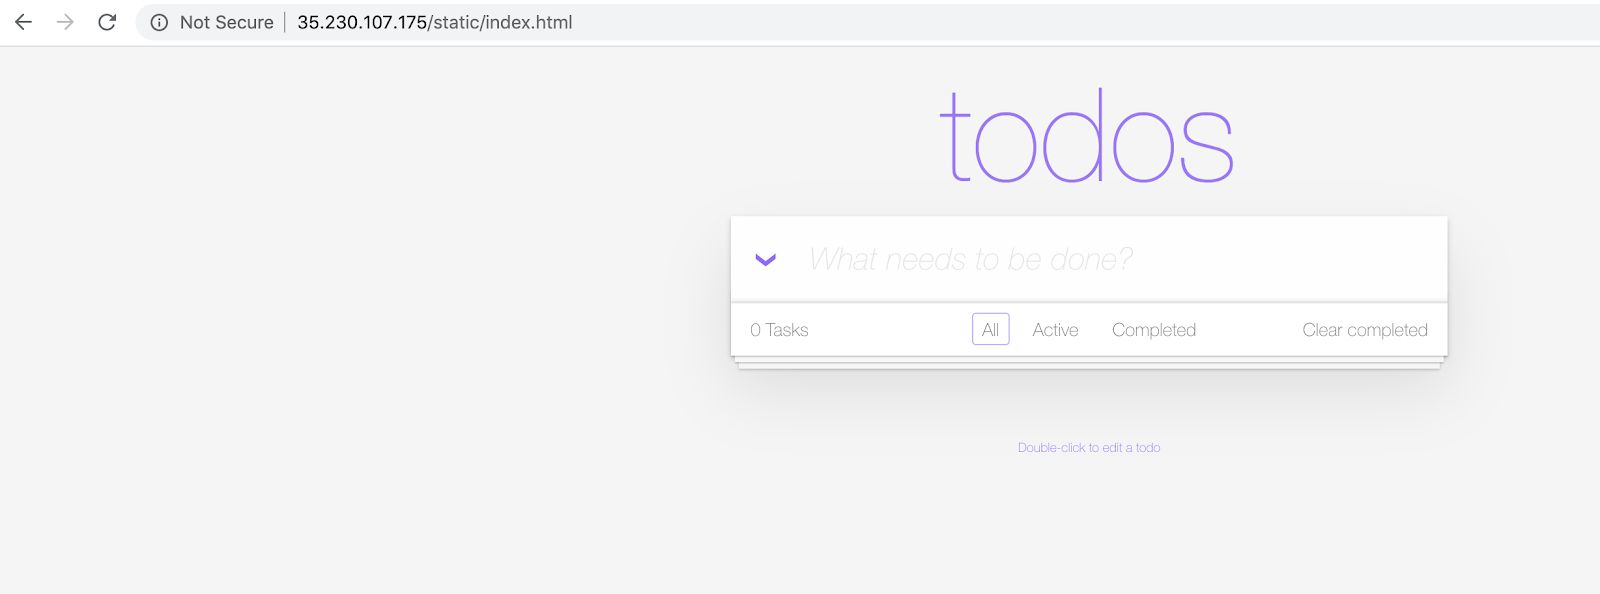
From here you should be able to access the To-Do application front end running in the Kubernetes cluster.

Real-time Debugging

Finally, we’re ready to debug the application while it’s running on the fly!

  1. After setting up the Rookout SDK and deploying the application, the connected Application instance should be viewable from the App Instances page within Rookout as shown below:
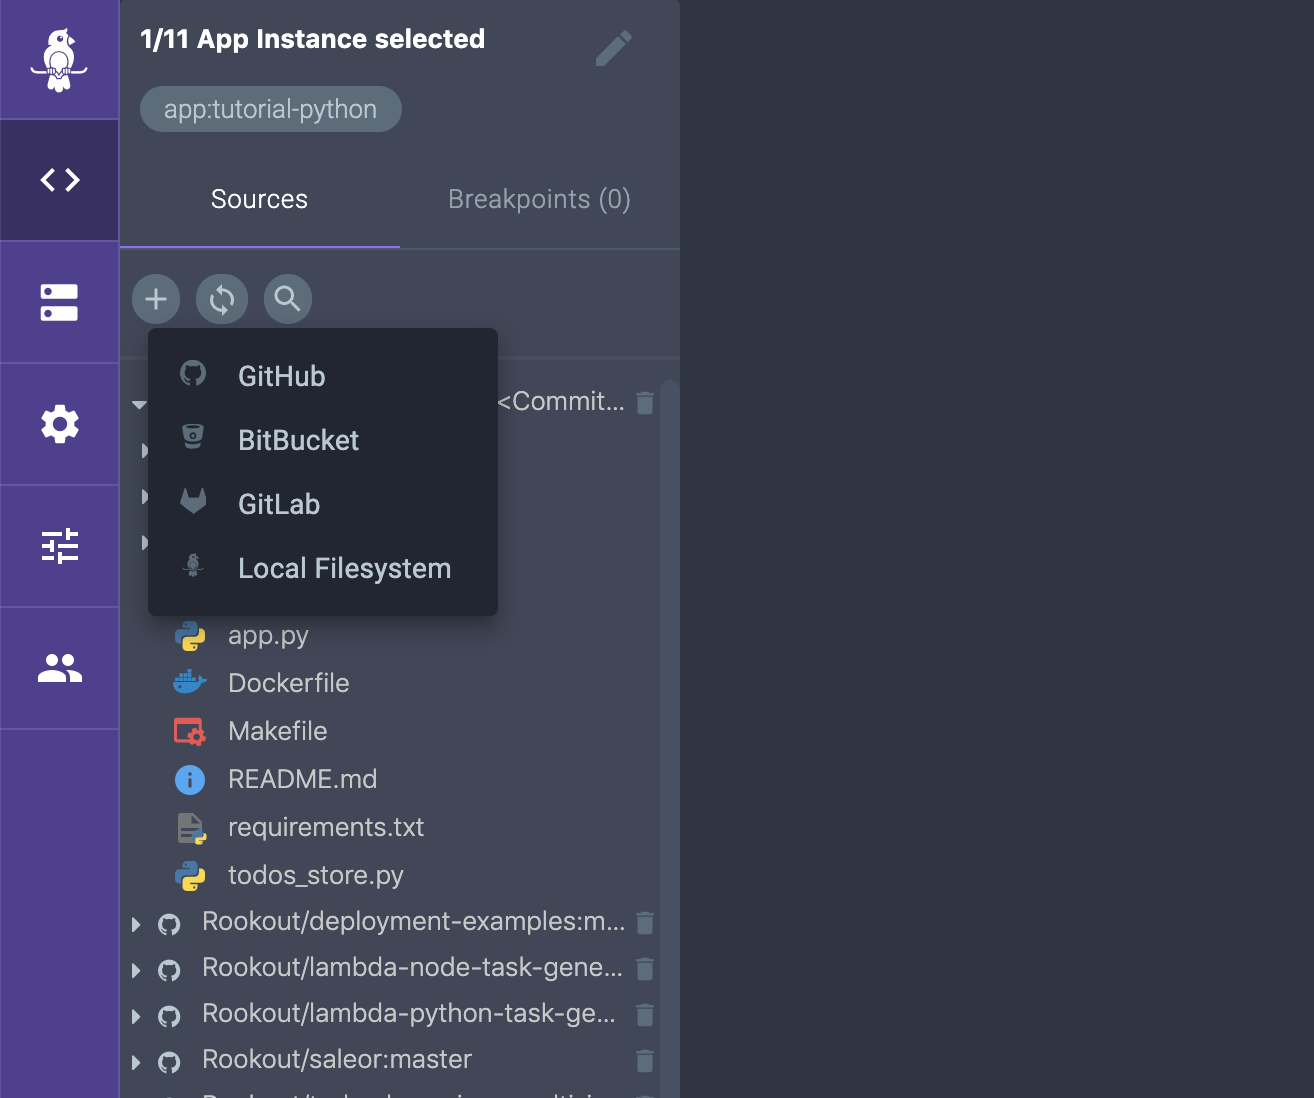
  1. From here the next step is to connect to your source code repository so that you can set Non-breaking breakpoints, or data collection points, within your running application instance.  Rookout can also be integrated into your CI/CD process so that your source code repository can be auto fetched based on the version of your code running in your test or production environment by setting two environment variables:
  1. ROOKOUT_REMOTE_ORIGIN=<your git URL>
  2. ROOKOUT_COMMIT=<commit hash of the code running in your environment>

Note that your source code never leaves your network and is never viewable by Rookout:

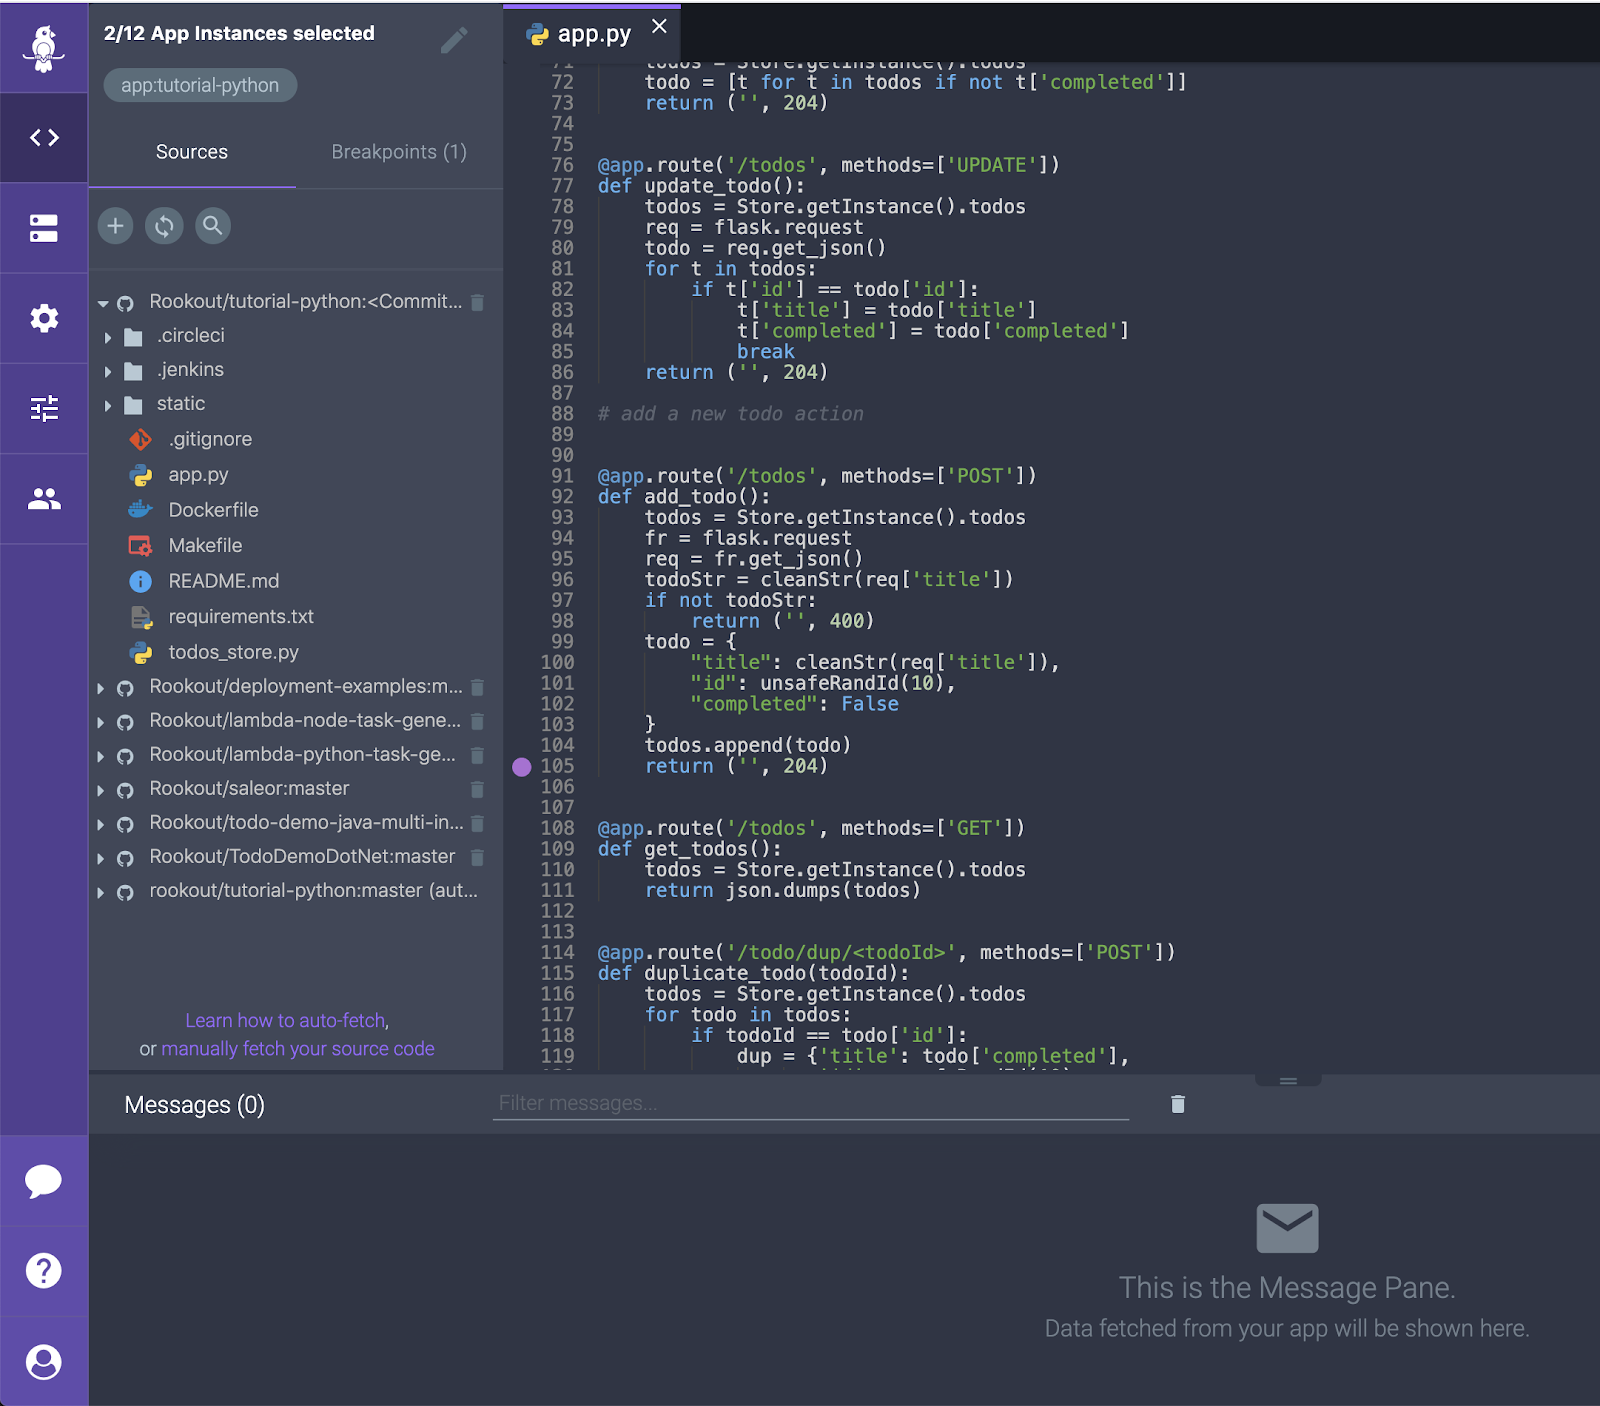
  1. After connecting the source code repository, a Non-breaking breakpoint can be set within the app.py file to collect data. In this case, the breakpoint is set at line 105 within the add_todo() method which will be invoked every time a new todo item is added to the list.
  1. Finally, we can add a todo item to the list with the todo application and get back a snapshot from the running system including all the local variables, server and process information, a stack trace, and tracing information:

Tying it all Together

And there you have it. We’ve shown how you can dynamically debug a live application running in a Kubernetes cluster just like you would with an application running locally tied to a debugger in an IDE. Just because you’re adopting new and cutting edge technologies that may have their own set of debugging challenges, it doesn’t mean that your development needs to slow down. Adopting new technologies that give deeper insight into what’s happening with running applications while they’re running in their native environments helps to increase developer velocity and improves the mean time to repair (MTTR) of often hard to reproduce issues. This in turn increases the overall understandability and maintainability of mission critical applications.

Rookout Sandbox

No registration needed

Play Now

Table of Contents
Get the latest news

Guide: Minimizing Waste in Your R&D Organization

Dudi Cohen | VP R&D

6 minutes

Table of Contents

Looking at modern software development practices, most of them aim at maximizing the output of your team and the quality of your software. Unless you’ve been living under a rock for the past 20 years you know of the agile development methodology and you’ve probably heard about the lean methodology. Both of these methodologies can be differentiated by a few factors, but they are pretty similar – they aim at delivering fast and to the point. These methodologies are heavily influenced by the Toyota Production Systems (TPS) which have revolutionized modern manufacturing processes.

You can perform better by looking at things that are broken and try to improve them ala Toyota’s Kaizen. But you can also ask yourself: what is your team wasting time on? What is my team’s Muda? Worry not, for we have the answer. The “Muda” is that wasted time on unneeded code, features that no one uses, and it’s also your over-engineered future proofed code.


What isn’t waste?

To better understand how you can reduce your team’s waste, you can begin by trying to define what isn’t considered waste. In agile methodology, the standard is continuously releasing software. Whether you’re Scruming or Kanbaning – you aim to release fast. The goal is to work closely with your customer and receive feedback on everything that you develop for them. When you deliver something to your customer and your customer wants it – that definitely is not waste. But what happens when you deliver a new version to your customer and they don’t want it? Well, that pretty much is waste. And even more so, that’s not only a waste of your time, but a waste of your customer’s and a waste of the code that’s been written. 

Defining a deliverable

A common definition used in both agile methodology and software development is the “deliverable”. A deliverable is a product that you can and need to deliver to your customers, mainly focusing on the value it gives your customer. A product (or a version) that you deliver to your customer, which has no value to your customer, isn’t a deliverable. Once you focus on working and developing only deliverables, your waste will be drastically reduced. When I look at a deliverable, I try to look at the parameters with which it should comply with:

  1. Customer value – The customers use your product (and hopefully pays for your product too) for a reason. They perceive the product as something that benefits them and which gives them value.
  2. Product strategy value – Your deliverable must help you understand how to develop your product better.
  3. Infrastructure value – Toyota might refer to this as “Nemawashi”. Laying the foundation for a change, or making a change possible in the future.

Each and every deliverable should create value for each of these 3 parameters.


Customer Value

This parameter is the easiest to look at and define. As I’ve mentioned, if you release a software version that your customer doesn’t perceive as valuable, they won’t install it, download it, and most importantly, they won’t give you any feedback about it. If you made your customer’s life better with your delivery, then that delivery isn’t a waste.

You might try to tell yourself, “Hey, what about if I fix a bug?”. Well, does that bug affect the customer? Did they experience any issues because of it? If the answer is yes, then they will perceive it as valuable. But if they didn’t experience any issue and that bug didn’t affect them, why bother them with it? If the customer will need to install or manually upgrade, they will never do it.

Let’s take a look at a simple example: your team has discovered a bug that causes an overload of resources in your backend and since you have autoscaling it doesn’t affect the user, but it affects your cloud costs. You can fix the bug, but your customer won’t upgrade. For the customer to upgrade you will need to add a new feature or improve something in your product in order to motivate the customer to upgrade.

Product strategy value

This one is pretty easy to ignore sometimes. When we develop our product we can sometimes be short sighted. We look at the current feature being developed and use all of our resources to make it happen. We often want to win the battle we’re fighting and not think about the war and our next steps. Looking at your product’s backlog, you will see a bunch of features that you need to develop next. Do you have all the data needed in order to understand how those features will look like? At what scale do these features need to handle? How will users know that these features are there? You can collect data and prepare in advance to your team’s next tasks. Start collecting this data now, add logs, add metrics, add mockups – add anything that can give you feedback on your current features and your future features. If you don’t collect this data, you’ll go blindly into the dark when you start developing your next features.


Infrastructure value

When you look ahead at your software’s upcoming challenges, you can usually tell that you’ll need a better infrastructure. You will be able to understand this sooner if you collect data when working on your deliverable’s product strategy value. Some tasks can’t fit into a two week sprint, but that doesn’t mean that you won’t create deliverables when working on them, though you will lay the foundation and start working on them while still delivering other deliverables. When managing developers, you often hear them saying “We can’t do this, we need to delete everything and start from scratch”. Starting from scratch is usually not possible, but there is an alternative: to rebuild or set your foundation brick by brick along your day to day tasks.

Try, as much as you are able, to set your foundation and improve your infrastructure one step at a time. Do this while continuously delivering new features in order for your future features to be achievable.

Measure your deliverables

When you plan your R&D roadmap, try to measure your deliverables. How many of your deliverables don’t provide value to your customers, product strategy, and infrastructure? A good balance of deliverables creates value to all three parameters and will reduce your waste, making sure you are always focused on the right path, ensuring that you will write less code that is thrown away and your team will be much more prepared for your future challenges.

Rookout can be used anytime in order to collect data and thus help you achieve your product’s strategy value. By enabling your developers to get the data they need, they’ll be able to focus on what your customers find valuable instead of wasting time on unnecessary features or code. No more waste, just more value-creating features.

Rookout Sandbox

No registration needed

Play Now

Table of Contents
Get the latest news

To Perforce or Not To Perforce: That is The Question

Dan Sela | Director of Engineering

5 minutes

Table of Contents

As the world keeps spinning and technology keeps progressing ever-further, a lot of focus is being put on optimizing productivity. However, there is an aspect that is being overlooked: adaptivity. Being adaptive as an organization has become critical. It’s not just about your organization, but about helping your clients to be fluent and adaptive as well. In our experience, this means helping the user to get the best experience possible. We figured it’s a pretty simple equation: happy user, happy business.

So how do you achieve this? We’d like to share with you some insights we learned on a journey to helping one of our clients. To give you some background information, this client has been using Perforce to manage their code for quite some time. While deploying Rookout with our customer’s environment, we understood that the customer wouldn’t be able to package their sources into its application’s environment. Not having the sources packaged with the application means that Rookout won’t be able to verify that the user is using the right source code files when debugging. So when they hit this snag in the road – and quite a large one at that- we figured it was time to step up to bat and figure out how to make their lives easier. We decided that we wanted to support sources auto-fetch for customers who use Perforce. Here’s how we did it.

The Beginning

The story begins in the not so far off past, where our clients found that they had a problem in which they couldn’t package their applications sources, and due to that issue, weren’t able to know for certain if they were working on the right version of their code. Usually Rookout is able to provide the right version of code, because when the client adds the version ID during the build process, Rookout then brings the right version for the chosen app.

In Rookout we’re trying to reach perfection. We wanted to make sure that our client wouldn’t have any issues and would get the best experience possible. As we as humans are prone to error, sync issues might be experienced here and there. We wanted things to feel and work as best as they could.

The Investigation

As the situation came to light in the Rookout offices, we decided that we wanted to help them connect to their source control and aid them in debugging the right application with the right source code, no matter what. This is when it all went downhill for me.


We began to investigate what Perforce is used for and how to use it. Perforce is a source control service meant to be used in large organizations with a lot of code. As such, Perforce, as a tool, is meant to only be used internally and therefore does not provide what some SaaS git services do, such as a ‘Rest API’. This means that I am unable to go from the browser straight to Perforce. For example, if you work with GitHub and ask it for the code, the browser will ask the server for the code that you specifically wanted and it will go straight from the server to the browser. Comparatively, Perforce doesn’t allow that, nor do they have any kind of API for that.


So the team sat down and started brainstorming all the ways we’d be able to work around it. Rookout’s desktop app is already installed on all of their personal computers as they use it before they use our Perforce integration. Therefore, we decided to work with Perforce’s CLI (Command Line Interface), otherwise known as P4.  After approximately a week or two of work we were able to get a working product in our local environment. We sent it to them to try out and – major shocker here (sarcasm intended)- it didn’t work. Thus began a very long debugging process.

The Process

When debugging, we experienced two main difficulties:

  1. We couldn’t get to their servers by ourselves, as it’s in their private network.
  2. We weren’t able to physically get to them, either, due to coronavirus restrictions.


We were out of ideas, when one of our client’s employees stepped up and saved the day. He offered to run it on his computer and work with us to figure it out by advancing from session to session, one stage, and one hour (and often quite more) at a time. Here are the stages we went through:

  1. We couldn’t connect to the server and found that it was sending the server the wrong users.
  2. Instead of asking for just one file (such as what Rookout does on Git services) we asked to get all the files from a specific library (depot), which caused major performance issues.
  3. We succeeded in fetching a list of the files in place of the files themselves. Then, we got stuck because P4 reported that it had retrieved the file for us. This was true enough, except that the files in question were empty. So, story short, we didn’t succeed in getting the file we needed.
  4. We worked very closely with our partner to ultimately solve the problem for now and forever, amen. It took another two hours but we finally fixed it and then made it into an official version.

Once these steps had been completed, we gave the customer that new official version and told him to try and run it. He said that it didn’t work, and I swear my heart stopped for a millisecond.

Then the customer checked he had the latest update and lo and behold, it finally worked! I felt my heart begin to beat again and the weight of the project fall off my shoulders.


Rolling with the punches

So, to make the story short, good relations with customers are the key to giving them exactly what they need and want. During this whole process, I found out the hard way that while you can do whatever you want in your closed test environment, though once you get out into the big wide world, it’s unpredictable and it might not go as well as you’d hoped. However, this is easily fixable: just remember that being adaptable and fluent is the key to success. (Side note: it also doesn’t hurt when the client is outstanding and goes to great lengths to help you help them). Aka- just roll with the punches as they come and everything else will ultimately fall into place.

Rookout Sandbox

No registration needed

Play Now

Table of Contents
Get the latest news

Using Helm to Improve Software Understandability

Josh Hendrick | Senior Solutions Engineer

7 minutes

Table of Contents

As new advances in software development have allowed developers to increase their velocity and push out new software at ever-increasing speeds, one less measured metric is software understandability. Although it probably seems obvious, when building new software the goal should always be to build software that is as simple and easy to understand as possible. While architectural and design decisions play a critical role, oftentimes simply choosing the right tool or framework for the job can simplify things tremendously.

One such tool and our focus for this blog, which has the ability to simplify the management of applications is Helm. Helm is a Kubernetes tool that can improve the ease of use and understandability of software systems by providing a standard approach to how those systems should be packaged and deployed. Helm can improve developer productivity, reduce the complexity of deployments, and bring improved consistency to how organizations build and use cloud-native applications.

In this blog, we’ll take a deeper look into Helm and why it can increase the understandability of software.  As part of the discussion, we’ll take a look at a specific example of a Helm chart repository using JFrog’s ChartCenter and will also look at how an application component from Rookout can be installed from the Helm repository.

What is Helm?

Helm is a tool that allows you to manage Kubernetes-based applications by providing a standard approach for defining how you install, upgrade, and uninstall applications. You can think of Helm as a package manager for Kubernetes applications. With Helm, you define Charts, which are YAML-based files that describe a related set of Kubernetes resources. Charts are files that are packaged in a particular directory structure which can be versioned within your source control systems.

Helm is implemented in two key components:

  1. The Helm Client is a command line tool for developing Charts, managing repositories and releases, and interfacing with the Helm Library.
  2. The Helm Library provides logic for executing Helm operations (install, upgrade, etc) by interfacing with the Kubernetes API server.

There are also three key concepts to be aware of with Helm:

  1. Chart: a package of files describing information required to create an application in Kubernetes
  2. Repository: a place where charts can be collected and shared
  3. Release: a running instance of a chart within a Kubernetes cluster

A nice description combining these concepts, as taken from the Helm website is as follows: “Helm installs charts into Kubernetes, creating a new release for each installation. And to find new charts, you can search Helm chart repositories.”

Looking at a Helm Repository

Now that we’ve explored what Helm is and how it works, let’s dive deeper into how you can use a chart repository for hosting and sharing Helm Charts. A chart repository is an HTTP server where packaged Charts can be stored and shared.  In this blog, we’re going to be looking at JFrog’s new chart repository, ChartCenter.

ChartCenter is a free chart repository that makes it easy for the development community to upload and share charts with other developers. They have a simple and easy-to-use interface for searching through Kubernetes-ready packages that can be immediately deployed into a cluster. One nice value add is the additional chart metadata that you get from ChartCenter including usage data, dependencies, and security/vulnerability information.

If you would like to add your Helm charts to ChartCenter, there are a few simple steps to follow:

  1. Visit ChartCenter at https://chartcenter.io/.
  2. Click on the Add Chart button.
  3. Add your source URL and maintainer email on their repos.yaml file
  4. Follow the instructions and guidelines for making a pull request. Once approved your charts will be live on the ChartCenter website.

Let’s Install a Helm Chart

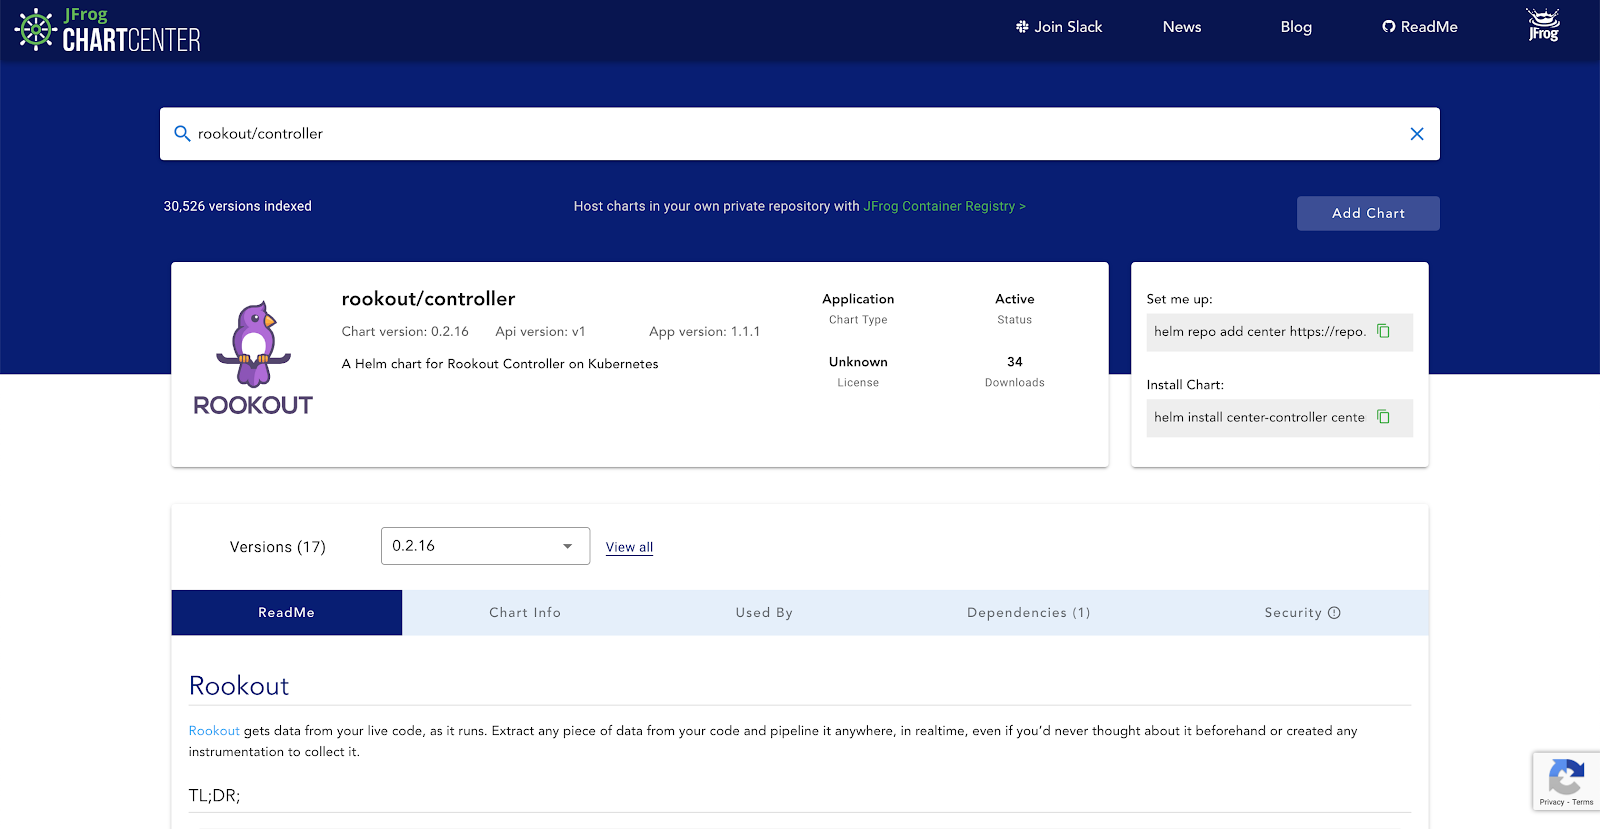
Next, we’ll take a look at and install one of the Rookout charts available from ChartCenter. For those not familiar with Rookout, it’s a debugging and data collection platform for applications written in Java, Python, Node.js, and .NET. To find the Rookout charts, simply navigate to ChartCenter and search for Rookout. In this case, we’ll take a look at the Chart for the Rookout on-prem data controller. This component is responsible for processing application snapshot data from Rookout on-prem so that when using Rookout, all sensitive data stays within your network or VPC.

Taking a look at the ReadMe section of the chart, we can find the instructions to install the Rookout chart:

Let’s now take a look at how we can install this chart in a Kubernetes cluster. For this example, we’ll use a cluster spun up in Google Cloud’s managed Kubernetes service GKE.

First, let’s connect to our cluster and install the helm charts:

Now we can run the above commands to install the Helm chart:

Taking a look at the running pods in our cluster, we can see that the Rookout controller is now running:

We can also now see our controller available from within Rookout:

And with that, we’ve successfully installed the Rookout controller in our Kubernetes cluster with Helm.  How easy was that?  If you want to take a deeper look into the Helm chart and supporting files themselves, you can check out this repository here: https://github.com/rookout/helm-charts/tree/master/charts/controller.

Real-Time Application Debugging

Lastly, to continue the discussion of understandability, let’s take a look at how we can use Rookout and our newly installed controller to debug a live-running application! To start, let’s deploy a sample application into the Kubernetes cluster.

For this example, we’ll use a sample To-Do list application which can be found here (feel free to fork it and play around with it in your own environment):

https://github.com/joshRookout/deployment-examples/tree/master/python-kubernetes/rookout-service

To deploy the application, simply follow the instructions from the above GitHub repository.  First, we’ll create a secret that will contain our Rookout security token:

Before we deploy the demo application, we’ll need to tell it to connect to the Rookout controller which we installed with Helm.  To do that we’ll need to add two new environment variables in the deployment YAML.

Notice we added the environment variables ROOKOUT_CONTROLLER_HOST and ROOKOUT_CONTROLLER_PORT so that when the demo application runs, it connects to the controller in our cluster.

Next, we’ll deploy the application:

Now that the application is deployed, we can get the external IP address of the service:

Navigating to the external IP we can see the application running:

We can now also see our application instance connected to our controller within Rookout:

From here, you are all set to use Rookout to collect snapshots of data from the running application.  To finish the setup you’ll need to connect the source code repository and start setting non-breaking breakpoints in your application as described in this video.

Tying it All Together

Hopefully, this blog post gave you a taste of some of the power and ease of use achievable by using Helm charts when doing development in Kubernetes-based environments. By defining and managing your application configurations using Helm charts, you can add to the understandability of your applications by having a consistent approach to packaging those applications.

When looking for packaged applications to install, using applications hosted in a chart repository like ChartCenter makes it quick and easy to get started. As more and more organizations adopt cloud-native technologies, this community is sure to continue to grow.

Technologies like Rookout can be a nice tool in your toolkit for a better understanding of what’s happening within your applications while they’re running without having a need to restart or redeploy them.

And finally, when looking at software understandability, it’s important to not only keep in mind coding standards and source code readability but also to keep close tabs on non-source code-related tools or artifacts produced during the development process. Happy coding!

Get the Rookout Chart from ChartCenter here.

Rookout Sandbox

No registration needed

Play Now

Table of Contents
Get the latest news

Python Debugging Tools: More Than Just A (Print) Statement

Maor Rudick

5 minutes

Table of Contents

As most developers will agree, writing code is oftentimes, if not always, easier than debugging. As a simple definition, debugging is the process of understanding what is going on in your code. When speaking in terms of Python, it is a relatively simple process.

Every developer has their own personal debugging method or tool they swear by. When it comes to Python, most developers use one (or more) of the following: print statements, traditional logging, a pdb debugger, or an IDE debugger.

Alas, as is the way of the world, nothing is perfect. All four of these methods have both their pros and their cons. But the core of the issue when debugging remains: why is it so difficult to understand what’s happening in your code? What is the missing key that makes debugging so difficult- whether it be in Python or any other language? Let’s delve into two of the better-used methods in order to further understand what it is.

Method 1: Print Statements

One of the more common and well-loved methods to debugging Python applications is through writing print statements. Why, you ask? Well, simply put, it is the simplest way to understand what’s happening in your code so that you can then check what has been executed. This method involved putting print statements throughout your code to print the value of variables so that you can inspect them during runtime.  For example: print(“The value of var is: “, var).

Print statements only examine the behavior of the code, necessitating the placement of many print statements in order to find the general area of the bug, hone in on the exact code that has the issue, find the relevant variables in that code, print those variables, and then work backward to trace the source of those variables. Then, these steps need to be repeated until the developer can understand the behavior of the bug. Although it gets you the information you need to debug, It is a long and tedious process.

It’s important to note that utilizing this approach if you have already deployed your application and you want to inspect more data, you’ll need to make a code change and redeploy your application after making those changes.  In enterprise environments where you have CI/CD processes that execute, including building and packaging the application, test case execution, approvals, deployments, and more, this can oftentimes be a lengthy process with lots of context switching.

Method 2: Traditional Logging

The Python logging API is another approach that developers often use to debug Python applications. It is similar to a print statement, yet gives you more contextual information about the issue you’re facing and allows for configuration of logging threshold levels so that logs can be categorized based on severity. Logging is often used as a method in lieu of debugging tools.

Debugging using logging is often easier with Python, as it has extensive logging facilities and excellent documentation. It is well-standardized and simple, as Python has a powerful logging framework in its standard library. Additionally, logging can be better than using print statements as you can not only get the log record, but also access events automatically logged in included modules.

A nice feature of the Python logging module is the ability for applications to configure different log handlers so that captured log messages can be routed to those handlers.

But, similar to using print statements, this approach requires the writing of more code and waiting for deployment cycles to complete, but achieves the goal of providing data and context you need to debug and understand what’s happening in your code while your application is running.

The Missing Piece

No matter the tool or the method you’re using to debug, all of the problems narrow down to one central cause: a lack of information about your code. But why is that? You wrote the code, so it should go without saying that you should know it best, right? And even if you didn’t, why is it so difficult to obtain that necessary data in order to reach the heart of your code and solve that pesky bug?

It all boils down to the missing ingredient: understandability. Understandability is the concept that a system should be presented so that an engineer can easily comprehend it. The more understandable a system is, the easier it will be for engineers to change it in a predictable and safe manner. In simpler terms? The better a developer can understand what their code is doing, the easier it will be to go in and debug it (of course regression tests can help here as well!). That is the missing key that we covered not only in print statements and logging but in all debugging tools.

The Right Python Debugging Tool

In order to make debugging efficient and effortless, you need a tool that will allow you to immediately get the data you need, from anywhere in your code, no matter where it’s running. And even more so, you need to be able to do so without breaking anything or redeploying your application. While the use of print statements and logs gets you information about what your code is doing during runtime, oftentimes, you may not have the right logs or print statements in place. Or other times it may be too much information to sift through or just simply take too long to get a hold of.

Hours of developer’s workdays are spent attempting to extract the information they need to solve their bug. They run through endlessly long processes just to try and get one kernel of data, only to realize it was the wrong one, or completely irrelevant to what they needed, and that they have to go back to start and try again.

By employing a Python debug tool (such as Rookout!) that gives insight and understanding into every part of code, frustrating debugging times will be a feeling of the past. No more wasting time and resources. Go find the right tool that allows easy, effortless, and, most importantly, happy debugging.

Rookout Sandbox

No registration needed

Play Now

Table of Contents
Get the latest news

Five Ways to Improve Developer Velocity

Maor Rudick

8 minutes

Table of Contents

In his quote “everything I do is somehow connected to velocity”, Hans Ulrich Obrist hit the nail on the head. This is true for most companies as there are always factors affecting their team’s velocity, such as a change in a work routine, a change in budget, or other reasons out of their control. The question is: how do you make sure that your devs are working at optimal velocity?

After conducting research and speaking to a few of our clients, we found out that there are a number of reasons for a decrease in developer velocity. Although some may seem commonplace, they are just as critical and should be addressed as soon as possible to ensure your team’s productivity and efficiency.

But don’t panic yet. We may already be well into 2023 – but that doesn’t mean you can’t maximize your developers’ velocity and productivity. So let’s dive into how exactly you can do that.

Find what is wasting your team’s time 

Deadlines and stress often go hand in hand. When your sole goal is to meet deadlines, finding ways to improve R&D velocity becomes less of a priority. Add to that the stress of the current financial climate, the current job market, managing a remote team and ensuring top velocity seems like a pipe dream.

However, stressing about circumstances out of your control won’t help a thing. Rather, start by where you can actually make a difference: by pinpointing where exactly your team is wasting the most time. Ask your developers where their biggest time wasters are and then move forward (hint: the next step is finding the right tools to fix it).

For example, one of our clients found that they were wasting a lot of time when debugging. Their devs were going through the whole deployment process over and over, waiting to set log lines, and then waiting to get the information they needed, hoping it was the right information to fix the bug that they were working on. Once they tended to this painfully repetitive process, their time to market accelerated dramatically. 

Find the bottleneck(s) to your team’s productivity

Slow-moving processes can be one of the most frustrating roadblocks to developer velocity. Software development cycles can get quite lengthy. Whether it’s waiting for code approval, ygoing through yet another CI/CD cycle (*yawn*), or a deployment bottleneck, it can be agonizingly slow. 

To avoid getting stuck in slow-moving cycles, separate the processes you need to move on from the rest of the development cycle. For example, troubleshooting code. It can be an agonizingly long process, requiring several cycles of rebuild-test-redeploy. By separating this process from the development cycle, you can save yourself from being stuck in slow-moving cycles. Imagine a world in which you can skip straight from setting breakpoints to getting the data you need to fix the issue you’re working on. 

Find ways to do more with less

Sometimes, a situation occurs in which you’ll find yourself working with limited firepower. With the recent layoffs, this scenario is not new to anyone. And yet, we all know that having the right developers and enough of them is critical to your team’s success. Seems a bit like a catch 22.

But no. Rather than hiring new people and onboarding them, consider finding the tools and methods that will allow you to maximize the resources you already have.

For example, one of our clients realized that a significant amount of their developers’ time was spent researching production issues. By finding a tool that helps their developers debug in production (yes, that’s us!) they’ve been able to save about an hour or more on each bug, allowing them to focus on value-creating tasks. By doing more with less, you can maximize your resources and improve your team’s productivity. 

Utilize Agile Methodology

Another cause of a reduced velocity is the time and resources spent fixing bugs. You’ll find that much of your devs’ time is spent working on a bug instead of working on their new code or on creating new features. Debugging is essential to the well-oiled machine that is your software. However, it completely drains your developers time and thus reduces their velocity. 

That’s why we recommend implementing agile methodology in your management approach. Agile methodology emphasizes teamwork, collaboration, and flexibility, which each contribute in turn to improving velocity. By adopting agile methodology, you can help your team work more efficiently, focusing on delivering value to the customer.

Agile methodology emphasizes continuous integration and continuous delivery (CI/CD), which enables developers to build, test, and deploy code more frequently. By doing so, developers are able to catch and fix issues earlier in the development process. This saves them time and resources in the long run.

Find your data

Data makes the world go ‘round. But often, your devs can be buried under the sheer amount of it. Data is needed in virtually every aspect of software development. Yet, that desperate need for it every step of the way causes devs to accumulate an overabundance of data that mainly creates noise and distraction in their code.

Frequently, as one of our clients found out, this excess of data can be generated by a phenomenon called Logging FOMO. This stands for the fear of missing out on log lines and the data they comprise. Your devs are so fearful of missing something that they set too many log lines, hoping that one of them will bring them the data they need. However, these logs generate too much noise in the system and high overhead costs to maintain the sheer number of logs they have set. On the other hand, sometimes developers don’t write enough loglines, thus preventing them from getting the data point they need to move on and fix their problems. 

Avoid going down the dark road of data overload by implementing a tool that will allow you to gain control of your logging verbosity. Find yourself a tool that helps you not only optimize your logging costs and app performance by controlling log granularity but also cuts down the noise of application-level logging verbosity, and more. And yes – we do recommend the Rookout Live Logger for this 😉

Choosing Right

While the going may be tough, it doesn’t mean that the tough need to get going. No matter the circumstances affecting your team’s velocity, there are a variety of solutions at the ready to help them improve their velocity. Identify your team’s soft spots and take the frustration away. You won’t regret it.

Rookout Sandbox

No registration needed

Play Now

Table of Contents
Get the latest news

A Dev Manager’s Guide to Smooth Transitions and Handoffs

Oded Keret | VP of Product

5 minutes

Table of Contents

As they say in the sports world, “instinctively knowing when to run forward, when to ease back, and when to let someone else take over…these are the marks of a great team and a great team player”. Here, in the tech world, we couldn’t agree more.

In most startups, each employee wears many hats. But as the company grows there comes a time for employees to hand over the keys to the kingdoms they’ve created and let someone else take the reins. Nobody wants to let go of the project they’ve poured their heart and soul into, even if they wholeheartedly trust the hands they’re about to place it in. After investing and growing your project from the ground up, parting ways is most often not in the original plans you had. However, as we all know, “the best-laid plans of mice and men…”.

Handoffs are a journey, and as with all journeys, you learn a lot along the way. What can you do to make sure that the process goes well? No matter where you’re headed next, you want to make sure that the transfer is not only easy, but productive. Here are a few ideas on what to look out for to ensure that it’s smooth-sailing from the get-go.

Sharing is Caring, Especially with Knowledge

One significant part of handing over the reins to your successor is handing over all of the knowledge that you’ve compiled during your term. There are a variety of ways in which you can do this, but we’ll focus on three, including their pros and cons.

  1. Interactive knowledge sharing. The transfer of knowledge from one person to another has many benefits, especially when done in an interactive manner. It promotes collaboration, helps others learn from your mistakes, facilitates faster and better decision making, stimulates innovation, and reduces the loss of know-how. However, knowledge sharing can often switch the team into a solely solutions-oriented mindset, instead of a progress-oriented mindset.


  1. Meetings and recordings. Meetings are some of the best ways to impart knowledge. They help to focus, it is easier to engage, and avoids anything getting lost in translation. Recordings of these meetings help to go back and review the information that was relayed, ensuring nothing critical falls by the wayside and can be reviewed whenever needed. However, time doesn’t always allow for such meetings, which can make implementing this difficult.


  1. Crystalizing information in written formats or diagrams. True knowledge is forever, right? By securing your wealth of knowledge into written formats or diagrams, you are able to transfer what you know to another person without the need for interaction. Yet, this can be difficult later on and become challenging to understand when it can lack context or the technology has moved on from what you wrote.


We don’t always have time to write things down, or to set a meeting just for transferring knowledge. Sometimes we don’t even have time to share a link to a document we’ve already written a year ago, and forgot it even exists. But if we don’t invest the extra time and effort, all of the knowledge we’ve gathered will be lost, and a lot of the hard work we’ve done will go to waste.

So be sure to mix and match, and start introducing the above tools into your team’s culture when the timing seems right. We promise it will pay off in the long run.

The Proper Tooling

In tech, there’s two things we love with all our hearts: great coffee and great tools. While the former is important at all times, of all days, the latter is a crucial part of a successful handover.

Providing your successor with the right tools is a necessity.  It allows the person taking over to be self-sufficient from the get-go. There are a variety of tools out there that help with different aspects of the handover. Whether it’s having the proper introductions for people to consult with, their contact information, project history, or source code, they’re of key importance.

One such critical tool is one that provides them with the ability to understand things on their own. It aids in speeding up the process – no wasted time trying to decipher legacy code, for instance- minimizing the time it takes to learn the new software. It allows them critical insight into the software that they have just inherited and gives them the ability to comprehend what is going on, all of which are crucial to a successful handover.

Take Rookout for example. With a single click, your successor can get all the data they need to understand the software they’re working with, on their own, instantly. Gaining this level of comprehension without writing code, redeploying, or just plain waiting – gives them pretty much everything they need to succeed in their new role.

Productivity- the end goal

Simply put, transitions are a part of tech life. The question is not whether to move forward, but how to adapt as quickly as possible. While no simple feat, as a manager it is your job to enable smooth and time-saving methods to make these transitions as painless as possible. By doing so, you’ll be able to not only have a productive and easy handoff, but be able to maintain, and hopefully even grow, your dev team’s velocity and code quality.

Rookout Sandbox

No registration needed

Play Now

Table of Contents
Get the latest news

A Definitive Guide to Understandability

Maor Rudick

8 minutes

Table of Contents

When you start working on a new project for the first time, everything usually seems quite clear, including the steps you need to follow to write the necessary code.

When you first begin to build your application, you have a very abstract idea of what the final product will look like and you might think it’s all very clear and easy to understand. Even when you start writing the first lines of code and create the first functions, classes and modules, everything might still seem very simple.

But will things stay the same in a few weeks, months, or maybe even years, especially when the code bases will increase and more components will be added to the architecture?

Will your code, and essentially your software, be understandable?

Here is all you need to know about understandability when it comes to software development, as well as why it’s important to make sure your code is easy to read.

Essentially, it means that your application can effortlessly be comprehended by developers, both by those who created it and by those who join along the way.

You can say that understandability is achieved when developers on all levels can make updates to it in a way that is clear, safe, and predictable, all without breaking current functionalities.

Here’s how understandability plays an important role in the functionality and performance of web-based applications, or any application in fact.

A code that is easy to understand will be easier to debug.

When you work with code that is tangled (spaghetti code) or more complex than it needs to be, you will have difficulty spotting any potential problems.

In the fortunate case where you have tests, most of the bugs will be spotted in that development phase. If they’re not spotted by the time your software is live, then these bugs will be raised by users, which is something that will affect the user experience.

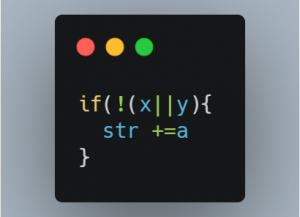
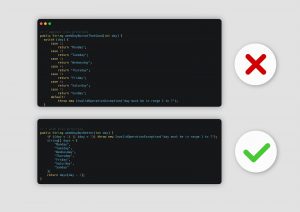
For example, take these two snippets. They are two versions of implementation for the FizzBuzz code challenge. The first one represents the most basic implementation, while the second one is trickier.

In terms of performance, they are both the same O(n), where n is 100. So neither of these versions is better in terms of performance.

Code

The above image represents the basic implementation that is very easy to understand and therefore it’s much easier to spot any problems.

The second implementation has a bug. Because the code is not so easy to understand, it may be hard to spot it. Try to figure it out yourself before scrolling down.

Code

Did you figure it out? The issue is here:

Code

You have to include a negation sign.

The speed that’s being referred to here is the speed of development. A lack of observability will, more often than not, cause the development team to move very slowly.

When dealing with legacy code you will often see some sort of spaghetti code. The substantial problem here is that, due to lack of visibility, it is almost impossible to see how even a small change affects the overall code.

This is why the process of developing the application code will be a very slow one. You have to ensure that the current code remains correct even while you’re making changes.

In other words, you need to check that you’re not creating new problems while trying to solve old ones.

‍Another side effect borne from a lack of understandability can be found on the security and maintenance side.

Not only will the flaws in the code or architecture be hard to spot, but keeping the code and the packages (libraries & dependencies) up to date will be a very tedious process. This will affect the security of the application.

Lastly, but not the least significant field that will be affected, is the budget. When there are issues with a team’s velocity, the first and easiest solution is to bring more developers on board. But this is just another patch on a broken bag until things go south again because the true problem was never treated.

In the end, the biggest impact will be on the budget, whether this is in the form of more paychecks or users who simply give up.

Understandability can be divided into more categories and can be extended to users – not only developers –  as well.

‍The obvious one is the codebase and architecture understandability that we covered previously.

This problem can be extended to the documentation and instructions that the application provides.

I think it is safe to say that we have all come across an application or a specific tool where the documentation it had made no sense and in the best case scenario it only gave you some basic information.

Another underrated scenario of this issue refers to the user interface.

“A user interface is like a joke. If you have to explain it, it’s not that good.” – Martin LeBlanc

For an app to achieve understandability, UX must be taken into account as well. The application should be easily used by users without them being disoriented and confused.

Here is a checklist you can take into account when creating understandable code.

  1. Choose a Suitable Pattern and Write the Code According to It

Some of the most well-known design patterns are OOP, MVC and Component Based.

For example, you can take AngularJS, which is a framework built on MVC. For Component Based, on the other hand, you can use Angular, React and actually most modern web frameworks as examples.

For modern web development, I would say that a component-based architecture solves most of the problems. However, the idea is that no matter what pattern you choose, it’s important to write the code according to it.

Let’s say that you have a new developer joining the team and they are taking a look at the code for the first time. If the code is written according to a known pattern that they are acquainted with, then there’s a high chance that they already know where to look to solve a particular problem or where to find the implementation for a specific job.

If there is no design pattern then they will have to find where in those files is the logic that makes X and then in which other files it is linked with Y and so on. This becomes tedious really fast and causes a decrease in productivity for everyone.

As the name suggests, modular programming refers to the process of subdividing an application into separate sub-programs.

This will make the code much easier to understand and read, as this technique achieves a separation of concepts. Thus, each module is independent of the others and each module has a single purpose.

At the same time, this allows engineers to develop faster because the modules can be easily integrated from one application to another.

The previous examples were referring to the application architecture and structure, but we can make use of some clean code principles as well. For example:

  • KISS – keep it stupid simple or keep it simple, stupid. According to this principle, most systems perform best when they are kept simple rather than made complicated. That’s why simplicity should be a key goal if someone wants to achieve understandability across their codebase. Avoid any unnecessary complexity.
Code
  • DRY – Don’t Repeat Yourself. This principle states that each piece of code must be unique and have a well-defined purpose. For example, if five lines of code are repeated several times across your program then, in order to be in accordance with this principle, you should take those lines of code and write a separate function which you call. Don’t rewrite the same thing every time.
Code
  • YAGNI – You aren’t gonna need it. This principle is simple. Don’t add functionality until deemed necessary. Only implement things that are required.

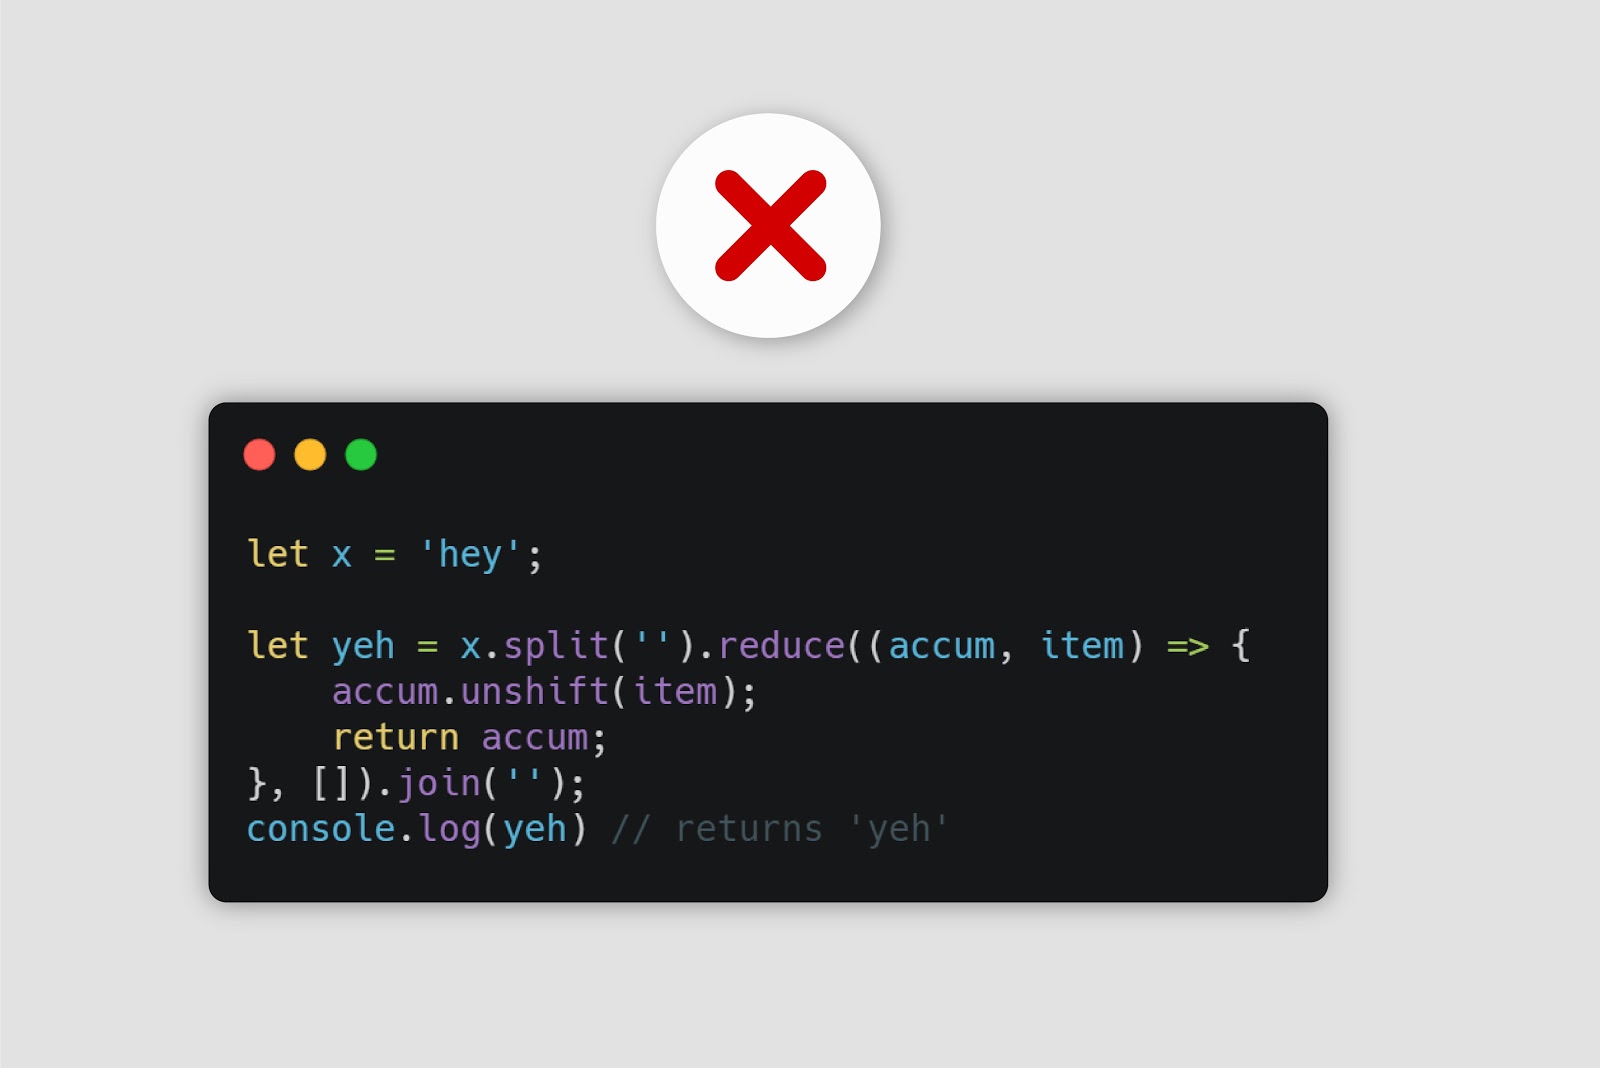
Another example of code that is not that easy to understand can be found in the following snippet:

Code

This code rewrites a text from right to left. In other words, this is an example of string reversal.

A better approach would be the following:

Code

One common misconception is to think that understandability and observability are the same. However, in reality they are complementary. The second one focuses on the ability to alert the dev team when the system misbehaves and help them identify the causes of any problems, so that normal service can be restored.

In other words, observability is achieved when you collect enough data from your application that identifies the root of your problems or helps you predict any future problems, such as performance bottlenecks.

Therefore the understandability of your system, the way that it behaves, and the way users and developers interact with it can be improved by collecting more data from your software.

There are several tools that can help you collect more data from your application.

Rookout is a tool that helps you achieve greater understandability in your application by enabling the retrieval of any required data from live code, in just one click. In other words, it allows developers to do remote debugging on production servers without breaking anything, because of its non-breaking breakpoints.

Conclusion

Understandability is something to always keep in mind. If you ignore it, your team will suffer for it.

It is much better to take the time to get things done right the first time around. That way, you won’t waste unnecessary time and effort when other improvements are needed or when certain problems arise.

Rookout Sandbox

No registration needed

Play Now

Table of Contents
Get the latest news

‘Data On-Prem’ Means SaaS Agility And On-Premise Control

Liran Haimovitch | Co-Founder & CTO

2 minutes

Table of Contents

Today, we’re excited to announce Data On-Prem for development teams that operate in data-sensitive environments. This new feature truly lets you have the best of both worlds, by enabling large enterprises to leverage Rookout as a SaaS offering, while also meeting the rigorous governance and control requirements that these companies often face.


Our main objective with Data On-Prem is to help save companies in data-sensitive environments a tremendous amount of time and money when they are extracting data. This is particularly relevant for industries such as finance and healthcare, where dealing with data is a governance and compliance nightmare. The traditional processes to solve these problems are extremely time-consuming — such as writing endless log lines or waiting for new code to re-deploy — and often involve many levels of controls and approvals. Rookout skips all of that process, and comes with built-in auditing and other controls, allowing engineers to extract the data they need instantly.


The truth is (drumroll, please) that devs within big companies want to move fast and be agile, just like startups. But they are dealing with much more bureaucracy and regulation. That’s why it’s a top priority, as a company with customers in the Fortune 1000, that we build solutions that are easy to adopt, maintain, and use without compromising on the safety and security concerns of these customers.


Unlike other SaaS offerings in the developer tools space, we really have no interest in your data. No, really, we’re not kidding. We don’t need to store it, to analyze it, or even to process it. Our job is to go in and get it, then pipeline it to your key stakeholders. We hand it over to you in a closed envelope. That’s it.


If you’re an existing Rookout enterprise user, it’s a very simple process. All that needs to be done is to run two dockers of ours, or if you’re using Kubernetes, you’ll only need to run one chart that we provide. It’s so simple, it’s basically magic, but for your secure data.


Rookout Sandbox

No registration needed

Play Now

Table of Contents
Get the latest news

Hyper Growth At a Time of Uncertainty: Part 1

Liran Haimovitch | Co-Founder & CTO

7 minutes

Table of Contents

Most companies strive to manage periods of hypergrowth and when they’re in it, their goal is to remain there, riding those waves up as far as they possibly can. ‘Hyper growth’ is a term first coined by Alexander V. Izosimov. The World Economic Forum, taking it a step further, explained it as a company’s “need to have a compound annual growth rate (CAGR) of greater than 40%.”. However, for a more relaxed definition, one can understand it as being  “a phase of rapid expansion that companies experience as they scale”. And what company isn’t looking to experience just that?


Times are ever-changing, and while we try and keep up with all that’s happening around us in the world today, it may seem odd to think about company growth. However, some companies will and do benefit from these global changes.


Two types of companies are likely to encounter hypergrowth during these times. The first are the awesome companies out there that are going into (or maintaining) hypergrowth irrespective of the world around them. They might not grow as fast as under these circumstances, but they may definitely find their way to hypergrowth. The second type of companies are those that help the world deal with the current circumstances. Those may be directly addressing the crisis, through tools such as telemedicine and advanced medical technologies, or supporting us throughout this crisis through online collaboration, eCommerce and delivery, and so on.

The Lucky Winners

This might seem odd to you, but looking back at the 2008 recession, there were quite a few companies that not only survived but thrived.

Who were these, you ask? Companies such as Lego, Groupon, Amazon, and Netflix (and more, but I’ll save you from reading through the long list). The most surprising among them were Lego and Groupon. Lego maintained hyper-growth due to its expansion into global markets. And Groupon? Fun fact: they only started the company in the midst of the economic downturn, but since their platform helped deal with current circumstances by giving consumers a way to save on most everything, they succeeded.

What’s still true: Business as Usual

While we find ourselves living in unprecedented times, experiencing the likes of which we only dreamed of in apocalypse movies, we still find that no matter the chaos outside, for some of us, it’s still business as usual in the office. And for hyper-growth companies, this means that many of the tried and true guidelines are still in effect:


  1. In order to ensure growth, you need Sales to continue to, well, sell. Focusing on sales enablement, aka aligning all aspects of your sales- the people, the programs, and the processes- will help you to maintain hyper-growth. Your sales team might just be your golden ticket to the chocolate factory, or in this case, to managing growth. It’s an upward spiral- the more they sell, the more you grow.
  1. Focus less on innovation. Yes, we can all agree that innovation is what propels you into the nether-sphere of success. And yet, when you are in hyper-growth, you are already doing something right. Focus more on what’s already there, than what might be there someday. Take fewer risks and instead work with what you know will succeed (see above, please) and keep some of that creativity on the back burner.
  1. Culture is an inevitable part of your company and is what will truly determine how your employees work when you are not there. As you are scaling up and giving up much of your direct influence, promoting the proper culture within your company is the only way to keep things going the way you envision them. Whether it be defining culture in clear observable terms or ensuring managers reinforce target behaviors, among others, will help maintain it while you continue to scale up.
  2. Empowerment is another key principle to keep your organization (over)achieving its goals as you scale. Make sure employees have full ownership over their tasks, the tools they need to carry them out, and the motivation to get it done. By empowering your people at the tip of the spear, they will take it and run with it, ensuring the growth of your company.

Growth Loops

As you are on a hyper-growth spurt, keep in mind that it isn’t never-ending. Whatever growth driver is pushing you forward, it will end someday, and so you have to think of growth loops. Growth loops refer to “a system that takes a growth indicator, processes it, outputs more of it, and then feeds this output back as input for the next loop cycle.” Or, as I like to think of it, make sure you have the next target in your sights.


To keep growing, you have to make sure to put another (significant) growth spurt in place before the one you are riding will die down. As each time you have grown more than the last time, each growth spurt also has to be bigger, making it quite a challenge.


In these times, however, it can be difficult to work in growth loops. In an unpredictable market, the next iteration of the loop is far more likely to be disrupted by changing circumstances, well beyond your control. Make sure to invest more time and effort into finding the next growth loop than you usually would. Check out more potential avenues for growth and try to have more than a single such initiative in place. The more alternative growth loops you’ll have in place before this one runs out, the better off you are.


As the world around you is going through a crisis, don’t try to plan too far ahead. Focus on short-term opportunities to avoid nasty surprises down the road. And try and align yourself with what’s going on outside – how are you uniquely positioned to help the world around you through these tough times? You’d be surprised at how impactful you can be to not just yourself and your fellow citizens but your own company.

Having the right people is important, but…

As any good manager can tell you, there is nothing more important than having the right people. In fact, it’s probably the most important thing in determining your success. When in hyper-growth, your ability to scale is often constrained by how fast you can hire them. While this is definitely true today, you might want to slow down hiring a bit compared to previous periods of hyper-growth, for a few main reasons:


  1. If you’re an ‘office first’ company, then you’re all about face-to-face communications. Whether it’s with hiring onboarding, going through this process remotely is quite a change. Give yourself time to adapt to the new reality (and consider being a remote company). Going into a hiring frenzy without changing some of your ways will often result in unfortunate hiring decisions and bad onboarding experiences.
  1. Capital is at a premium. You’re probably not going to be getting as much capital per equity over the next 12 months as past companies in your situation. Hiring new employees is probably the single most expensive route you can take and will have the longest-term impact on your burn rate. Staying lean is a priority today, to enable efficient use of capital and to keep you ready for unexpected surprises.
  1. Hiring processes take time to go into effect, starting from the initial decision to fill a specific role until ultimately finding and onboarding the right person. In low markets, it’s definitely easier to hire very good people but will still take time for the process to run its course. And as we discussed, in this rapidly changing market, the faster you move, the better.

While awesome people can’t ever be replaced, you should also check out some of the alternatives. Consider which tools and techniques you can employ to get the team you already have more productive (if you get a chance, check us out!). Look towards other options, such as using external agencies or buying off-the-shelf software. Depending on the problem you are trying to solve, you’ll often find those solutions to be more cost-effective, but even more importantly- especially today- they will deliver faster.


Don’t stop hiring people and aim to hire the best people you can get. But, don’t hire as aggressively as the textbooks say and focus on alternatives. Bring these all together and I’m sure you’ll be a lean, mean, growth machine in no time. 🙂


Rookout Sandbox

No registration needed

Play Now