Rookout is now a part of the Dynatrace family!

Table of Contents
Get the latest news

How to Install Java Agents on Kubernetes

Josh Hendrick | Senior Solutions Engineer

3 minutes

Table of Contents

In today’s world of software development, it can often be challenging to get the data and information we need from running applications. While the introduction of container orchestration frameworks such as Kubernetes has brought about new capabilities around scalability and fault tolerance of applications, it has also introduced challenges in understanding exactly what’s happening within those applications when things don’t go as expected.

In some very unique ways, Java agents can be a powerful tool for helping us understand what’s happening within the internals of applications. Java agents provide the ability to instrument running applications through the modification of their underlying bytecode. In the case of Rookout, Java agents allow for deeper insights into the internal data of your applications whether they are running on your own machine, staging server or even in production.

With the prevalent adoption of microservice architectures across organizations, it is increasingly important to be able to roll out Java agents in a seamless manner, without impacting design decisions or causing rework of existing applications. So how easily can we deploy a Java Agent on our services running within Kubernetes? Let’s explore some methods of simplifying the deployment of those Java agents without major changes to existing services.

Deployment using environment variables

As mentioned in an earlier blog post (27 seconds to deploy a Java Agent), you can add a Java Agent to any JVM-based application using the JAVA_TOOL_OPTIONS environment variable. Doing this in a Kubernetes YAML file might look something like this:

apiVersion: v1
kind: Pod
spec:
containers:
– name: java-app-container
image: <image-name>
env:
– name: JAVA_TOOL_OPTIONS
value: -javaagent:agent.jar

For this to work, we have to load the agent jar file into the Docker container. But what if we don’t want to edit our existing Dockerfile, for example, using the ADD command?

ADD ./agent.jar /opt/application/path/agent.jar

Then what can we do?

Extending a base docker image

The easiest way to add a file to a Docker image without editing the Dockerfile is by adding another level of indirection. We create a new Dockerfile that uses our current application image as the base image, throw in whatever extra files we need, and deploy the new image to production:

FROM java-app:1.0

ADD ./agent.jar /opt/application/path/agent.jar   # Add our agent jar file

Creating another level of indirection, and essentially another Dockerfile for each of your services is quite a hassle. Lucky for you, if you are already using a base Docker image for all your services (and if not, here’s why you should), you can utilize it to add the extra agent file to your image.

Getting better

But what happens if we don’t want to change our build and orchestration processes? Or, worse yet, what if we want to add a Java agent to Docker files that have already been built?

We can use the concept of Init Containers within our Kubernetes Pod along with a shared volume. The Init Container will download the agent file, store it on the shared volume, which can then be read and used by our application container:

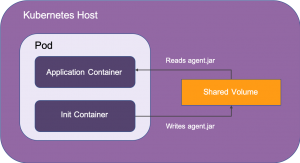
Our Kubernetes Pod template would look something like this:

apiVersion: v1
kind: Pod
metadata:
name: myapp-pod
labels:
app: myapp
spec:
containers:
– name: java-app-container
image: <image-name>
initContainers:
– name: init-agent
image: <init-agent-image-name>

And the Dockerfile for our init agent image would look something like this:

FROM alpine:latest

RUN apk –no-cache add curl

RUN curl -L “https://repository.sonatype.org/service/local/artifact/maven/redirect?r=central-proxy&g=com.rookout&a=rook&v=LATEST” -o rook.jar

CMD [“cp”, “rook.jar”, “shared/volume/path/rook.jar”]

In this approach, the init container is run before the application container is started, making the agent jar file available to the running application. Plus, we didn’t have to touch our existing Dockerfile.

Summary

Installing a new tool is no small undertaking. It’s a journey that requires R&D investment and comes with a learning curve. We often find that we can significantly speed up the process using our DevOps knowledge and expertise. Whichever method you choose for installing your new Java agent on Kubernetes, Rookout will be there to help you troubleshoot.

Rookout Sandbox

No registration needed

Play Now

Table of Contents
Get the latest news

The Fast Track to Java Debugging

Liran Haimovitch | Co-Founder & CTO

7 minutes

Table of Contents

With the rise of cloud-oriented software stacks and development methodologies in recent years, use of Java Application Servers such as Tomcat and Weblogic has decreased. But it’s way premature to consign Java Application Servers to the list of outmoded technologies: Along with the many existing Java Application Server solutions that are still doing the jobs they were created to do, quite a few businesses are opting for Java for new, self-contained on-premises and cloud-based applications that can be set up quickly and easily.

While maintaining and even creating new Java Application Servers systems makes business sense, deploying and especially debugging the systems is a whole other matter. As developers who’ve been around the block a few times, we know just how rough Java debugging is, especially  when it comes to large, complex Java Application Server systems that include multiple applications.

The Java Debugging Challenge

Traditional deployments are a major building block in enterprise applications across many verticals side-by-side with modern cloud-native technologies. At Rookout, we decided to offer high-end support for those environments right from the start. This was done in order to make available the most comprehensive assistance for our clients’ debugging needs. Support is offered for Java application servers, for example.

The debugging challenges our Java-using customers face include:

  • Running the application on a dev server instead of their own laptops, which makes orchestration and debugging harder.
  • Slow start time, which makes code changes expensive during debug/development sessions. Customers report start times of over an hour (!) under some conditions.
  • Highly multi-threaded environments (often reaching tens of thousands of threads.) This makes using a classic debugger impractical since breakpoints can cause timeouts in other parts of the application.

These issues make debugging slow and inefficient at best, negatively impacting overall developer productivity. And while a number of debugging tools are available, each has distinct plusses and minuses when it comes to accelerating the process.

Evaluating Java Application Server Debugging Tools

The main approaches to debugging Java Application Servers include:

  • Classic Debuggers
  • Logging
  • Logging + Hot Swapping
  • Production Debuggers

Let’s dig in a bit and look at the strengths and weaknesses of each, based on ease of use, ability to skip builds and restarts, application performance, and application stability.

Classic Debuggers

The trusty debugger, that we all use and love, is embedded in every IDE worth its salt. However, it often fails to deliver when it comes to Java Application Servers.

Ease of use is often poor, since debugging a process on a remote server can be hard. Other issues that impact debugger usability include the complex configuration of Java Application Servers, their multiple-class loaders, and the many applications running inside the process that is being debugged.

Skip Build/Skip Restart Debuggers allow you to skip builds and restarts by setting breakpoints anywhere in the code.

Application Performance. Debuggers often have significant performance overhead, since they are designed for dev — not production — environments. For expensive applications, the cost impact can be substantial.

Application Stability. A good debugger will not impact process stability from the JVM perspective. Unfortunately, breaking into an application causes all threads to be suspended. In a highly multithreaded environment, timeouts and other business logic failures will be the likely result.

In summary, while most developers are comfortable with classic debuggers, they are not optimal tools for debugging complex or multithreaded Java Applications Server applications, due to high performance overhead and their potentially negative impact on overall application stability.

Logging

The tried-and-true System.Out (or log4j/logback/JUL) allows data to be extracted from a running process, without attaching a debugger or breaking in. Simply adding a log line to the code and deploying a new version provides the dev with additional data he or she needs.

Ease of use. Logging is simple and familiar to most devs from their earliest exposure to computer science.

Skip Build. Unfortunately, not an option. Changing the application code requires rebuilding, which can take quite a long time.

Skip Restart. Adding a logline generally requires rebuilding and restarting, which is costly and time-consuming. In limited cases, hot-swapping can be used to avoid restarting.

Application Performance.  Application performance is generally fine, unless an expensive logline is added to a hot code path.

Application Stability. Logging should not impact application stability, unless an added logline throws an exception or causes an unanticipated side effect. In that case, the problematic logline must be removed, and the application rebuilt and restarted to restore stability.

In sum, while logging is a familiar, easy-to-use tool for most developers, in many instances it leads to time-consuming rebuilding and restarting.

Logging + Hot Swapping

What if you could add a logline without restarting the application you’re debugging? That’s where hot swapping, which allows you to change any code on the fly, comes in. However, it can also be a double-edged sword.

Ease of Use. Hot swapping entails a steep learning curve, and operating hot swappers on a remote server, within a complex Java Application Server, is tricky at best.

Skip Build. Not relevant for hot swappers, which require projects to be rebuilt, a  time-consuming process.

Skip Restart.  Good news here! Hot swappers allow restarts to be skipped! 🙂

Application Performance. Because hot swappers reload a new, functional piece of code that replaces an old one, they have almost no impact on performance.

Application Stability. Unfortunately, hot swapping often negatively impacts stability. While hot swapping is not intrinsically unstable, it tends to be an error prone process. Various hot swapping technologies place differing limits to what can or can’t be changed. In addition, some changes might inadvertently corrupt the application’s logic. Overall, for us, humans, repeatedly reloading application code is likely to hurt stability.

Summing it up: While hot swapping is attractive in theory, it often backfires by making it very easy to crash your own system or creating “fake” bugs.

Production Debuggers

Production debuggers — and Rapid Production Debuggers (RPD), their new-on-the-block cousins — are innovative tools designed to provide agile visibility into production environments.  Because a Java Application Server running on a remote dev machine more closely resembles a production environment than a classic development environment, production debuggers and RPDs are suitable tools for debugging Java Application Servers.

Ease of Use. Java production debuggers are quite easy to use. Just add a Java Agent to your code and configure it with your token.

Skip Build. Production debuggers allow you to skip rebuilding your code, much like a classic debugger.

Skip Restart. They do not require restarting your server, similar to classic debuggers.

Application Performance. Production debuggers perform better than classic logging solutions. Some include built-in performance protections (for production use) and “misbehaving” rules can be removed with a click.

Application Stability. They do the heavy lifting, enabling devs to insert breakpoints and get the data they need, while ensuring that applications remain stable.

Additional Functionality. Some production debuggers, such as Rookout, go beyond showing requested data and offer valuable functionality, based on integrating ETL (Extract, Transform, Load) capabilities directly into an app.

Using these functions, for instance, you can log a high-volume operation and upload it to a data platform such as DataDog or Elasticsearch, where the log can be stored and used to compare between executions/versions, searched, aggregated, and so on.

In sum, for Java Application Server debugging, production debuggers offer an attractive combination of efficiency, ease of use, and protection against performance and stability issues, as well as additional valuable functionality that is unique among debugging tools.

The Bottom Line on Java Debugging

In this article, we reviewed the various options for debugging Java Application Servers, including a novel approach to debug Java Application Servers in the development environment using production debuggers such as Rookout.

Stay tuned for our next article in this series, a step-by-step guide for getting started with Rookout on Java Application Servers such as Tomcat or JBoss.

Care to get your Java feet wet? Register for a free Rookout account today.

Rookout Sandbox

No registration needed

Play Now

Table of Contents
Get the latest news

The 5 Approaches to Production Debugging

Or Weis | Co-Founder

6 minutes

Table of Contents

A genius friend of mine used to say – “Just do bugless oriented programming- when you code, if you see you’re about to write a bug- simply don’t – it saves a lot of time”. As bugless oriented remains a concept for gods, we mere mortals better find other practical approaches that actually work.

Software is eating the world – reaching greater scales, speed, and complexity; software development is constantly racing, trying to evolve in answer to the increasing demand.

In the past few years, we’ve seen the rise of DevOps – a collection of methodologies and tools for software development with greater agility and scale. The surge including highlights such as CI/CD, containers, microservices, auto-scaling, resource orchestration, and serverless.

With each technological step forward, and each layer added – visibility of code execution becomes harder and harder to achieve. We are left with limited visibility at scale, and slow response times to understand and debug production environments.

The question is clear, facing these immense challenges – what are our options to approach production debugging?

Don’t worry be happy
(gathering debt)

The first approach while being rather common isn’t much of an approach at all, but rather a naive, happy-go-lucky mindset, simply choosing to ignore the entire issue.

Often a result of inexperience. Developers going down this path would look at a PoC, MvP, or simple working project; and decide that if it had worked so far – there’s no issue. They’ll worry about it if and when it breaks… The pain starts the moment they’d try to scale, translating the approach’s results directly in technical debt.

Ultra-orthodox testing (if you test it, it will run)

The testing as a solution approach is a popular leader, plainly stating -”test everything!”.
The mindset, which is spearheaded by the followers of the TDD cult, believes in leaving no room for doubt in production, and simulating and testing everything in comprehensive tests and staging environments, including harnessing more proactive tools such as chaos-monkey or Gremlins to stress test a system in extreme conditions.

The approach has a lot of merits – it is capable of reducing the bug-potential-surface, and can detect potential problems earlier- before they become costly. But due to the nature of things, and mainly human nature it cannot remove the potential for bugs and problems completely. In addition the approach usually includes high costs in the form of heavy (and sometimes slow) R&D cycles, heavy CI/CD infrastructure work, and heavy testing requirements (e.g. runtime, resources).

PokéMonitor
(gotta catch’em all!)

In a similar fashion to the testing approach, the logging and monitoring approach calls for its disciples to catch and collect everything! – “Plan and write all the log lines you’d ever want beforehand”, “Deploy all the monitoring agents and SDKs from day one- and save all their data as long as you can”. The approach has a lot of value when things go wrong and require fixes- the more you collect the higher the chance you’ll have the information you need to understand and resolve the incident. In addition collecting everything can have surprising effects and value- when combined with analysis methods (e.g.anomaly detection) which can produce unexpected insights. Yet the method has three key disadvantages –

a. Predictions:

Since it’s impossible to literally collect every piece of data all the time; developers are required to predict the future (which data will be needed) and to prioritize collection – an extremely challenging task even for the most experienced, made even more complex due to conflicts of current mindset (design and create vs. debug and monitor).

b. Signal to noise ratio:

Even when succeeding to collect most of the data – you have to overcome the dark-data problem, and to overcome false positives. It’s quite a daunting task to process large amounts of data and be able to find the relevant pieces per case in time.

c. High infrastructure and maintenance costs:

Efficient data collection is a software engineering challenge by itself- especially if you’re aspiring to collect everything.

Costs include high compute resources (e.g. CPU, memory, networking, storage) , and a high dependency on 3rd party monitoring solutions (Agents and SDKs) in the form of service/license costs, maintenance costs, and worst of all the cost of increasing the bug-potential-surface by including 3rd party solutions / code.

The collect-all approach works well with and is often adopted with the test-everything approach (both sharing a puristic way-of-thinking, and zealous followers).

Move fast
(and break things)

In sharp contrast to the pursitc collect-everything and test-everything approaches – this approach tries to address production debugging by increasing the speed of software updates. Basically saying “It’s ok if things aren’t perfect with the software,as long as we can deliver new software quickly enough to respond to issues”

This approach usually invests less in infrastructure and testing in favour of tighter monitoring and alerting. More crucially this approach relies heavily on strong CI/CD capabilities and trying to minimize R&D and deployment cycles.

This approach has clear benefits to general R&D speed, response speed, and cost reduction. Yet suffers from two painful disadvantages- one obvious, and one deeply hidden.

a. Obvious disadvantage – Quality for speed trade off:

While gaining speed, the approach pays in overall R&D and infrastructure software quality.

b. Hidden disadvantage – Coupling Debugging cycles with R&D and Deployment cycles:

In non production environments, and in production of simpler projects- debugging is a simple straightforward process- “Connect, inspect, understand, debug” But in this case and approach we are required to mangle in other more complex and often asynchronous processes – those of general R&D and general deployment – creating a heavy, slow, complex, synchorunes system.

Agile Data-layer
(visibility set free)

The data-layer approach is the newest, building on top of existing agile / DevOps techniques, including the move-fast approach. The approach focuses on decoupling the data layer from the reset of the application – and reaching a state where the needed visibility into production can be reached on demand, preferably with as less as possible effects and dependency on other software aspects.

This approach has several clear benefits – primarily agility and stability – as it provides greater visibility faster and without risking other elements. In addition it untangles the R&D/Deployment cycle and debugging cycles – freeing up R&D and management resources.

The main disadvantage of this approach is the need to design the data-layer for agility and or at least a need to use a agile-data-layer solution (such as Rookout).

In the end the ever increasing challenges of software development can’t be tackled by a single approach, and a combination of all the five approaches listed above is required to reach real and effective production debugging. Already when reviewing organizations today we find multiple approach combinations, yet more often than not, organizations would over-focus on one or two specifics approaches.

Moving forward, organizations will need to find ways to combine all approaches in smart and case specific ways, reaching better understanding of their software and obtaining true agility in production debugging.

Rookout Sandbox

No registration needed

Play Now

Table of Contents
Get the latest news

Rookout Announced Launch and $4.2M Funding

Or Weis | Co-Founder

3 minutes

Table of Contents

A few days ago we announced Rookout’s official launch and $4.2 million in funding by TLV Partners and Emerge. Obviously, this is a very important milestone in the company’s life and a great moment for us to stop and reflect on the road we have traveled so far.

From humble cyber beginnings

When Liran and I embarked on this journey back in 2016, after many years of working in cybersecurity, we knew we wanted to do something new and impactful, while leveraging our low-level engineering experience. Devops was a clear choice for us, since as developers, we were excited about solving our own problems and working with great likeminded people. We set a goal to make life (and specifically the lives of software developers) better, while creating a thriving business that delivers real business value to our clients.

Nir Eyal, the author of Hooked, says that there are two things you should ask yourself when starting a business: “Do you believe that you’re materially improving people’s lives?” and “Are you the user?” Being able to answer both of those questions with a “yes” measurably increases your chances of success. With that understanding and passion, our journey began.

What (de)bugged us?

We started with debugging code in production — our own pain point as developers, focusing in particular on the absurdity of having to spend hours of work to gain insights into our own servers. “It’s our server, our code, our application – why can’t we just click a button to get at our data?!” This inability becomes painfully clear when things break or fail. And as the pace and complexity of software development increases, so does the pain.

We envisioned a day when the tedious process of collecting data from live code would be easy, and accomplished with just a few clicks. Best of all, we envisioned a process that requires no pre-planning (instrumentation) and is fully decoupled from ongoing deployment processes.

How would this look? You’d no longer have to write additional dedicated code, stop your app, re-deploy, and restart the app — only to discover that you still don’t have the data you need, and have to start the process again. To be fair, on the rare occasion you actually get the right data on the first try. But as a developer – how I wish it was a more common scenario!

How Rookout helps dev teams?

We spent months talking to like-minded developers, exploring what would help them most in their day-to-day lives. That’s how we chose to focus on two aspects of the same challenge: On the one hand, the ability to collect any type of data on-demand. And on the other, the ability to see and leverage that data in the wide range of destinations that developers use.

Some people choose to send more granular data to their APMs, log aggregation, or exception management systems, while others opt to send it to alerting tools or to their database. We decided that our solution should be agile enough to support all these requests.

We quickly realized that we’d be embarking on wonderful friendships between us and the many other players in our ecosystem which help DevOps and Dev teams do their jobs better.

The most important step a dev can take

While we’ve already come far, these are still just the first steps of our journey. Some of our research and hard work has already paid off, and the dozens of companies that were willing to join us in stealth mode are seeing real value. Yet we still have a long row to hoe.

With the support of our wonderful investors at TLV Partners and Emerge, our great advisors, and our awesome, constantly growing team we plan to continue taking the most important steps each of us can take – the next one.

There are many more great things to come at Rookout. I invite you to join our journey!

Rookout Sandbox

No registration needed

Play Now

Table of Contents
Get the latest news

Quick Guide to Automating TLS Endpoints in Kubernetes

Itiel Shwartz | Lead Production Engineer

4 minutes

Table of Contents

Setting TLS endpoints in Kubernetes can be a Sisyphean task. What if you could make it a ‘set and forget’ kind of task instead? Well, now you can.

At Rookout, we use k8s to handle all of our services. We wanted to automate the process of adding new services that require SSL and a custom domain name. As part of our CI/CD process, we also wanted to allow developers to deploy a full env from their branch, which entailed seamlessly creating new domains. For example, a developer working on a branch named “best-feature-ever” should test it at best-feature-ever.rookout-test-domain.com.

TL;DR we documented all of our steps so feel free to jump right in: https://github.com/Rookout/k8s-auto-dns-and-tls-guide

What are the benefits of automating TLS endpoints in Kubernetes?

  • It allows your DNS to be configured as code (infrastructure as code)
  • It allows you to handle SSL automatically
  • It allows you to easily create a new environment with a domain, so you can test features/branches more easily, in a more unified way
  • It automates multiple processes that everyone hates, making them easy to do.

Follow these 7 steps to automate TLS endpoints

It took me about 2 days to crack the complete process, but this time-saving post should allow you to automate your TLS endpoints in just 15 minutes of work, give or take, with the help of a few open-source tools. Once you complete the process described in this guide, fully configuring a new DNS with a SSL certificate in your Kubernetes cluster will take only a few seconds!

* Note:  We assume that you’re using GKE domains. If not, you might need to change a few things.

1. Clone our demo repo, create a Kubernetes cluster, and add yourself as cluster admin

export EMAIL=YOUR_EMAIL
Git clone https://github.com/rookout/k8s-auto-dns-and-tls-guide
gcloud container clusters create k8s-aut-dns-and-tls-guide –num-nodes=2 –scopes https://www.googleapis.com/auth/ndev.clouddns.readwrite
kubectl create clusterrolebinding cluster-admin-binding –clusterrole cluster-admin –user ${EMAIL}

Make sure you have –scopes https://www.googleapis.com/auth/ndev.clouddns.readwrite

2. Install Helm

Helm is a tool that streamlines installation and management of Kubernetes applications. Think of it as apt/yum/homebrew for Kubernetes.
Helm has two parts: a client (Helm) and a server (Tiller). Tiller runs inside of your Kubernetes cluster and manages releases (installations) of your charts*. Helm runs on your laptop, CI/CD, or wherever you want it to run.

*Charts are curated application definitions for Kubernetes Helm

First, install Helm on your laptop:

curl -o get_helm.sh https://raw.githubusercontent.com/kubernetes/helm/master/scripts/get
chmod +x get_helm.sh
./get_helm.sh

Next, install Tiller on your cluster:

kubectl create serviceaccount –namespace kube-system tiller
kubectl create clusterrolebinding tiller-cluster-rule –clusterrole=cluster-admin –serviceaccount=kube-system:tiller
helm init –service-account tiller –upgrade

3. Install our ‘hello world’ example

helm install hello-world –name hello-world –dep-up -f hello-world/values.yaml

Verify that you’ve installed it:

kubectl get pod

And now, really check that it’s up:

kubectl port-forward POD_NAME 8080:80

4. Install external DNS controller

To simplify matters, we’ve created another Helm chart for the infra stuff — the things that should be created just once for each cluster, not the ones that must be deployed for every new service.

export DOMAIN=YOUR_DOMAIN
export DOMAIN_NAMESPACE=YOU_DOMAIN_NAMESPACE
helm install infra –name infra –set externalDns.enabled=true –set domainNamespace=${DOMAIN_NAMESPACE} –dep-up
*endpoint.fake-domain.com -> DOMAIN=endpoint.fake-domain.com, DOMAIN_NAMESPACE=fake-domain.com

5. Install Nginx ingress controller and config the Nginx

An ingress controller is a daemon, deployed as a Kubernetes Pod, that watches the apiserver’s /ingresses endpoint for updates to the ingress resource. Its job is to satisfy requests for ingresses. To deploy an Nginx controller for each Helm, deploy just as we added it to requirement.yaml:
helm dependency build hello-world

helm upgrade –install hello-world hello-world –set nginx.enabled=true –set domain=${DOMAIN} -f hello-world/values.yaml

This step sets up both the ingress and the controller.

6. Install cert-manager

cert-manager is a Kubernetes add-on that automates management and issuance of TLS certificates from various issuing sources. It periodically ensures that certificates are valid and up to date, and renews certificates at the appropriate time before they expire.

helm install –name cert-manager stable/cert-manager –namespace cert-manager
helm upgrade infra infra –set externalDns.enabled=true –set certManager.enabled=true –set email=${EMAIL} –set domainNamespace=${DOMAIN_NAMESPACE}

7. Wrap if it all up

Once the infra part of the system is deployed (cert manager + external dns + nginx controller), we have all the components needed to create new domains with SSL on the fly. All that’s left to do is to create the certificate and add it to the ingress.

You can add it automatically…

helm upgrade –install hello-world hello-world –set nginx.enabled=true –set domain=${DOMAIN} –set tls.enabled=true -f hello-world/values.yaml

And….. we are done!

Now you can deploy as many services as you want, each with its own custom DNS and SSL, without repeating this process ever again! I hope you find this useful and the steps are easy to follow. The reward is clear — using an automated process instead of a manual one is a habit that most people are probably very quick to adopt! 🙂
Feel free to send me comments or let me know if I missed something — I’d love to hear your feedback.

Rookout Sandbox

No registration needed

Play Now

Table of Contents
Get the latest news

My Big Fat Alpine Crash

Liran Haimovitch | Co-Founder & CTO

4 minutes

Table of Contents

It all started when I was testing Rookout on Docker (with Alpine and Python).
Rookout is a new approach to data collection and pipelining from live code. We basically allow developers to request any piece of data with just a few clicks and view it on their machine in any framework, cloud, and the environment they use.

So, there I was, testing our application when I realized that some commands were working just fine and some commands were being ignored.

The auto-restart destruction

The situation seemed pretty odd. Why would the container respond to some of the commands and ignore others? I started with a standard SSH and ran few basic Docker test commands such as “docker ps” to see which containers were running.

I noticed that the agent restarted 139 times in quick succession (!), while it had been running only one second, which led me to believe it was constantly crashing.

After running “docker event”, my suspicion was confirmed.

I immediately noticed that the ‘demo_agent_1’ was constantly dying when some commands were sent and that Docker was silently restarting the application. Now the question was: Why is the container dying?

Understanding the real issue: A memory problem

I ran “docker logs” but it wasn’t informative enough to shed light on my problem, so I decided to get inside the container to manually run the process.

This time, I got some additional information:  A segmentation fault was crashing the process and causing the Docker container to exit.

There are two ways you could debug such Python crashes under Linux. Both provide similar results.

Option 1: Install GDB and execute Python under it

  • We’ll start by installing GDB and the Python debug symbols:
    $ apk add gdb python2-dbg
  • Let’s run our script under GDB. Since GDB expects a binary and will not process bang lines, we must explicitly execute Python with the path to our script:
    $ gdb -ex=run –args python /usr/bin/rookout-agent
  • And now we have the debugger stopping the process on the signal

Option 2: Use GDB to open and investigate the crash dump:

  • We start by installing GDB and the Python debug symbols:
    $ apk add gdb python2-dbg
  • Load the core dump of the Python process in GDB:
    gdb python -c core

Note: If you can’t find a crash dump file, follow this link to make sure it’s generated and figure where it’s located

Whether we used live debugging or loaded the core dump file, we see exactly where the segfault is happening: Python/getargs.c:1476

Aha! moment: stack overflow

SEGFAULT is a Unix signal indicating an invalid memory access performed by our application. Invalid memory access is usually triggered by one of two conditions:

  • Using an invalid pointer (for example: double free, use after free, uninitialized pointer). As Python does not allow us to directly access the process memory, this could only be caused by a bug in the underlying CPython implementation or by a native extension module.
  • Using too much stack memory (commonly known as “Stack Overflow”. This is often caused by deep (or infinite) recursion**.

We know that the exact location of the invalid memory access from GDB. Let’s take a look at the code (GitHub):

You can clearly see that line 1476 is the function’s opening curly braces, where the stack initialization code occurs. This surely means we have a stack overflow 🙁

The root problem

But wait a second! If our stack is so short, how did it already reach an overflow? As you may know, Alpine Linux is based on msl libc  to minimize resource usage (especially memory). If you dig around the web long enough, you’ll eventually come to realize that musl was originally designed for embedded systems, and one of its differences is a very small default stack size of 80KB. Python’s CPU & memory are hungry and were designed to use much larger stacks, even for very simple scripts.

The solution

Fortunately, threading.stack_size can be used in Python to increase the underlying OS stack size.

This is how I fixed it:

STACK_SIZE = 1024 * 1024

def execute():
stack_size(STACK_SIZE)
main = Main()
thread = Thread(target=main.execute, name=”main”)
thread.daemon = True
thread.start()

try:
while thread.isAlive():
thread.join(1)
except KeyboardInterrupt:
pass

When using this workaround, pay attention to the following caveats:

  1. Do it as early as possible, before importing any other modules. If these modules are using a significant stack on initialization they may crash, and if they create a new thread before you set the new size their threads will not get the bigger stack!
  2. Do not utilize the original main thread, as it does not have the new and improved stack 🙂
  3. In your original main thread, it is important to expect and process Unix signals, especially SIGINT, indicating ^C was pressed. It is up to you if to do an orderly cleanup or simply exit the process.

The happy ending

In the months between encountering this bug, working around it and publishing this blog post, the bug was fixed in the latest official Python Docker images and in the Python APKs for Alpine 3.7 and Python2. If you haven’t upgraded yet, here’s yet another reason to do so. If for some reason you cannot upgrade, feel free to use the above code snippet as a workaround.

Rookout Sandbox

No registration needed

Play Now

Table of Contents
Get the latest news

Distributed Tracing with Jaeger 101

Itiel Shwartz | Lead Production Engineer

2 minutes

Table of Contents

We all know of – or maybe work for — organizations that are phasing out old monolithic systems in favor of distributed systems with microservice architectures. And for good reason! Microservice architectures allow system components to be scaled independently; deployments are decoupled and continuous; and small, agile dev teams can work quickly, efficiently, and in parallel.

But when it comes to debugging, the romance with microservice architecture fades mighty fast. As complex, distributed systems at scale, they are exceptionally hard to debug: There is no way to isolate a single instance, as you would do for a monolith, and reproduce the problem.

Root causes of failure can rarely, if ever, be identified by looking at individual services, since the sum of the parts, in this case, is definitely not equal to the whole. The performance of all the distinct services does not provide a full picture of application performance.

I recently discussed the topic of Distributed Tracing at a Meetup and presented a demo of Jaeger, a more robust open-source version that adheres to OpenTrace standards. Distributed Tracing allows us to track requests as they pass through the multiple transactions and workflows of distributed systems. Once reassembled, timing and other metadata generated during tracing provide a valuable, complete picture of runtime application behavior.

Distributed tracing, however, has its drawbacks as well, in the form of source code instrumentation that is complex, fragile, and difficult to maintain. In addition, many current systems use application-level implementation with incompatible APIs, to which developers are reluctant to commit, particularly for multilingual systems that require a different tool for each platform.

To address these issues, the OpenTracing project advances the development of robust, vendor-neutral APIs and distributed tracing instrumentation for popular platforms. For the demo, which entailed transforming a monolith into several small microservices, I used Jaeger, distributed tracing tool developed by Uber Technologies. Jaeger can be used to monitor distributed, microservice-based systems for context propagation, distributed transactions, root cause analysis, and more. And because it adheres to OpenTrace standards, it allows you to move from Jaeger to datadog (and other solutions) without rewriting code.

I am happy to share my slides as well as the code that I used for my demo. Have a look, recreate the demo for yourself, and definitely share feedback if you have any question!

Rookout Sandbox

No registration needed

Play Now

Table of Contents
Get the latest news

Debug Live Remote Electron Apps With New Rookout Service

Or Weis | Co-Founder

2 minutes

Table of Contents

Electron, the popular framework for building desktop apps, has much to recommend it: It allows developers to quickly build feature-rich desktop apps and deploy them directly to end-users. No wonder industry leaders like WordPress, Slack, and Discord use it to create the desktop versions of their browser-based apps. But while Electron is based on web technologies, when it comes to debugging, the drawbacks of desktop software apply.

For desktop applications, whether Windows, MacOS or Linux, every machine is a unique production environment. More often than not, bug reports (when users bother to send them) and exception reports do not provide all the data developers need to reproduce, on a local machine, the issues that led to a crash, especially when interactions with microphones, webcams and other devices are involved. Without complete and accurate information about the user environment, developers have only partial visibility, at best, into the cause. When an environment is particularly tough to recreate or an issue is rare, debugging may be hardly more focused than a shot in the dark. It’s not rare to hear an Electron user treating a hard-to-solve bug as ‘fate’ and learns to live with the consequences of lesser performance or else.

But now, Rookout has good news for Electron developers — a new service for a remote live debugging solution that provides full visibility and code context from the live Electron app. Rather than relying on local testing and simulation, developers can now debug apps in situ, as they run on the end-user machine.

When an exception manager such as Sentry issues an alert, Electron developers can use the Rookout IDE-like interface to remotely set non-breaking breakpoints in the troublesome install of a live Electron app, without installing any additional software on the end-user’s computer. With full visibility into live app performance, they can trace issues as they occur, then rapidly develop a fix to push out.

Guy Reiner, VP R&D at Aidoc who uses an Electron-based app for an AI solution analyzing medical images explains that their app runs on a hospitals’ local network and doesn’t constantly send data back to their servers, so tracing a bug for a client on a different continent isn’t easy.

“Rookout makes it possible to find bugs without spending hours on log-collection and trying to simulate the unique real-world environment of a particular hospital network”.

Sign up for a free account to test the power of live-debugging of your Electron app.

Rookout Sandbox

No registration needed

Play Now

Table of Contents
Get the latest news

A Bittersweet Production Debugging Memoir

Polly Alluf

3 minutes

Table of Contents

One day in 1997, my then-boyfriend, who was studying computer science, came home and said, “I had a good interview today.”
“What does the company do?” I asked.
“Not entirely sure,” he replied, “but it lets you see when your friends are surfing the net. And the cool part is that it sounds like an elephant!” The product was called ICQ.

Within a few months, I was a savvy ICQ user. My boyfriend introduced me to Glenda, a devoted Swiss ׳tester׳ of the live Mac version of ICQ. “I can trust Glenda to report bugs and glitches more reliably than our internal QA team and faster than our support team,” he claimed. To show his appreciation, we invited Glenda to spend her summer vacation at our place on the Mediterranean. A well-deserved reward for her hard and fruitful work!

Fast forward to 2018.

Today, almost every company is a software company, but where are the enthusiasts like Glenda, who save you time and trouble by finding bugs and reporting them quickly? You may still have those enthusiastic users, but you can’t really count on their help to uncover every production issue.

No matter how hard you try to catch and resolve bugs early in the SDLC (Software Development Life Cycle) — bugs, glitches, and security holes still happen. And when they do, for every extra minute that they persist, you lose business, see customer satisfaction plummet, and waste pricey developer time. If all hell really breaks loose and your issue becomes a public matter, it can damage not only your reputation but also shareholder value. Ouch!

Often quoted charts showing that costs of fixing bugs increase by a factor of 4–6 between testing and production may seem outdated. However, recent studies show massive increases in losses due to software errors, mainly bugs, in production systems. Scalability comes at a cost. When a product that is very popular breaks, more people are affected. It only takes a few unhappy users to shame you on Twitter or Facebook and set things on fire!

True, finding bugs during the design, test, and dev stages is always better and much less costly than discovering them in production. But the reality is that some bugs will always find their way into production. Since the cost of these bugs is drastically higher, and most users aren’t as tolerant as dear Glenda was, you better have the ability to debug them quickly.

Here’s another fact: Back in the days when Glenda would kindly point out that there was an issue going on, your app was running in a server that was under your desk or in the room next to you.  It wasn’t in the cloud, it wasn’t containerized, and it most certainly wasn’t popping up and then disappearing on serverless. In other words, gaining visibility to production bugs nowadays is no simple matter, and the evolving ecosystem around observability is clear proof.

Monitoring, logs, exception management tools, and the like are all trying to give you better control over your somewhat elusive (yet fantastic, fast, agile and scalable!) production environment and to provide more clarity about your live code’s behavior.

Rookout adds a critical layer of in-depth visibility on top of these tools by letting you immediately collect any type of data from production, even without pre-instrumentation or further redeployment. So when a Glenda-bot pages you in the middle of the night, you’re now much more prepared to hunt production issues. Go get them!

Rookout Sandbox

No registration needed

Play Now

Table of Contents
Get the latest news

A “From the Trenches” Guide – Integrating Datadog Monitoring Tools with Kubernetes and Python

Liran Haimovitch | Co-Founder & CTO

5 minutes

Table of Contents

A few weeks ago we installed Datadog in our staging and production environments.
All in all, it was a smooth ride, with a few small hiccups that we resolved along the way. If you’re about to install Datadog and your environment is similar to ours (with Kubernetes, Python and these other goodies) you should find this post useful.

As a brief introduction, Rookout’s SaaS solution offers Dev/Ops teams some sleek and handy tools for rapid production debugging, including the ability to collect ad-hoc custom metrics and send them to Datadog.

When customer adoption started soaring and we were getting millions of messages per day from our clients, we figured that it’s high time to take our SaaS performance and availability monitoring to the next level by adding Datadog to our own setup.

API, Agent, APM

Datadog’s monitoring solution is renowned for its ease of use and friendly pricing. That makes it a perfect match for our needs as an early-stage startup. They offer 3 levels of monitoring capabilities:

  • Monitoring third-party SaaS through an API
  • Monitoring OS and third-party applications using an agent
  • Monitoring application performance (APM)

All three levels are relevant to our business. Each requires a different degree of effort and tweaking to integrate with our existing orchestration tools.

The Rookout Environment

Rookout’s web-facing production environment is based on the following components:

  • Runs on top of Google Cloud Platform.
  • Uses Google’s DNS and Load Balancing services to expose our SaaS to the world.
  • We use Kubernetes for most of our orchestration needs. GCP has built-in Kubernetes support (GKE), which works amazingly well. We deploy applications to Kubernetes using Helm (see below).
  • Our application is written in Python with underlying infrastructure of Tornado and Flask, allowing us to maintain a rapid pace of development and experimentation.
  • We use Redis to provide us with reliable, performant datastore out of the box. Redis runs on dedicated computing instances in a high availability (Sentinel) configuration.

What the Hell is Helm?

Helm provides useful functionality on top of Kubernetes:

  • Defining applications in a reusable way (called charts)
  • Sharing applications across the Kubernetes community
  • Installing applications on your cluster in a reusable way

At Rookout, our application is defined as a Helm chart and deployed multiple times to the same cluster (production, staging, etc.). We also use Helm to deploy infrastructure services such as Fluentd.

Tips for Smooth Integration:

1. Datadog GCP and GKE integration

Datadog integration with GCP is pretty straightforward and is accomplished by adding a service account with the necessary permissions to your GCP account. Easy-to-follow instructions can be found here. In order to monitor additional elements of GCP (in our case GKE) simply install integrations from the Datadog integration page.

2. Install Datadog Agent on Kubernetes

A ready-to-use Helm chart is available here for the Datadog agent. If Helm is installed you can install the Datadog agent on your current cluster simply by running the following:

helm install –name datadog-agent-v1
–set datadog.apiKey=<DataDog API Key>
–set datadog.apmEnabled=true
–set daemonset.useHostPort=true
stable/datadog

A quick explanation of the command:

  • datadog.apiKey is the API key provided to you by Datadog and can be found here.
  • datadog.apmEnabled configures the Datadog agent to run with APM support.
  • daemonset.useHostPort exposes the Datadog agent to the network using the host’s port.

Note! This super-convenient installation does not create a Datadog agent service on our Kubernetes cluster. Instead, it relies on exposing the host’s port.

3. Install the Datadog APM for Python

This one takes a few steps, so be patient.

Start by adding the PyPi packages for the Datadog APM add Datadog SDK to your requirements.txt file. While the Datadog SDK is not strictly needed, we’ll put it to good use.
Load the Datadog APM and connect it to the Datadog agent. Connecting the Datadog APM to agent’s exposed port can be a bit tricky for our use case since we do not know the agent’s IP address or hostname.
Fortunately, Datadog solves this problem nicely in their more mature Datadog SDK with a simple, container-oriented configuration. While we can’t use the same configuration for the Datadog APM, we can reuse the same code:

# Get the Datadog agent’s ip address
from datadog.dogstatsd import route
hostname=route.get_default_route()

# Connect the APM to the agent
from ddtrace import tracer, patch_all
tracer.configure(hostname=hostname)

# Activate the APM
patch_all()

4. Configure Environment Name

The Datadog APM behaves inconsistently with environment variables. Some affect the APM only if they’re executed from command line. Quite often, they aren’t properly documented.
The DATADOG_ENV variable is one such is environment variable, so if we want it to take effect, we must set it manually (copied from here):

if ‘DATADOG_ENV’ in os.environ:
tracer.set_tags({“env”: os.environ[“DATADOG_ENV”]})

5. Add Web Framework Support

To add web framework support, update the patch_all command to the following:

patch_all(tornado=True, flask=True)

6. Fix Call to Request Handler on Finish

Flying colors? Not quite yet. After setting this configuration (which works perfectly!) we encountered an underlying Tornado bug.

The tornado.web.FallbackHandler is the recommended way to use WSGI containers in Tornado applications. However, it did not properly call RequestHandler.on_finish, which the Datadog APM uses for tracing. As a quick workaround, we subclassed FallbackHandler:

class MyFallbackHandler(tornado.web.FallbackHandler):

def prepare(self):
super(MyFallbackHandler, self).prepare()
self.on_finish()

And used it to call the WSGIContainer:

application = tornado.web.Application([
(r’.*’, MyFallbackHandler, {‘fallback’: WSGIContainer(wsgi)})
])

Wrapping it Up

As a DevOps expert, you’ve probably had the sometimes dubious pleasure of installing products. So you know that it can get tricky at times — in fact, so tricky that you might be tempted to stop the installation and just do without it.

It’s important to remember that the tips, tricks, and workarounds that you develop to overcome these challenges are valuable resources. Be generous about sharing them, and check around carefully for smart tips and tricks like the ones we shared here.

At Rookout, we’re delighted to be working with amazing resources and solutions and will keep sharing the tips we develop to make integrations as smooth and easy as they can possibly be. We look forward to hearing great tips from our partners as well!

Wishing you a smooth integration 🙂

Rookout Sandbox

No registration needed

Play Now

Table of Contents
Get the latest news

4 Debugging Lessons I Learned From House M.D.

Oded Keret | VP of Product

6 minutes

Table of Contents

In recent years, dev culture got some love from Hollywood and our favorite network shows. The developer image has gone through quite a transformation as well. In the ’80s and ’90’s it was the geeky, socially awkward, living in their parents’ basements stereotype that prevailed. Today, these are the geeky, socially awkward, adorkable characters who hack into the NSA mainframe, found Facebook and argue over tabs versus spaces.

As I see it, the only thing missing from those movies and TV shows is capturing the drama of developing, testing and debugging in the same way that House, M.D. was able to capture the drama of diagnosis and treatment. Most of us don’t have medical degrees, but we were still able to follow the plot. Similarly, people who aren’t software engineers may be able to follow a team of too-attractive developers troubleshooting a race condition before it wrecks production in the middle of the night.

After all, everything I needed to know about debugging, I learned from Dr. Gregory House.

Everybody Lies

One thing that makes House, M.D. a pleasure to watch is the way the show makes diagnosing a patient feel like a murder mystery. Similarly, as Filipe Fortes once tweeted, “Debugging is like being the detective in a crime movie where you are also the murderer.”

Whether you are debugging your own code or someone else’s, you know the code will behave in strange, unpredictable ways. And it will become even more unpredictable when you try to debug a cloud-native app or an app that behaves differently in staging or in production. When you face a bug that simply Does Not Reproduce, you start questioning your log lines, your tests, even your own code. So what would House do?

House would doubt everything, especially his patient. House would send his staff to question the patient’s family, to investigate his home, to find hard evidence that the patient is lying. Similarly, as you debug a sneaky bug, you must visit its “home” (the environment where it’s running) and accept nothing at face value. Track its behavior step by step. Look into every log line. Examine the value of each and every variable on the stack frame as if it was a murder suspect, or a clue to the mystery, or both.

It may require a lot of patience, and you will definitely need the right tools to be able to do that in remote, dynamic environments. But hey, if it were easy, anyone could have been like Dr. House.

Tests take time. Treatment is quicker.

Another thing everyone knows about Dr. House is that he doesn’t play by the rules. When Dr. Cuddy is worried about preventing a possible lawsuit, Dr. House dismisses her and does everything in his power to save the patient. That usually means treating the patient for one suspected disease in an attempt to dismiss another. All for the sake of saving time.

When an urgent issue is faced by a key customer, or when an unknown exception is preventing a bunch of clients from making online purchases, common sense tells you to stay calm and add log lines. Push a bunch of log lines, covering every single snippet that may be related to the issue. Use these new log lines to trace the root cause of the problem.

This works well, in theory. In practice, you will be going through your CI/CD cycle every time you add a few log lines. And after adding them you’ll learn the bug hasn’t been caught yet, and you’ll expand your search area by adding more loglines and waiting for yet another CI/CD cycle. And so on, and so forth. To make matters worse, adding and collecting too many log lines will impact your application’s performance. Which means that much like Dr. House, you may end up killing your patient in an attempt to isolate the disease that is killing him.

If only there was a way to add and remove log lines with a click of a button. A way to bypass the CI/CD pipelines and prevent the need for an overflow of log lines killing your app. Only a 10X debugger like Gregory House, M.D. (Medical Debugger) would know about such a tool. 😉

Look at her eyes

About two-thirds into every episode, the team would think they have found the root cause and saved the patient, only to learn that the treatment they gave has exposed another, seemingly unrelated symptom, which tells them they were wrong all along. “Look at her eyes. She’s completely jaundiced. Her liver is failing.” Or something similar would ramp up the drama of the episode even further.

The same happens too often with devs after we push a supposed fix to our production environment. Initially, things look calm and we congratulate ourselves for solving the problem. But soon enough things start crashing and burning, and we look at our APM dashboard just as dramatically as House would be looking into his dying patient’s eyes.

Common sense tells us to roll back to the last stable build we saw. Spend days or weeks isolating the problem locally, and then push another fix. It may even work. But right now, our production environment is showing us where the problem is. If only we had the log lines and House’s superior intellect to see it.

Look at her eyes. Her Response Time is spiking. She’s completely crashing!

As we prepare for rolling back, we do what we can to fetch every possible log line from the areas where the problem reproduces. We do it with a click of a button, and the log lines are immediately streamlined into our log aggregator and tracing tools. The increased observability helps us “Pull a House” and dramatically find the root cause just in time to save the patient. Queue dramatic music, House riding away on his motorcycle, as his team looks bewildered at his genius. Fade to Awesome.

It’s never Lupus

In production debugging, as in House M.D., we know only one thing for sure: It’s never Lupus. Your code may appear to be lying to you, but if you are able to debug it remotely just as you debug it locally, you’ll end up finding the truth. Common sense tells you to push a bunch of log lines, wait for the CI/CD flow, and look for the needle in the haystack. But you know better than that. You add log lines with a click of a button and only add the ones you need.

And as you look deep into your application’s eyes (or, well, its dashboards), you know one thing for sure: only you can save her. You can do that by playing by your own rules. By being smarter than everyone else and deflecting your deep emotional involvement via wit and sarcasm. By debugging in production just as if you were debugging locally. And of course, by consuming vast amounts of a substance that helps you stay focused and alert as you debug a crash at 2 am. Yes, I know coffee isn’t as dramatic as Vicodin, but hey, it’s a show about developers.

I know I would watch that show. Especially if they cast Hugh Laurie as the lead, the 10x debugger. How about you? Who would you have them cast as yourself?

Rookout Sandbox

No registration needed

Play Now

Table of Contents
Get the latest news

How to Use a 3-Minute Hack for Locally Building a Native Extension

Liran Haimovitch | Co-Founder & CTO

2 minutes

Table of Contents

Serverless is hot in the world of software architecture. Many vendors dedicate themselves to serverless, and of course, Amazon, Google, IBM and Microsoft are heavily invested in it. But like any other hot technology, it has some drawbacks.

In this post, I share a super-handy hack for those times when you need to build a local native extension.

Necessity is the mother of Invention and our hack is no different. Rookout helps with production debugging across platforms ranging from monolithic to serverless but many of our customers are already using serverless more extensively, and they’ve driven us to dive deeper into this technology.

Rookout support for Python and Node relies on native extensions to do its magic. If you’ve read this far, you probably know that running native extensions on Lambda and other serverless technologies requires you to prepackage the correct binaries into the function zip file. Since AWS Lambda runs on Amazon Linux, this can be a pain if you are running on Windows, Mac, or Debian Linux.

The Amazon recipe for building native extensions for Lambda builds them on a dedicated EC2 instance, which is far from the most pleasant experience. Many of our clients have asked us to help them build and deploy Lambda functions from any OS.

Following brainstorming sessions, some of our engineers came back with a nifty little hack I’m happy to share with you. Turns out, Docker can easily perform a local task as if it was running on our own computer. The following command line taken from the official Docker guide allows you to run a Docker command within the current folder:

docker run -v `pwd`:`pwd` -w `pwd` -i -t ubuntu pwd

For Docker containers to simulate the AWS Lambda environment, we need to look no further than the LambCI project. To build AWS Lambda compatible native extensions, simply run the following command line:

Node:

docker run -v `pwd`:`pwd` -w `pwd` -i -t lambci/lambda:build-nodejs8.10 npm install

Python:

docker run -v `pwd`:`pwd` -w `pwd` -i -t lambci/lambda:build-python2.7 pip install -r requirements.txt

We can make this even better by hiding the nitty-gritty details of using Docker to build extensions by using scripts. For instance, let’s check out this package.json file that allows you to build extensions on the fly:

{
   “name”: “example”,
   “main”: “index.js”,
   “dependencies” : {
   },
   “scripts” : {
      “install-modules”: “docker run -it -v `pwd`:`pwd` -w `pwd` node:6 npm install”,
      “build-package”: “zip -r package.zip *”,
      “build”: “npm run install-modules && npm run build-package”
   }
}

And to build just run:

npm run build

Both our team and our customers find this hack to be a super-helpful time saver while developing Lambda functions. I hope you find it useful, too.

Rookout Sandbox

No registration needed

Play Now