Rookout is now a part of the Dynatrace family!

Table of Contents
Get the latest news

How To Not Freak Out When Designing A Product For Developers

Ortal Avraham | Lead UX

7 minutes

Table of Contents

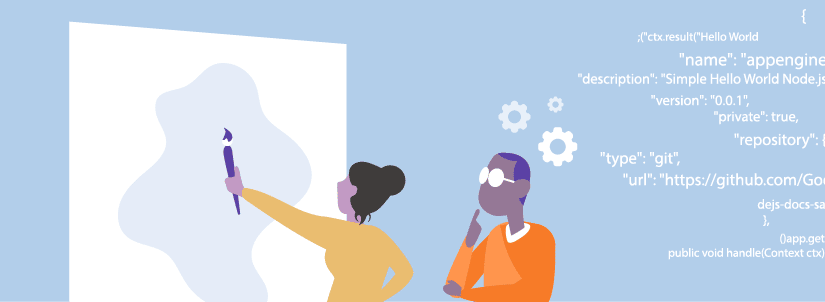
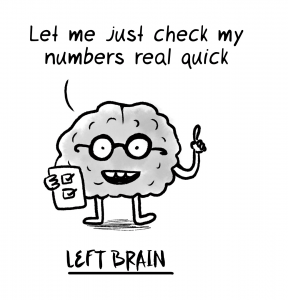
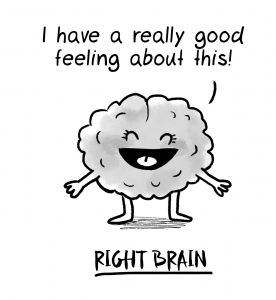
Ever since the beginning of time, there have been two kinds of people: The left-brainers – methodical thinkers who use their logical and analytical skills to solve problems; and the right-brainers who tend to rely on feeling and intuition, are driven by inspiration and often think in a visual way.In today’s tech community, we often associate these two groups of people with designers and developers.

Of course, this statement is rather stereotypic. Designers often back their visual decisions on actual data and analytics, methodically analyze complex user flows, and sometimes (gasp!) even code. Developers think creatively, experimenting with different solutions to fit user needs and generally are pretty comfortable with design systems.

While we haven’t yet unified design and development, at the end of the day, both designers and developers are working toward the same goal: Building a product that best serves user needs, a product that looks good and functions properly.

The working relationship between designers and developers can sometimes be tricky, as each has a slightly different agenda and different perspectives through which they address the challenges that inevitably arise.

As the UX & design lead at Rookout, I’ve learned that the challenge is doubled when you’re designing a product whose users are developers.
These are a few lessons that I’ve learned through the process, as well as with some wise insights from fellow dev tool design leads from DataDog, Sentry & Alooma.

Know your user (but, like, really know him/her)

It’s quick, easy and very convenient to get answers when your user sits right across the table from you, and you hear him share everyday struggles and development work pains at the daily standup.
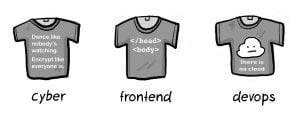
But it’s risky to rely solely on teammates when you’re defining your user. Like designers, developers come in different shapes and flavors. Front-end developers search for different solutions than back-end developers; data scientists have entirely different goals than devops engineers.

Beyond knowing your user, you should be aware of the specific state he or she is in when in need of your product.
Rookout’s production debugging solution is designed to help the developer at a crucial point – when a bug or a performance issue has occurred and he must quickly understand what happened and resolve the problem. Lack of visibility and the limited ability to collect live data makes the debugging process feel like looking for a needle in the haystack in the dark.

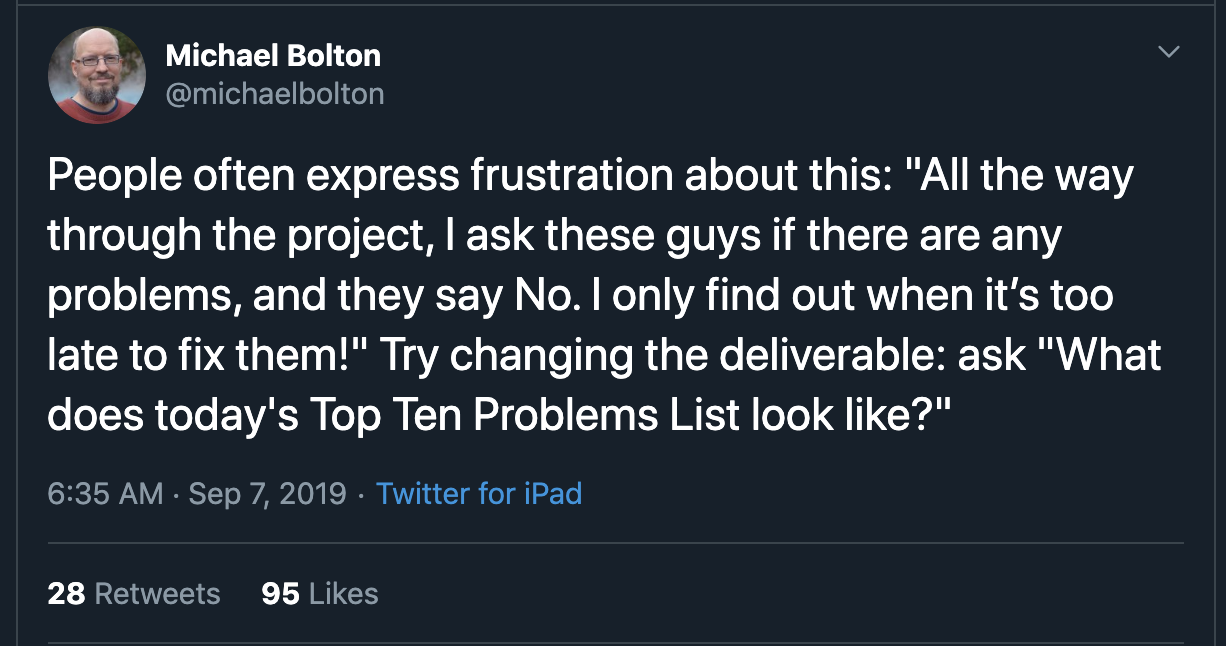
Our user is frustrated and anxious, and in desperate need of valuable insights and support – someone that will say “Yes, you’re in the right direction!” or “No, you’re barking up the wrong tree,” and help him get things in order, quickly, before his own users are affected. So our design needs to reassure the user, while enabling him to find the answers he needs quickly and easily.

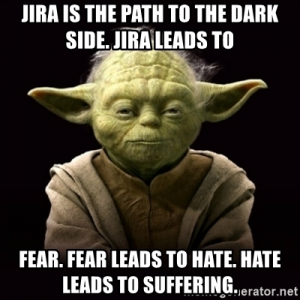
Software development is a religion

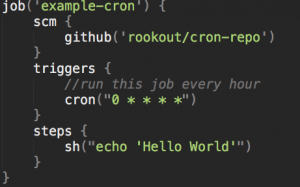
Remember that episode on Silicon Valley, where Richard freaks out when he learns that one of his employees commits a batch of code which is written using spaces and not tabs?

Sadly, this is not an exaggeration but rather a viable and blood-soaked war in the coding world.

Here’s how the Merriam-Webster Dictionary defines a “cult”:
1. A small religious group that is not part of a larger and more accepted religion and that has beliefs regarded by many people as extreme or dangerous.
2. A situation in which people admire and care about something or someone very much or too much.
3. A small group of very devoted supporters or fans.
Sound familiar?

Developers swear by their favorite framework, are devoted to their traditional tools, and have Sisyphean arguments about things which seem meaningless.

Developers can be resistant when it comes to changing familiar conventions – fonts, color themes, hierarchy. So you need to have pretty good reasons to back up unconventional design decisions. Yet designing within these conventions can limit your creative freedom. You need to find the right balance between good design decisions and fresh UI, and not unnecessarily shaking your users’ world.

We decided to go with a dark UI for Rookout’s app after researching which IDE interface is developers’ favorite. White-on-black themes are popular among developers who want to minimize eye strain while spending hours in front of computer screens. They have good readability and high contrast. In fact, over 70% of software engineers code on dark theme IDE’s. So all in all, it seemed reasonable to keep Rookout’s theme consistent with the rest of our users’ environment.

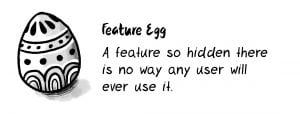
Some Rookout design components, however, had to be invented from scratch. For example, the rules concept in Rookout is something that can’t be found in IDEs or similar tools. So we had a great opportunity to combine work within established conventions with designing something completely new and fresh, from scratch. All in all, it was a great challenge and very satisfying.

Developers are people, too

Contrary to popular opinion, and despite developers’ well-deserved reputations as sophisticated and tech-savvy (obviously) users, they are still people. And like most people, they expect products to serve their needs as quickly and effortlessly as possible. They don’t want super-complex tools that take hours to learn.

This important input came through loud and clear in almost every user interview we conducted: Make the user interface as intuitive and simple as can be. Don’t assume that because developers are smart, they will figure it out. If they don’t get it, they’re probably not gonna keep trying.

Less is more

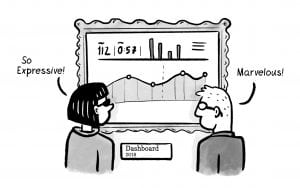
Dribble and Behance are full of gorgeous design concepts, perfectly aligned tables and gradient dashboards which look amazing as screenshots but fail to function in the real world.

A beautiful application that is not functional will not satisfy users’ basic needs. Users tend to remember the bad more than the good. Can you imagine your user saying, “This app takes ages to load and I’m not really sure what all these buttons do, but, boy! This splash screen animation is super cute!”?

Only when a product is functional, reliable, and usable can users appreciate the delightful aspects of the experience.
Sentry‘s co-founder and head designer, Chris Jennings, was, in fact, a product designer at GitHub before making the transition and creating an error tracking tool for developers. Here’s what he had to say about why, especially for developers, less is more:

“If there’s one-way developers are different from the average consumer, it’s that they don’t have a lot of patience for fluff or interruptions. Our customers use Sentry to solve some pretty gnarly problems and part of our job is to make sure we don’t get in the way of that with things that aren’t 100% necessary.”

Don’t be afraid to ask for help

Gitit Bruetbart, Senior Product Designer at Alooma, says she regularly sources insight about usability and product design from her friends, who are generally happy to explain technical issues and contribute their thoughts.

“As a designer, entering the world of developers is not always easy,” she explained. “While designers are up close and personal with product technology, they are rarely as familiar with the technical issues and terminology as developers are. Fortunately, however, in startups, designers and developers work closely together or at least socialize over lunch.

“When I need to do usability testing, I can generally find testers that fit the exact persona of our target audience among these friends, or among their friends who are developers in other startups, They’re happy to try out interesting new tools (and to get a small token of my appreciation), and I get the benefit of their insights and feedback.”

Ultimately, it’s all about the people

When it comes to a new product, good design is a make-or-break factor of success. But, as Stephen Boak, director of product design at DataDog and host of the amazing podcast ‘Don’t Make Me Code’ points out, “The communities that develop around our tools can also make or break the experience, especially in the world of open-source. The community you build, the evangelists you create, and the quality of your ecosystem will make the experience better for everyone. Think of Twitter and what they’ve done with their API to alienate developers.”

In the spirit of building a positive and supportive Rookout community, I invite you to share your thoughts on designing a dev product. If you’re a designer, how do you make sure the design is aligned with dev needs, preferences and expectations? And if you’re a developer, let me know what design features and elements make your favorite tools a pleasure to use.

* Originally published on TheNextWeb

Rookout Sandbox

No registration needed

Play Now

Table of Contents
Get the latest news

Hating on Jira? Here’s Why You’re Never Too Small To Reconsider

Liran Haimovitch | Co-Founder & CTO

9 minutes

Table of Contents

As a young SaaS startup, managing your day to day development tasks is as essential as it gets. And so, although we’ve only been around for about a year, we have already fully migrated to Trello, then to Flow, and then to GitHub Issues in our search for the perfect issue-tracking software. Recently, we’ve made a choice that may come as a surprise to some. We have adopted a tool everyone loves to hate: the infamous Jira.

When we were just starting out, 2-3 developers in the metaphorical garage or more realistically, in a local coffee place that wouldn’t kick us out, we thought Jira would be an overkill. But as the team grew and our product became complex, we found ourselves needing some of the more advanced Jira capabilities much earlier than we expected. Thinking back, knowing what we know now, deploying Jira from day one would have saved us a lot of trouble.

But we asked around, and we knew from experience what “everybody knows”: Jira is a nightmare to install, a bummer to configure, and painful to use. In fact, earlier in my career as a dev team leader, I personally refused to adopt Jira. So what changed? Is it the fact that I’m a CTO and co-founder of a startup? Is it because being a product owner gave me a different perspective? Or maybe it’s just that I’m getting older? Maybe. But there is also a rationale behind it, as I hope to show you.

Not the Jira you think you know

Jira 2019 is not the Jira you remember from the past. It is now available as SaaS and is quite easy to provision and install. It meets all the security standards, and thus far we have had no availability or performance issues whatsoever. We also like the existing features and have not found too many missing features (except in the reporting areas; more on that later).

A 10-year challenge that matters

Jira has made a huge leap forward in its end-user UX and is actually quite easy to use. It can be tweaked even further from the admin panel. This makes it almost as fun as the more lightweight task management tools. It has pretty good Kanban support, better than any other tool we have tested.

While we went for the rich and advanced functionality of advanced Jira projects, smaller teams with fewer demands can use the next-gen projects, which should make things even easier. But that rich and advanced functionality is what helps us get a sense of control in the chaos that is managing an R&D team in a startup. Let’s see what it means for us.

1. Structure

When you start a new project, a new product, or a new company, you don’t usually know what structure you’re going to need. Plus, as a small startup trying to remain lean and agile, an unstructured tool gives you the flexibility you need to focus on delivering your tasks rather than managing the management. That’s why many product owners (myself included) opt for the unstructured option when they first get going.

But as you grow, both the team and the project become harder and harder to manage. At Rookout, we first felt that pain early on, back when we only had 4-5 developers. We observed this pain turning into a major bottleneck when we had ~10 developers and ~4 distinct components and areas of specialization. We had ~50-100 new tickets opening and closing every week, with differing levels of granularity and urgency. And this happened much, much sooner than we expected.

As a product owner, I found myself struggling to figure out who was doing what, what was done last week, and what could be done next week. At the same time, my developers found it hard to keep track of their tasks in an ever-growing, hard-to-groom backlog. The transition to a more structured system, with fully customizable, and sometimes mandatory, fields and automated workflows, helped me and my team improve the quality of our tickets. This, in turn, improved the quality of our code. It helps us stay focused and happy, since we know that we’re doing what needs to be done, and we can show progress over time.

We were able to make this transition in small steps. We didn’t need to bring in a paid consultant and Jira integrator. Nor did we need weeks of training to ramp up the team. Instead, we were going through a gradual, smooth transformation into our personal flavor of CI and Kanban, adding and removing fields and automated workflow options as we need.

2. Automation

Being a dev-focused team, Git is our single source of truth. The only way for me to tell if a task is really done is by making sure the code was written, tested, merged, and deployed into our production environment. And the fact that we were able to integrate Jira into our Github and Jenkins flow meant this now happens automatically. As the code-change transitions down the pipeline, the Jira ticket automatically moves to the relevant kanban column.

A happy side-effect of this is that my developers can keep on spending most of their time in their “happy place” – their IDE. They may look at Jira when starting a new task, to make sure they are picking the right ticket and that they have all the info they need in order to implement it. But once they start coding, they can stay in their IDE. They don’t need to get back to the management tool in order to move and monitor tickets. This makes the fact they’re being managed less painful and gives me a clear, real-time picture of the state of every ticket.

This also aligns well with our DevOps agenda. We invest so much time and effort into building our dev pipeline, monitoring our staging and production environments, automating everything that can be automated, and measuring everything that can be measured. WIP, Lead time and resolution time are a key part of that. The fact that we can automate and measure everything is a huge advantage.

3. Reporting

Speaking of measuring everything that can be measured. On the one hand, I try to avoid graphs for the sake of graphs. It feels like something a big enterprise makes you do to keep the managers happy. On the other hand, I find it helps me keep my team focused and efficient. We use simple reporting to track some questions that are interesting for the team. How quickly do we release features? How long does a ticket get stuck in the pipeline? Who in the team has a bunch of tickets assigned to them and needs help or at least some prioritization?

I used to try and answer these questions by manually analyzing the tickets. Like other manual workflows, it was time-consuming and error-prone. Automated reporting saves me time, so I can be a more effective product owner. I can spend more time talking to my devs face-to-face because I’m not busy collecting data manually. And I now have more time to keep my tickets fresh and my backlog groomed. This way, my team gets high-quality assignments to work on, which also makes them happier.

Besides, we are engineers who like graphs and data. We like performance and stability graphs from our APM, and they help us make sure our production environment is stable. We like an interesting red-green graph showing the health of our CI/CD pipeline. It helps us make sure our tests are as stable as possible. So why not make some more helpful (and pretty) graphs showing our day-to-day tasks?

On top of our APM and CI graphs, we now have graphs that show us that the average time for delivering tickets gets shorter every week; that we deliver more tickets every sprint; that we have fewer tickets getting stuck in staging for more than a day or two; and that each of us has no more than one or two tickets in progress at a given day and no more than three-four tickets at our New column.

APM and CI graphs
Look at my data! It’s fresh and helpful and shows me where the problems are, but also how we improved from last week.

The reports we now have show my team how I measure them, what we look to improve together, and how we aim to improve it. The added visibility allows me to build an agile mindset focused on delivering value, not on moving tickets around and getting lost in lists. To be fair, we couldn’t find all the reports we wanted in Jira or in the rich add-on marketplace it brings. We had to export data to a small BI system and use Chartio to present it. It’s not perfect, but Jira does collect all the data we need, and it’s easy to export it using an API.

4. Ecosystem

The Jira ecosystem is rich and mature. Everything we’ve thought about doing, someone has already tried to do. People have already posted about it, and the post has long been answered. It’s also very likely that the answer has a step-by-step guide, and sometimes an add-on has been developed. As we worked to build the Structure, Automation, and Reporting described above, this was a huge help.

While not all of the guides and add-ons were exactly what we needed, the fact that a rich documentation and forum ecosystem exists really helped us ramp up much quicker. We still tweak Jira every now and then, and the tweaks are less painful than they could have been.  Our initial assumption that we would be spending too much time installing and configuring Jira was based on our own past experience and that of friends we consulted with. This assumption was proven to be wrong and Jira’s excellent ecosystem turned out to be a great aid and an advantage for using the tool.

Jira is a lesser evil

Even though we recommend it, we’re very much aware of Jira’s downsides. The admin UX is still terrible and configuration is not a walk in the park. The dev experience is much better than it was 5 years ago, but it’s still not perfect. And yes, the reporting features are lacking. For our needs, we found that building our own reports was more cost-effective.

That being said, it does deliver the benefits some of the lightweight tools don’t bring to the table yet. And you may find you need it sooner than you think. At the risk of sounding like a wannabe Yoda: Structure enables Automation. Automation enables Reporting. Reporting leads to the dark side. Except, in this case, the dark side is an agile mindset with a focus on velocity and efficiency. It’s a fresh backlog and a happy team writing beautiful code without struggling with tickets. Oh, and pretty graphs.

Your developers may still object. But then, no one likes a system managing them, no matter what tool you choose. Jira is a lesser evil. The culture and agility you can build with it will make you and your team happier and more efficient in the long run. So if you’re taking your first steps with a new startup or a new side-project, give Jira another thought.

Rookout Sandbox

No registration needed

Play Now

Table of Contents
Get the latest news

How We Got SOC 2 Certified In Less Than 6 Months – And How You Can Too

Liran Haimovitch | Co-Founder & CTO

7 minutes

Table of Contents

About a year ago, we raised our seed round of investment. By that time, we already had a promising sales funnel and our potential customers saw great value in the product. And yet, as we continued filling our pipeline with potential clients, it didn’t take long for us to realize security was going to be a major obstacle in our lead-to-deal cycle. Regardless of their size, companies tended to meet our solution with a rise of an ‘is that secure enough?’ brow. We figured becoming SOC 2 certified would be the best way to overcome this challenge.

Getting SOC 2 Type 2 certification usually takes around nine to 12 months. We managed to get certified in less than six months. Below, I’d like to share the 3 steps we’ve taken that helped make our journey quicker. I’m the company’s CTO and the acting CISO, and I have years of experience in cybersecurity. However, when we started this process I had no experience with security auditing. Since we got certified, many of our startup friends have asked us about the process and so I decided to share what worked for us.

Why SOC 2

We had a lot of questions when we first began considering SOC 2. We wanted to understand how difficult the process would be, and how much work it would take compared to the benefits we could get out of it.

We met with several startups to see how their SOC certification process had gone. We learned that SOC 2 can bring great value. It prepares you professionally for the challenges that lie ahead; your security posture meets the industry standards; you have the paperwork to prove it; and it’s all verified by a trusted third party.

SOC (System and Organization Controls) is an American standard that belongs to AICPA (the American CPA association). US public companies and companies that target the US market rely on SOC to help ensure that the services they use meet security and availability requirements.

While SOC 1 focuses on financial IT systems and is probably of lesser concern to you, SOC 2 is more relevant and is split into two types:

  • Type 1: policies are defined and documented, and the audit is conducted at a single point in time.
  • Type 2: policies are defined and documented and are then verified by a third party over a period of time.

SOC 2 Type 2 is the gold standard for indicating your company prioritizes security, privacy, confidentiality, availability, and processing integrity.

If you’re a new company, it’s good practice to meet several other companies in your ecosystem who have received the certification and learn from their experience. This is why I hope this post, outlining our journey, will help you understand whether or not SOC 2 is the right compliance choice for you, and how you should approach it.

Ground zero: It’s all about control

After deciding we want to get SOC 2 certified, we met with Ernst & Young, our CPA, to prepare for the journey ahead. As we sat down with them, we learned more about SOC 2 and how to confront the challenge of proving our company’s management has full control over all aspects of service delivery.

As an entrepreneur, one of the major challenges of scaling a company is keeping the ship sailing in the right direction while maintaining visibility into its inner workings as it grows. SOC 2 is one of the first tests I had on how well I managed to do just that. To pass this test, you must define a set of policies and procedures to create various controls, technologically and organizationally implement them, and then prove to your auditors you are indeed meeting them.

For every compliance requirement you have, the main question you should consider is: “how do I prove this action was properly sanctioned and recorded for future reference?” Instead of changing your existing process, examine the possibility of integrating the approval and auditing into the process. If you are a venture-backed startup like us, you will most likely have the report done by one the of Big 4 auditing firms.

Step 1: Achieve compliance with CI/CD

The majority of SOC 2 requirements in the security and confidentiality pillars fall heavily on the change-management process. Therefore, the first step of our compliance journey led us back to the heart and soul of the development process at Rookout: our CI/CD pipeline.

The attributes we have come to love about CI/CD are the very same qualities auditors look for to prove the company has control and visibility into the code that makes it to its production environment. These attributes are:

  • Auditability – Know exactly what code went into which environment and when.
  • Testing – Test to verify the application works as expected, every step of the way. Unit tests, integration tests, staging tests, etc.
  • Pull request reviews – Make sure the code that goes into the system was reviewed, really belongs there and is of high quality.

Step 2: Keep things in check with monitoring

Our next step was to ensure visibility into all of our environments and processes: production and pre-production; CI/CD; onboarding and offboarding of employees; CRM and customer communications.

Monitoring these environments and processes is essential for ensuring that the company is operating as intended, and for fixing things when something goes wrong. The first crucial point we had to keep in mind was that we should always be aware when things go wrong. The second point was we must measure any SLAs we promise our customers.

This required setting up a set of tools such as availability monitoring, CRM reports, and HR reports, as well as a set of processes like regular management meetings to review and discuss those reports. To get SOC 2 certified, you too will have to ensure the management has a clear and verified view of your company’s inner workings.

Step 3: Ensure smooth sailing with automation

The final step before going into the SOC 2 probation period was meeting the principle of least privilege (PoLP), so as to limit what can happen outside of our control. At this point, we mapped all processes requiring administrator privileges within Rookout. We then had to make a choice: either automate a process to allow it to be executed without admin privileges in a sanctioned and auditable way or restrict it to a small set of admins.

At the end of this process, we had a very small group of system admins rarely exercising their admin privileges, and most of our day-to-day operations were carried out by anyone in the company in a fully sanctioned and auditable way. If you were to follow our journey up to this step, you too would probably find admin privileges aren’t necessary for the vast majority of your employees.

SOC 2: a slightly ironic takeaway

Since receiving our SOC 2, we’ve noticed that successfully undergoing security reviews with our customers (including Fortune 500 companies) is now considerably easier. We’ve also noticed that many startups we are in contact with are shocked by how early in our journey, and how easily, we acquired our SOC 2 certification.

It is somewhat ironic that instead of being a hurdle, being a young, 20-employee company actually helped us expedite the process! People often love to procrastinate on tasks such as this one, which they perceive as a nuisance. We’re no different. However, completing the certification process when you’re smaller and faster makes it a lot easier.

Make no mistake: becoming SOC 2 certified is a time-consuming process, and it’s probably the opposite of anyone’s definition of “fun”. However, it actually helped us craft things ‘as they should be’ at a very early stage, and I’m confident we’ll be reaping the fruits of this effort in the short, medium and long-term.

This article was originally published by SC Magazine.

Rookout Sandbox

No registration needed

Play Now

Table of Contents
Get the latest news

Boost Your Developer Productivity With Effective Debugging Techniques

Liran Haimovitch | Co-Founder & CTO

4 minutes

Table of Contents

As a company that offers developer productivity tools, we know the important of efficient debugging techniques. Michael Bolton once shared this great tip on Twitter about how minor changes in the way we ask questions can impact the answers we receive:


This got me thinking about how frequently engineers and their managers underestimate the time and effort spent on debugging (or chatting up their rubber ducks!). 

Status Meetings And Developer Productivity

Every engineering organization has status meetings, but how much of your time is being spent in those meetings? They might be daily stand-up meetings with tech leads and product managers going through Jira. They might be held in more official settings, such as meeting rooms with PowerPoint presentations and managers. 

In each and every one of those meetings, the most common task is explaining why we are behind schedule. For full transparency, I myself have personally missed more delivery deadlines than I could count. 

So what do we say? Well, pick your poison: 

  • “The feature was developed. It’s just not working as expected.”
  • “Getting the environment up and running was trickier than expected.”
  • “I had to get CI green.”
  • “I had to fix a couple of bugs, so work on the feature was delayed.”

All of those answers/excuses share a common trait – writing code is much easier than getting it to do EXACTLY what you want. Debugging takes effort, time, and mental energy. And that effort of taking code and making it perfect – well, that’s debugging.

By improving our debugging skills and techniques, we can improve developer productivity and reduce the time spent fixing bugs. 

Unstable CI and Developer Productivity

How stable is your CI? How stable are your unit tests? We can hardly blame the infrastructure for slow and finicky tests with modern cloud computing and orchestration. 

However, if you have to run your tests multiple times just to get them to pass, then whether you admit it or not, bugs are lurking within your tests and the code they’re testing. This is the point when we ask ourselves: “Why doesn’t anybody just go ahead and fix those bugs?”

Well, getting tests, especially complex E2E tests, to be 100% predictable is quite a challenge. Understanding (i.e., debugging) exactly what’s happening in remote CI environments is no fun. Some teams spend weeks getting their tests stable and their CI reliable. Many developers find it easier to grind their teeth and run the CI yet again.

Waiting for Deployments and Developer Productivity

How often do your developers wait for deployments? Even in elite DevOps teams that deploy multiple times a day, the wait time can be anywhere from hours to days. In some companies, they often wait for weeks or more. This waiting time can hurt developer productivity, as they may lack the data they need to understand and solve bugs. 

It’s possible that your developer is missing a piece of data to understand a bug, so he’s waiting on that new log line he deployed. Maybe he’s even braver and decided just to go ahead and deploy a potential fix to try to see if this will solve the issue, as data collection is just too hard.

If your developers knew what was happening in remote environments, they wouldn’t have to continuously wait on deployments just to learn more. Improving communication and visibility around deployments can help reduce waiting times and increase developer productivity.

Unplanned Work and Developer Productivity

Once your application moves from an innovation project to a service that provides business value to your customers, that’s when the real work begins. You get the fun task of supporting them as they grope blindly through your product, failing to grasp its very meaning. And they love nothing more than reporting those pesky little bugs and sending their account executives to hunt you down until they are fixed. 


Even in a high-performance dev team, unplanned work can account for up to 20-30% of total work, reducing developer productivity. This is particularly true after a big new release or product launch.

Debugging Is A Core Capability For Developer Productivity

In all of the cases mentioned above, effective debugging is critical for developer productivity. Your developers are hurting as they spend time, effort and mental energy fighting through the bugs in their codebase. In others, debugging feels so impossible, they barely even try.


Debugging can feel impossible, but by providing your team with the skills and tools to tackle debugging challenges head-on, you can boost developer productivity and reduce the time spent fixing bugs.

Rookout Sandbox

No registration needed

Play Now

Table of Contents
Get the latest news

What If It Was A Software Bug/Virus? Cyber vs. COVID-19: A Thought Experiment

Or Weis | Co-Founder

9 minutes

Table of Contents

The metaphor of software viruses to biological ones is deeply ingrained, easily seen in the fact that biological viruses are at least the namesake, if not the inspiration for computer viruses.
Can we take this analogy and reapply it in reverse? Is it possible to learn more about how we can combat biological viruses, such as the raging COVID-19 epidemic, by leveraging concepts, mindsets, and ideas that evolved in the software engineering and cybersecurity worlds? This is what we’re going to try and explore in this thought experiment, with the purpose of creating discussions that may fuel better understanding and perhaps even new solutions.

Completing the analogy

The world of software is a complex one and the world of biology (coming in with an unfair advantage of about 4 billion years head start 😀 ) makes the complexity of software look like a joke. With such complex realms it’s difficult to satisfy the thought process by simply saying that a virus is analogous to a virus. Rather, we have to go much deeper. While there are probably many ways to draw this analogy, by picking some semantics we’d be better off than deciding on none. In addition, we will focus the analogy to best suit the characteristics of COVID-19 (as compared to other pathogens, viruses, and bacteria).

Analogy points

  • Vulnerability – A defect in a mechanism that allows the mechanism to operate in a way it wasn’t intended to. It is the same for both sides of the analogy. A cyber example would be a vulnerability in the OS code that reads a USB stick’s filesystem, which causes a specifically crafted USB drive to run malicious code on the system without the user’s intention. A biological example would be a virus code that is injected into a cell, which causes the cell to execute the code as if it was its own.
  • Executable
  • Software: a binary or script file
  • Biology: a strand of DNA or RNA
  • Code-execution
  • Software: A binary/script file being loaded/run by a process
  • Biology: mRNA being translated into peptide chains by a Ribosome
  • Infected Node
  • Software: a network node such as a laptop or server
  • Biology: a cell

Connected entity:

  • Software: Sub Network / VLAN
  • Biology: Living tissue or organism

Attack analogy diagram / With graphics from Nytimes.com – “How coronavirus hijacks your cells”

It’s important to note that while we have a rather good understanding of software and cybersecurity (though even there much remains to be explored), the world of biology still remains more of a mystery for us in comparison. This is probably a direct result of our having designed and created the software world, but we didn’t design or create the biological one (it actually created us). This gap of understanding, and applicable technology – makes some – if not most – of the solutions we have in the software realm harder to implement in the biological one.

Now that we have both the analogy and expectations set in place, let’s take a look at analogs solutions that already exist and then move to cybersec solutions we can use to derive new biological/medicinal capabilities by analogy.

Solutions that exist (at least partially) in both worlds

  • Antivirus pattern matching: Antibodies in the immune system
    Just like antivirus software often relies on malicious code/file signatures to identify and thwart malware, so too does our immune system produce signatures on viruses via memory cells (e.g. T-cells and B-Cells). A big difference remains in how signature updates are acquired. Vaccines are an indirect way to cause the immune system to acquire a new antigen signature. Imagine if your immune system could, like your AV software, download an update from the web or even from a local service.
  • Code sanitization: CRISPR / CAS9
    Code and data sanitization are very common in software, as a leading way to protect against code injection. While we haven’t been able to significantly harness CRISPR yet, the mechanism has been utilized by bacteria for eons for defence against viral DNA. This enables said bacteria to remember virus DNA and cut it out of sequences to avoid it’s activation. We (humans) are already using CRISPR today in vitro (and in vivo use is just around the corner).
  • Code Packers: Cell Nucleus, Chromosomes, DNA
    Code packers protect an executable from intervention and manipulation. The cell nucleus adds an additional layer of protection within the cell. While chromosomes act as archives, DNA’s double helix provides redundancy on the data and enables error correction (like checksums). In the software space these often include compression and encryption– I sincerely hope that viruses don’t evolve to adapt those to trick the immune system.
  • Endpoint Firewall: breathing masks

An endpoint firewall (also known as a personal firewall), protects a network node from attacks by limiting the type or content of traffic – minimizing the attack surface. A simple parallel found in the healthcare world is face masks. We can consider more complex filtering mechanisms (such as smart-masks or smart suits) which, like a network firewall, would be more configurable to adjust to specific threats and needs. If the epidemic continues to rage, this would probably be a leading category for IoT and wearables to grow into.

Solutions we can import from cyber to the biological world

  • Honeypot – A cybersec method using deception and fake assets to both detect attackers and interfere with their process. Viruses like COVID-19 target specific cells (in COVID-19’s case it targets cells that have the ACE2 enzyme on their cell membranes). Possibly by producing fake cells (be they cell simulations, or actual engineered cells [e.g. bacteria]) with the enzyme we can both create alarms for the existence of the virus, as well as waste some of the viruses’ resources on infecting these fake cells.
    This technique actually seems to be right at the edge of our current scientific capabilities. By imagining combining bacteria, plant, or even animal cells with bioluminescence triggered by the viruses code (RNA), we can have elements around us or even the air itself light up as a warning sign for the presence of the pathogen, which should make detection, testing, and even containment far easier.
  • Execution protection
    The core vulnerability that viruses exploit is unprotected and unprivileged code execution, as basically any strand of RNA or DNA which finds its way into the inside of a cell gets executed. This concept is so alien to modern software architecture, basically making it sound absurd.
    Let’s look at several of the solutions found in cybersec and how we can conceptually apply them to biology:
  • NX bit – Modern CPUs support marking specific areas in memory as executable or not and hence restrict execution to only approved code. What if we could make sure only human DNA is marked for execution, by say adjusting the cell’s mechanisms to check for approved signatures or lack thereof, and either not execute or proactively reject mismatches? This technique requires updating the underlying cell architecture (as it did for CPUs) and is probably far beyond our current technological grasp, but it does enable us to imagine a future where we evolve a subspecies of engineered humans who are essentially immune to all existing (and probably most future) viruses.
  • Execution privilege levels – Different executables/processes have different execution rights and modes (e.g. kernel mode, user mode). What if we could limit specific cells to only perform specific operations- i.e. execute only specific DNA/RNA? While basically all cells with a nucleus in the human body (aside from gametes) contain all the DNA, cells don’t actually need or use all of it. Thus conceptually we could limit specific cells to be allowed to execute only the code they actually need. This method -unlike the full architecture change described above- can be applied in a more limited scope.  For example, targeting only lung cells with the limitation to protect them from Corona viruses.
  • ASLR – In essence, ASLR is a protection mechanism that works by preventing malicious code from finding the resources it needs to perform its operation (by randomizing where said resources are in the process memory). What if we could selectively deprive, or reallocate, access within specific cells to resources that are critical for the virus’ life cycle? This could potentially stop the virus or at least slow its spread down. Like with ASLR, this technique depends on striking a fine balance between affecting the virus and affecting the cell.
  • Containers / Process isolation – In cybersec containers create a separate blank unified space for a running application or process, thus isolating it from affecting and being affected by other applications. Biological cells have the cell membrane that acts as a basic isolation barrier. Being basic, it might be better compared to a process memory space than to a security container. Imagine adding another layer of protection over cells, over a group of cells, or perhaps even full organs. This layer can be a chemical one (such as being explored with Zinc), or an organic one, with bacteria, for example, being engineered to act as a buffer (for viruses and not oxygen) for at-risk cells (such as lung cells in the case of Coronavirus).
  • VPNs and trusted networking – Applying the cybersec “weakest-link” principle, information security officers often start by limiting access to their networks to only trusted and verified parties. This was quickly expanded to parties that meet security standards and pass security checks. What if we could apply similar standards for people to access specific areas (streets, schools, offices)? For instance, access would be allowed only to people that have been vaccinated or have the right antibodies. Among the listed options this one seems to currently be the most attainable, as it requires the least amount of technological innovation. Yet, the implications to both culture and democracy would be earth-shattering. We can already see initial aspects of such policies being implemented in China in face of the COVID-19 pandemic.

Software security: a road map for bio-engineering

While many of the methods here appear as science fiction when translated from the software to the biological world, some of them are within reach and can conceptually turn the tides of battle in humanity’s favor in this long, ever-escalating, war. Personally, I believe that smart medical wearables and IoT, medical honeypot alarm systems, and area-access regulation based on trusted data are inevitable if the situation (with COVID-19, or other pathogens) continues to escalate.

I believe this thought experiment shows that while translation might not be easy, there is a lot of potential to be had in the discussion and by generally trying to apply cross-pollination between the fields. Software engineering and cybersecurity are fields leading a significant percentage of society’s technological innovation. As leaders, we engineers have the responsibility of looking at the bigger picture, of thinking outside the box, and seeing how we can harness our efforts for the greater good and not just within our own field.

Rookout Sandbox

No registration needed

Play Now

Table of Contents
Get the latest news

We’re Partnering With AppDynamics

Or Weis | Co-Founder

3 minutes

Table of Contents

We are excited to announce our new partnership with AppDynamics at their global event Transform 2020. Deep Code Insights (DCI) powered by Rookout will be generally available within the AppDynamics platform starting today.

The partnership was a no-brainer: AppDynamics’ APM solution helps developers become aware of problems quickly; Rookout helps developers debug those problems easily. It’s a match made in devops heaven! The ability to jump directly from an AppDynamics issue to the data and code in-action that caused the error without restarting, redeploying, or adding more code — that’s the magic of DCI.

Beyond the commercial relationship, the technical integration between the two platforms, enables what we like to call ‘full-cycle investigation’. As the APM solution surfaces up alerts (such as errors, or performance degradation), these more often than not translate in the minds of the engineers as questions – mainly ‘why is this happening?’. Instead of being forced to replicate the situation, or redeploy with more logging, AppDynamic’s users can simply click a button to immediately collect more variables and data to the screen in front of them, or dive to a deeper session within the full Rookout/DCI IDE like experience.
This new workflow, transforms multi-hour/week sessions full of context-switches into mere seconds. Dramatically reducing MTTR, and completely revolutionizing the experience for software engineers.

We all know that debugging modern, distributed applications is complex, time consuming, and costly. It’s been our rallying call since we founded Rookout back in 2017 that there needs to be a better way. We’ve worked closely with developers to identify their pain points when it comes to debugging live code and separating data from that code. We are giving teams up to 80% of their time back to focus on shipping new features and improving the customer experience. DCI brings this next-gen workflow to more of the enterprise.

In the words of Kevin Wagner, VP @ AppDynamics:

“AppDynamics and Rookout both address the complexity of debugging modern applications. We want to make it easier for businesses to understand their own software, which is why together, we are narrowing the gaps between indicating a code-related problem impacting performance, pinpointing the direct issue within the line of code, and deploying a solution quickly for a seamless customer experience.”

Everyone needs data, so Rookout’s debugging tools are for everyone. At its core Rookout is all about liberating data and empowering people; and from day one we set the goal to make Rookout not only available across the technological spectrum (e.g. Monolith to Serverless, Physical on-prem to hybrid cloud) but also across the organizational spectrum. Supporting organizations from the smallest startups (With our self-serve and community-tier) up to the largest enterprises, with significant investment in security capabilities (e.g.  PII redaction, data-fencing) and compliance (e.g. SOC2, ISO 27001, HIPAA) from day one. Now combining forces with Cisco/AppDynamics’ years of enterprise experience, access, and standards – Rookout / DCI is geared to empower developers, and users across at the largest enterprises.

This partnership is a start of a great journey, as automation and AI-ops grow to encompass more of the application performance management, Rookout/DCI brings the needed agility for both people and monitoring systems to run at the same pace of live software. This automatic ability of introspection, and self-reflection is likely to drive many more amazing capabilities in the ever expanding world of software.

To learn more and get started click here.

Rookout Sandbox

No registration needed

Play Now

Table of Contents
Get the latest news

Is IT Suffocating Your Organization? Here’s How to Get Your Contextual Data Pipelines Right

Or Weis | Co-Founder

7 minutes

Table of Contents

In a modern organization, the dependency on constant data flow doesn’t skip a single role — already encompassing every function in R&D, Sales, Marketing, BI, and Product. Essentially every position is going through a fusion process with data-science.

“Data is the new oil.” “Everyone needs data.” You’ve probably run into these and similar expressions more than once. The reason you hear them so often is that they are true. In fact, those sayings are becoming truer by the minute.

Software is naturally data-driven but AI is naturally data-hungry. As both fields are currently experiencing exponential growth, more and more jobs connect with and depend on software, and as a result, rely on data access. We can already see the effects rippling across the job market. As Ollie Sexton of Robert Walters PLC, a global recruitment agency points out:

“As businesses become ever more reliant on AI, there is an increasing amount of pressure on the processes of data capture and integration… Our job force cannot afford to not get to grips with data and digitalization.”

Data is not the new oil, It’s the new oxygen

As the demand for data explodes, the stress on our data pipelines increases. Not only do we need to generate more data faster but also to generate quality, contextual data – i.e. the right data points, with the right context, at the right time.

Generally speaking, the problem is being unable to see the forest for the trees. If we try to record all data all the time, we will end up drowning in a data deluge. Thus, the challenge becomes not about data, but about knowledge and understanding. In other words, it’s all about contextual data. To drive the point home, let’s look at three example test cases and consider how different fields are impacted by the growth of data and software.

Cyber Security

Software is everywhere and so, every corner may serve as a potential attack surface. Nonetheless, trying to record all communications, interactions, and actions would quickly leave us distracted or blind to real attacks when they happen. Organizations can respond in a timely fashion and maintain their security posture only in three specific manners: by mapping the attack surface with the right context, e.g. weakest links and key access points; setting the right alerts and traps, and; by zooming in to generate more comprehensive data on attacks as they happen.

Debugging

Software is continually becoming more complex and interconnected. Replicating it to simulate debugging/development scenarios has become costly and ineffective. Trying to monitor all software actions all the time in hopes of catching the root cause of a bug or an issue comes with even greater compute and storage costs, not to mention the significant maintenance costs. Worst of all, the data deluge will blind developers, as they spend more and more time sifting through growing piles of logging data, looking for needles in haystacks. So how can developers obtain the key data points they need to identify the root cause of issues, fix, and improve the software? Only by being laser-focused on contextual, real behaviors or incidents and diving deep into the software as these incidents happen in real-time.

User analytics

More software means more user interactions. More interactions mean more behavior patterns to identify, and as users and software evolve — so do the patterns. Trying to constantly record all the interactions will result in too much time wasted on processing irrelevant patterns which would become obsolete by the moment they are identified. How can product designers and BI scientists stay ahead (or even alongside) of the curve? Only by focusing on the important contextual interactions, and by identifying them and their core patterns quickly as they appear and change.

Ultimately, for modern organizations, there is no avoiding a significant infrastructure effort to pipeline contextual data wherever and whenever it is needed. Without that contextual data, your organization’s departments will wither, fading into gross inefficiency and irrelevance — becoming legacy and obsolete. As Tsvi Gal, CTO of infrastructure at Morgan Stanley put it:

“We [may be] in banking, but we live and die on information…. Data analytics is the oxygen of Wall Street.”

Context? Go straight to the source

Context is driven by perspective. For instance, the BI team and the R&D team will require different contexts from the same data sources. One of the biggest challenges with getting contextual data is that data processing and aggregation are inherently subjective and may cause the needed context to be lost. For example, “these parts are important, and these are not”; “these data-points can be combined and saved as one, and these must remain unique.”

There’s only one way to guarantee the right context with the right data sets. Consumers of the data must be allowed to define their required context and apply it to the collection of the data right at the source. This is no easy feat, as the source is not only defined in space and content but also (and maybe more critically) in time.

Getting data at the source is hard

Every data pipeline contains two parts. A source — the way we extract or collect the data, and a destination — the way we bring the data where it needs to be processed, aggregated, or consumed. Automation has greatly improved the destination part, with impressive tools like Tableau, Splunk, ELK stack, or even the cloud-native EFK stack powered by FluentD. Yet sourcing data still remains a largely manual engineering process. Aside from predefined envelope analytics like mouse clicks, network traffic, and predefined user patterns, it still requires extensive design, engineering, and implementation cycles. As a result, the key to data sourcing still remains withheld from a large part of the organization.

Who currently has the key?

With the required engineering, traditionally R&D and IT hold the key to collecting and pipelining data to the various consumers within the organization. Although this arrangement appears natural at first glance, it quickly translates into a significant bottleneck problem.

As the demand for contextual data grows across the organization, pressure on R&D and IT increases and gradually becomes a significant percentage of their work. Context-switching between development work and addressing the arising data requests results in slow response rates to data needs, frustrated data consumers across all departments, and constant friction on all R&D efforts.

Who should hold the key?

If your answer to the question above includes R&D, IT, analysts, or any other role, you haven’t been paying attention. The fact that the keys to data pipelines currently lie in the hands of any single department within a company is the very cause of the aforementioned bottlenecks and slower organizational processes. The systems we are building are becoming more complex and distributed. Similarly, we need to meet the complexity and distribute access to contextual data at its source.

In other words, removing bottlenecks, allowing data consumers to access the exact contextual data they need just when they need it, and enabling the various people to flourish at their jobs, requires the democratization of data sourcing and the pipelining process.

As Marcel Deer has aptly put it:

“In this environment, the old ways don’t work anymore. We have to focus on more human characteristics. This is a people and process issue. We need to make it easier for people to find the right data, build on it, and collaborate. And for that to happen, we must help people trust the data.”

Democratizing data sourcing and pipelining

The data democratization process involves recognizing the importance of contextual data and letting go of the false promise of the “let’s collect it all” approach. It requires investing in data sourcing technologies/infrastructure and building it with distributed access in mind so that it empowers positions across the organization.

This is not a far-fetched idea. After all, organizations have already gone through similar transitions in the past. Just try and imagine BI analysts working to figure out the next strategy without real-time analytics, or IT attempting to keep track of application stability without Application Performance Monitoring.

At this point in time, the bottlenecks on contextual data sourcing are already becoming painful and detrimental to the performance of most organizations. With software and data only growing with increasing speed, the pain and friction are on the cusp of turning into full deadlocks. Now is the time to give every department a key to unlocking this deadlock. It is time to liberate data and empower people.

Rookout Sandbox

No registration needed

Play Now

Table of Contents
Get the latest news

A Letter To Dev Santa, From A Mostly Naughty, But Often Nice Developer

Oded Keret | VP of Product

2 minutes

Table of Contents

Dear Dev Santa,

How are things at the north pole? I hope you and Mrs. Santa have good wifi reception, and that the elves aren’t driving you crazy with their electric scooters and kombucha tea.

I know that at this time of year you’re very busy going over Git Blame, trying to see which developers were naughty and which were nice. And I’m guessing it’s also a crazy time at the gift factory, designing Christmas-themed tech conference swag and candy.

I hope you don’t find too many of my bugs in Git Blame. I promise you that I really did try to stick by the coding guidelines whenever I could and that I accepted and applied all the comments I got during code review sessions.

You’re right, I did push a couple of risky changes just before leaving for the weekend, and yes, I guess you could argue that it really upset my team. And yes, I did give crazy high time estimates because I didn’t want to be pressured by a deadline. I also blamed all my bugs on the Frontend team, and somehow I was able to both write too many and not enough comments at the same time. But I really didn’t mean to!

I know I’ve made some mistakes, but I’ve also tried *really hard* to be a good developer. I attended ALL of the meetings my TL told me to. Even the ones about security and compliance which are booooooring. I always made sure my code has enough test coverage, and I never pushed something without testing it locally first. Plus, I always help my friends when they need a code review, or when they struggle with regular expressions. Always.

So I think that if you balance my git karma, the state of my Jira backlog, the number of coffee cups left on my desk, and my average resolution time on pager duty, you’ll find that I was more naughty than nice.

Is that how it works? Is it kind of like the point system in ‘The Good Place’? How can you handle the large volume of children and the constant revision of what is considered “nice”?

Are you using a Random Forest algorithm? If so, how do you assign variable importance? And which IDE are you using? I would love to have a look at your code when you drop by on Christmas.

Anyway, if your algorithm does determine that I was Nice, I really don’t need a big present. Maybe some soundproof headphones so I can focus on my work. Maybe a new coffee machine, or a foosball table. Or maybe just some peace and quiet.

Of course, if you could also make my code run faster and with fewer bugs, it would be a Christmas miracle. Then again, I do believe in Dev Santa…  🙂

See you soon,

Me

Rookout Sandbox

No registration needed

Play Now

Table of Contents
Get the latest news

3 Things I Learned At KubeCon North America

Josh Hendrick | Senior Solutions Engineer

4 minutes

Table of Contents

We recently got back from an amazing KubeCon in San Diego, where attendance has skyrocketed to over 12,000 people. The impressive number of attendees is yet another sign of the extremely fast pace at which Cloud Native Computing and the surrounding tech space is growing. Organizations like the Cloud Native Computing Foundation (CNCF) have been gaining steam in growing the community of both enterprise and open-source software. Developers were out in force looking at the latest technologies available to improve their development workflows, exploring the best solutions for building modern, scalable applications. Here are my three main takeaways from this year’s KubeCon.

The cloud goes hybrid

Organizations are becoming more cognizant of vendor lock-in and are always on the lookout for solutions that allow them to easily move across environments. JFrog’s new Container Registry is one of the exciting technologies aimed at solving this problem. Essentially, it’s a collection of repositories for storing your built images in a centralized place for maximum manageability and control over the software release and delivery process. If you’ve developed containerized applications with the major cloud providers, you’ve likely used services such as AWS ECR, Azure ACR, or GCP GCR. JFrog’s solution brings the ability to be multi or hybrid cloud, allowing you to install it on-prem or in the cloud, wherever your application development work takes place. 

One of its nicer features is the fact it is not only a Docker Registry but a Helm Registry as well, creating a single place for Kubernetes developers to store their assets. With the announced release of Helm 3 at KubeCon this year, JFrog is banking on more and more organizations adopting Helm and needing a centralized solution to manage their assets. The solution also has some very useful caching capabilities which dramatically improve build times for applications. It allows for the configuration of remote repositories that can sit close to the environments where devs need to access images. And the best part, their cloud container registry is currently free to try out with up to 2GB of storage for 12 months.

Dev productivity tools are in the spotlight

There seemed to be an increased focus on developer productivity tools across the conference. From CI/CD to Service Meshes to Kubernetes add-ons that make cloud-native development easier and more simplified. One category that really stood out was the concept of Observability Pipelines. While the concept itself pre-dates this year’s Kubecon (here’s a great overview presentation from earlier this year), it is certainly gaining momentum out there. 

I really enjoyed this post, which defines Observability Pipelines as being “an event-driven workflow for filtering and routing operational data”. This includes things like multi-cloud monitoring solutions, routing and pipelining log data, as well as improved visualization of what’s happening within your application in real-time. The focus on Observability Pipelines also fits well with Rookout’s message: improving the ability to observe what’s happening within your apps at the code level, on-demand wherever your apps are running. It’s very exciting to see that bringing devs better tools and workflows with improved visibility into their apps is becoming more center stage.

Kubernetes: always moving forward

Another topic that was very apparent during this year’s KubeCon, was the continued evolution of Kubernetes platforms and services aimed at improving the ease of use and adoption of K8s by dev teams. Following their big announcement of acquiring Docker Enterprise, Mirantis was showcasing their Kubernetes-as-a-Service platform which again aims at being multi-cloud and touts eliminating vendor lock-in by being a pure Kubernetes offering. Rancher released its K3s offering, a lightweight Kubernetes solution for IoT or Edge computing. 

We’re even seeing enterprise-grade message queue brokers like KubeMQ being built to run cloud-natively bringing pub-sub style messaging directly within Kubernetes. They’re promising to make it faster and more secure for an organization looking to do as much work as possible within the clusters where their applications are running. As the rise of microservices continues, and so does the adoption of containerized technologies, this is a space that will proceed to grow exponentially over the coming years.

It’s not a race if we’re all on the same team

This year’s KubeCon proved once again that the industry focus on developers and making dev workflows simplified and more efficient is a major priority for most organizations. Other areas like multi/hybrid-cloud and moving away from vendor lock-in also tend to dominate marketing messages, and for good reason. 

On a different note, it was great to talk about the future of technology – and more so about the people behind it. In a truly inspiring keynote (watch it here, it is definitely worth your time) Kelsey Hightower reminded us all of the importance of a supportive and inclusive culture, and what a crucial role it plays in keeping technology moving forward. In his own words “It’s not a race if we’re all on the same team.”

Until KubeCon NA 2020 — Boston here we come!! 😉

Rookout Sandbox

No registration needed

Play Now

Table of Contents
Get the latest news

Why On Earth Did We Choose Jenkins For 2019?

Itiel Shwartz | Lead Production Engineer

Table of Contents

In this article, I’ll try to explain why the hell Rookout, a relatively new SaaS company, chose to use Jenkins, and what are the big advantages that make Jenkins so great even now, eight years in.

In the last few years, the devops world has changed rapidly:  We’ve moved from one big monolith architecture into microservices, from bare-metal servers into the cloud, and then into containers, and from there onto Lambda and Kubernetes. Impervious to all of these changes, Jenkins stands tall, with a community that just keeps growing. Jenkins has been around since 2011 (maybe even before, which counts for several lifetimes in this industry) and it ain’t going nowhere.

Here at Rookout, we thought hard about which CI/CD is the right one to use. Should we choose multiple SaaS CI/CD solutions or just use plain old Jenkins?

Spoiler alert: We chose Jenkins (with some CircleCi). Not because the other tools were bad but mainly because of the unmatchable flexibility and code-reuse Jenkins offered us.

The following are some of the Jenkins features and capabilities that played a starring role in our decision:

Don’t repeat yourself (Jenkins shared libraries)

What is it?

An independent repository where you can define chunks of reusable code and import them into your Pipelines as needed.

Why do we need it?

As you adopt Pipelines for more projects across an organization, common patterns are likely to emerge. Creating libraries to enable sharing of discrete parts of pipelines among projects reduces redundancies and keeps code “DRY” and compliant with best practices for software development.

How does it look in real life?

Jenkinsfile examples for two of our microservices:

Jenkinsfile examples for two of our microservices

To add a new microservice in Rookout all you need to do is to write three lines since the basic pipeline code is available in the shared library.

Run one test, two ways

What is it?

The ability to run the same test, either by triggering a commit or by cron.

Why do we need it?

If you have a good quality e2e test, you might want to run it on different occasions.

How does it look in real life?

  • Run this test as part of the deploy pipeline
  • Run the test every 10 min to make sure the system is working

Using Jenkins, you can just choose the trigger option you want and set it.

Run parameterized jobs

What is it?

Start the same job with different parameters each time.

Why do we need it?

This capability could be valuable in the following cases, as well as many more:

  • Running the CD pipeline with a different configuration to remove some safeties or to change flows
  • Running a test/cron on a different environment
  • When deploying a feature branch

How does it look in real life?

pipeline deploy_pipeline

Create complex Pipelines

What is it?

With Jenkins, you can trigger one job directly from another, and even have the second job wait for the first one to finish before it starts.

Why do we need it?

It allows you to automate your workflow. For instance, instead of doing the manual work of running tests each time a new version goes up, you just trigger the test pipeline when the deploy pipeline finishes.

It also offers you a simple way to sync tasks. So, for instance, if a lot of people push to master branch, it will run the deploys to staging one at a time.

How does it look in real life?

As an example, let’s see how multi repo CI/CD looks:

  1. For each repo, a commit to the master branch builds the docker image and the helm package.
  2. It then triggers the “deploy to staging pipeline” job, which (not surprisingly) deploys to staging.
  3. If we pushed to two repos at the same time, for instance, to backend and frontend, then the first job would trigger the “deploy pipeline” while the other would simply wait in the Jenkins queue.
  4. We can add another job trigger later. If the deployment to staging succeeds, it will deploy to production, and so on.

Rookout “deploy to staging” Pipeline example:

Rookout “deploy to staging” Pipeline example

Use code instead of a template language (Groovy vs YAML)

What is it?

When it comes to a choice between a programming language and a DSL, I’d opt for the DSL every time. Of course, others may feel differently.

Why do we need it?

The advantages of using Groovy rather than YAML include:

  1. Code reuse functionality (DRY again)
  2. The pipeline is more readable (using function)
  3. If/else/try/catch loops are part of the code.

How does it look in real life?

Groovy vs YAML

Use as a cron server

What is it?

An easy and useful way to schedule jobs.

Why do we need it?

Many, if not most of us, have cron jobs set up to do light housekeeping and other small tasks on the various servers that are scattered in different locations.

While these tasks are relatively minor, they need to be done. Yet cron does not make it easy to keep track of these tasks and make sure they’re getting done: No single point of management covers all servers; there’s no simple, yet reliable logging; and there are no notifications or other ways of easily confirming if tasks succeeded.

How does it look in real life?

Use as a cron server

Run dynamic agents in a K8S

What is it?

The Jenkins K8s plugin helps you automate scaling agents by letting you run dynamic agents in Kubernetes. It creates a Kubernetes Pod for each agent, as defined by the Docker image, and lets you use your own Docker images as the agent.

Why do we need this?

As we add more and more jobs to Jenkins, a single machine just can’t handle the workload. To address this challenge, Jenkins supports spawning “slaves” — machines other than the Jenkins master that can handle the jobs.

The k8s plugin offers us the ability to super-scale with no need to orchestrate anything manually.

If you’re a novice, check out this super cool starter guide for setting up a Jenkins CI/CD pipeline with K8s.

How does it look in real life?

We run the `sh` command in our own docker-image, which is a pod in K8s

Performance and security

What is it?

The fact the CI is running inside your cloud has some major advantages:

  1. Docker pull and push is a lot faster. In fact, we saw 10X improvement vs a hosted solution
  2. Spinning up slaves is fast! If each step in your CI/CD is using a dedicated docker image (slave), then spinning up those docker image slaves (k8s pod for us) is also a lot faster vs hosted CI — a few seconds in Jenkins vs +-30 in hosted solutions
  3. You can use your cloud provider security policy (IAM rules and similar)

Why do we need this?

Bet you can figure this one out!

How does it look in real life?

Mighty good!

The Jenkins community keeps on giving

The plugins, features, and capabilities above are specific examples of great things you can do with Jenkins. But the real thing that makes Jenkins great is the Jenkins community, which is HUGE and just keeps on growing. And since it is so huge and so active, everything you might ever need has probably already been implemented or tackled by someone else before you. This means that when you need a Jenkins plugin for almost anything, you can probably find it.

And I mean anything!

Let’s sum it all up

So even today, when a lot of good CI-as-a-service solutions are available, Jenkins continues to lead the way with its strength (and the strength of the huge community behind it) to customize almost everything.

The main reason we choose Jenkins and keep using it is its ability to do many things: Jenkins serves as a CI service, a cron service, and a CD service, all using the same language and by reusing a lot of code and logic.

That all means less technology to keep track of. If it weren’t for Jenkins, we would need to use 3 different SaaS, all with its own configs and learning curve.

So now that we have presented the rosy face of Jenkins, it’s important to admit that it presents some serious issues as well, especially for novice users. Stay tuned for our next blog post on Jenkins’ dark side:  Why not choose Jenkins in 2019?

Rookout Sandbox

No registration needed

Play Now

Table of Contents
Get the latest news

Why Ditching NGINX in K8S is a Traefik Choice

Liran Haimovitch | Co-Founder & CTO

4 minutes

Table of Contents

A Kubernetes Ingress is a collection of rules that allow inbound connections to reach cluster services. It can be configured to give services externally-reachable URLs, load balancer traffic, terminate SSL, offer name-based virtual hosting, and more.

NGINX ingresses are pretty much the default choice for cloud-agnostic ingresses, and it was our choice as well. That is until we decided to move to Traefik to terminate HTTP(S) traffic.

As you probably know, replacing ingresses is a tricky and time-consuming process. So what drove us to do that? What was our motivation to replace NGINX with Traefik? Stay tuned, because that’s exactly what I’m going to discuss in this post.

1. Defaults

The NGINX default configuration is not suited for modern REST and WebSocket APIs. After installing NGINX with Helm, our site-reliability engineers had to further tweak the configuration, resulting in the waste of precious time and resources.

For example, let’s look at configuring NGINX as a proxy. This requires the following additional settings:

 proxy-read-timeout: "900"
 proxy-body-size: 100m
 proxy-buffering: "on"
 proxy-buffer-size: "16k"

2. Configuration

When you have to configure your ingress for more advanced stuff, doing it with NGINX can become a nightmare. NGINX lacks proper documentation, so you usually end up relying on Google and StackOverflow. Minutes turn to hours as you scroll through obscure and often outdated answers to your issues.

Note: NGINX configuration files, like <em>nginx.conf</em>, uses a domain-specific language unique to NGINX, but it’s very intuitive.

Traefik, on the other hand, is much easier to use and you can find extensive documentation on its website. Activating simple features with Traefik does not require multiple complex settings as it does with NGINX, and the configuration itself tends to be a lot quicker and more concise as well.

While NGINX settings end up in huge config maps that are hard to read and manage, it’s not an issue with Traefik. This is because Traefik allows most configurations to be set using Helm values or Kubernetes Ingress annotations.

Let’s compare for example the configurations for turning on gzip compression in NGINX vs Traefik, for example.

NGINX gzip Configuration

gzip on;
    gzip_disable "msie6";
    gzip_vary on;
    gzip_proxied any;
    gzip_comp_level 6;
    gzip_buffers 16 8k;
    gzip_http_version 1.1;
    gzip_min_length 256;
    gzip_types text/plain text/css application/json application/x-javascript text/xml application/xml application/xml+rss text/javascript application/vnd.ms-fontobject application/x-font-ttf font/opentype image/svg+xml image/x-icon

Traefik gzip Configuration

compress = true

Here’s another example of NGINX vs Traefik. Configuring the web servers to return JSON logs requires the following configurations:

NGINX – JSON Logs Config

log-format-escape-json: 'true'
log-format-upstream: '{
    "proxy_protocol_addr": "$proxy_protocol_addr",
    "remote_addr": "$remote_addr", 
    "proxy_add_x_forwarded_for": "$proxy_add_x_forwarded_for",
    "remote_user": "$remote_user", 
    "time_local": "$time_local", 
    "request" : "$request",
    "status": "$status", 
    "body_bytes_sent": "$body_bytes_sent", 
    "http_referer":  "$http_referer",
    "http_user_agent": "$http_user_agent", 
    "request_length" : "$request_length",
    "request_time" : "$request_time", 
    "proxy_upstream_name": "$proxy_upstream_name",
    "upstream_addr": "$upstream_addr",  
    "upstream_response_length": "$upstream_response_length",
    "upstream_response_time": "$upstream_response_time", 
    "upstream_status": "$upstream_status"
  }'

Traefik – JSON Logs Config

format: json

3. Protocol Support

Traefik has the best HTTP/2 and gRPC support we have tested. Some of our requirements include TLS termination, header-based routing, high performance, and stability, on a scale of over 10k concurrent connections. Traefik has performed much better than NGINX and Istio for this use case.

4. Monitoring

The importance of monitoring your ingresses cannot be overstressed. They are the face of your application as seen by the world and are the main, and possibly the only place you can discern your app’s health.

The free open-source NGINX version does not support proper monitoring, and this is a huge disadvantage. To be fair, NGINX Plus offers much better monitoring features. Its price tag, however, simply could not be justified by our needs.

NGINX Ingress vs. Traefik in Summary

People are creatures of habit, and as it happens, the startups we create inherit that quality from us as well. As a startup, you often find yourself setting up your infrastructure with the good old tools you’ve been using in a former life. However, it’s important to question your choices and see if better options are available.

We arrived at the conclusion that NGINX didn’t age well. It couldn’t align with our monitoring and observability needs as well as protocol support and ease of use. We saw that putting in some time and effort into moving to Traefik will be worth it in the long run, and so we did it. If your conclusion is similar, making this move should be a worthwhile investment for you as well.

Rookout Sandbox

No registration needed

Play Now

Table of Contents
Get the latest news

The Unexpected Odyssey Of Naming A Tech Company

Or Weis | Co-Founder

5 minutes

Table of Contents

— “So what are we going to call this startup?”
— “I don’t know… Hmm… I guess something dot com or something dot io?”

We, humans, are story-driven creatures, and a good story needs good characters. From Odysseus to Sherlock Holmes, from RBG  to Daenerys Targaryen to Elon Musk. Good characters come with good names.

Elon Musk
One of my favorite fictional characters.

We attribute a lot of power to names, but does that power come with the name, or does the name come with the power? Yes, a rose by any other name might smell as sweet. But would ‘Google’ be Google without the company? Would it have soared up if it was named ‘Alphabet’ from the start? Would ‘Facebook’ be as big as it is, had it kept the “The” in its title?

Before Rookout was ‘Rookout’, we were just two software engineers working in garage-mode from my living room (I don’t actually own a garage). We had a vision: a data-collection and delivery solution, oriented at other fellow engineers and developers. But we had no name.

data-collection and delivery solution
Stock photo of two random entrepreneurs in a garage we didn’t have.

To shed some light — Rookout is a platform for live-data collection and delivery; replacing ridiculous amounts of work wasted on writing logs, debugging, database pipelines, analytics, and more. Rookout is used on-demand within seconds via non-breaking breakpoints, no restarts, coding, or redeployments required.

With such a technical, dev-oriented solution, we knew whatever name we’d choose had to be suitable. Perhaps something smart and geeky, or something that touches on advanced capabilities. We wanted our name to be agile and unique.

Greek gods and mythical creatures

Not sure if it was the Greek origin of Kubernetes and Istio, or simply the fact that Greek rhymes with Geek; but we began scouring various mythologies for stories and names. We quickly learned that Zeus, Apollo, Athena, and similar names are overused. Prometheus, for instance, is already a DevOps titan.

Checking into ancient Egypt, we felt Thoth was pretty cool. After all, he is the god of wisdom, among other things. But the name is a bit hard to pronounce. We even looked into Japanese mythology and learned about the cat-like monster “Nekomata”. Sure, cats rule the internet, but while the name rolls off the tongue, it is rather on the weird side.

Our next stop was Persian and Middle Eastern mythology and its majestic creatures. We especially liked the Roc. No, not Dwayne Johnson, but a powerful legendary bird with even more muscle mass. Seen here carrying an elephant with ease. Isn’t that an awesome name for a delivery infrastructure?

delivery infrastructure
Yep. Roc is an absolute unit.

But wait! We wanted something lighter, smarter, and maybe even geekier. Also, the fact that it’s super hard to find domains with just three letters kinda helped with our decision to continue our search.

Rook and Roll

One day, I remembered reading about a very clever bird, as in “Public asked to look out for clever rooks,” which led me to watch several cool videos of this bird and others of its kind. They solved puzzles and applied nimble intelligence to get the prize. Perfect for the bird’s-eye view we are envisioning for software, these birds seemed like the ideal lookout for our data collection technology. Plus, they sure did qualify for enabling it on-the-fly.

Rooks can even shape hooks, which is also perfect since hooks are the basic method used in Rookout’s underlying technology. With so many puns, plays, and geeky references, Rooks already sounded like a great base for our name.

Wouldn’t it be great if you had a small Rook in your code fetching you the exact data you need?
Wouldn’t it be great if you could Rook-Out any piece of data you need on the fly and deliver it anywhere you want?

Here’s Rook in our logo, resting on curly braces as part of the code.  

You name it!

Building a company, especially one in the Dev / DevOps space is quite a journey. A good journey is a good story, and a good story needs a good name. We chose Rookout because it’s geeky and fun. It’s full of puns, hints at tech, and even more importantly, it had an open dot com.

Here are some things we’ve learned while roaming through the jungles of names:

The number of ideas is going to be way higher than the number of people you have in your startup. Try looking at each idea objectively, without being too emotionally attached to any particular name. Consider the ups and downs of each suggestion. Then, use elimination to narrow down your options until you can funnel them into one.

Group options with a common theme – such as nautical, mythical, etc. In the future, they may be used as names of your product’s features. Naming a feature is almost as challenging as choosing a company name, so keep those handy suggestions nearby.

Make sure the name has a story around it! Who doesn’t enjoy a good story? Journalists and analysts alike love ending interviews by asking: “so what’s the story behind your startup’s name?” A story can make a big difference in making your company’s name easy to remember.

So, if you’re thinking of a name for your new company, keep these in mind. And may the name-choosing gods grant you safe passage on your travels. 😉

Rookout Sandbox

No registration needed

Play Now