Rookout is now a part of the Dynatrace family!

Table of Contents
Get the latest news

Chasing Clouds: The No-Bullshit Microservices Dev Guide (Part 3)

Liran Haimovitch | Co-Founder & CTO

10 minutes

Table of Contents

As deployments become more complex and require more moving parts, simulating the full microservice environment on a developer’s laptop becomes really tough. At a certain point, it just can’t be done right and provisioning a cloud-based environment becomes your dev weapon of choice.

This may be a less familiar option for devs who are new to microservices. However, it offers many important advantages and (you guessed it!) some significant drawbacks.

Developing in the cloud: the pros

You get a dev environment that is almost identical to production. That means that as you develop, your code is running almost as it does in production. Tests are more likely to reflect the truth. You can reproduce bugs reported by users way more easily. Plus, you’re much less likely to experience unpleasant surprises along the way than if you were developing in a less similar environment.

All technology building blocks are available. Going the cloud route means that all the building blocks you need are in place for dev. Since they’re the same elements you line up for production. Your cloud provider, DB, queue, and all other pieces of technology that you need are right there, ready to use.

And the cons

As you undoubtedly know, developing microservices in the cloud presents some real challenges as well.

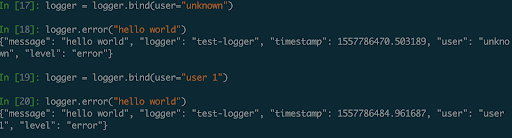
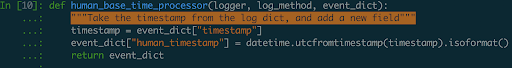
Low visibility into the dev environment. Cloud environments offer much less observability than your local machine. You can’t use your sniffer. You can’t set breakpoints in your application or change code easily. Logging and low-fidelity production monitoring tools are generally unavailable for cloud environments. We’ll have much more to say about how to tackle this issue and — dare we say, resolve it! — in the final post in this series. Be sure to check back to learn more.

Limited control of the dev environment. Devs have a much harder time controlling cloud work environments than they have with local environments. They have to learn entirely new tools and will often be restricted by limited permissions. All this makes it a lot harder to change the code and run applications again and again.

Computing costs. Setting up environments is expensive. Compute, storage, DBs, and other services all come at a cost. It is easy to run up large bills, especially if you do not adequately control the number of environments being spun up. Or if you neglect to ensure their release in an orderly fashion.

When is cloud the way to go?

  • When you need an environment that accurately reflects the production environment. This is always a good idea but is more crucial in some cases than others. But which cases exactly? Unfortunately, this can generally be identified only after a frustrating trial-and-error process of having a microservice (or even an element of a microservice) experience issues in production, then debugging and having issues arise again and again. In those cases, poor replication of the environment is most likely the culprit and moving to the cloud is the right way to go.
  • You need significant computing resources for developing your microservices. High CPU/memory requirements, low-latency to the cloud, access to many other microservices and so on.
  • Your application relies on cloud-based infrastructures, such as DBaaS or serverless, to run.
  • When end-to-end application flow is hard to simulate on your laptop.

Provisioning the cloud environment for development

Once you have opted to develop in the cloud, the first thing to do is decide how to provision working environments for your devs. Of course, “best” is a judgment call, based on a number of factors – budgets, your devs’ comfort level in the cloud, security considerations and more.

Let’s look at some of the provisioning options and the issues that will drive your decisions.

Static or dynamic?

Developers who cross over from the monolith world are accustomed to having dev environments that are ready and waiting for them at all times. It is certainly possible to allocate a static environment to each user, as well as the many cloud resources the dev will require, such as databases, load balancers, DNS records, and TLS certificates. Third-party integrations need to be set up as well for certification and configuration providers and more.

Static environments, however, are increasingly rare in the microservices world, and for good cause. In the dynamic microservices environments, especially for large apps, provisioning static environments as new devs join up, and keeping all those environments aligned and updated is a huge task.

Perhaps, more significantly, the costs of static environments are high: An environment must be dedicated to each dev around the clock, whether they’re using it or not. In the cloud, the cost of those services adds up to significant – and unnecessary – spend.

For these reasons, for microservices development in the cloud, especially with Kubernetes, dynamic environments which can be spun up as needed at the touch of a button, and de-provisioned when unneeded, simply make more sense.

Provisioning the dynamic environment

Once you opt for dynamic provisioning, a new world of decisions awaits, as well as some minefields. Considering the issues in advance, before starting the provisioning process, will help make it easier and smoother. Let’s run through some of the issues as well as the considerations that drive them.

What should the relationship be between dev and production accounts?

A number of issues play a role in choosing how and where to provision the cloud dev environment. These include logistics, security, production reliability, cost and business considerations.

  • Security dictates that dev and production be separated to the greatest possible extent to protect the production environment.
  • Logistically, however, using the same environment for production and development often makes life much easier for the DevOps team.
  • Equally importantly, developing in an environment that most closely replicates the production environment is efficient and yields the best results.

Using the same cloud provider for dev and production, as well as enabling economies of scale, make logistical sense. But beyond that, what should the balance be between the competing needs for closeness and separation? Or, to put it more practically, should the same account be used for development and production?

To a large extent, the answer hinges on financial, logistical and cost accounting considerations. In small organizations with smaller DevOps teams, managing large numbers of accounts might be more trouble than it is worth. Similarly, larger organizations might require the use of different accounts to allow for precise allocation of costs between development – an R&D expense – and production, which is a cost of sales.  

Of course, the choices are not black and white. Within a single account, security separation may be achieved by utilizing different Kubernetes clusters for production and dev. Yet some businesses may opt to use for the same clusters for both. If your finance department is strict about cost allocations, you will need to use separate Kubernetes clusters for production/staging and for dev so that you can accurately book costs for each.

Spot instances or on-demand?

Businesses with large teams can easily spin up dozens or hundreds of environments and run up significant costs. Especially if devs are not careful about deprovisioning environments that are no longer in use.

Using spot instances for dev environments can cut costs by a whopping 60 to 90%. These instances, which are also known as preemptible, are offered by the major cloud providers on the basis of surplus server capacity, without availability guarantees. On-demand instances are generally used for production: Using spot instances for production is not for the faint of heart since they can disappear with only minimal advance warning.

Complementary elements

Assembling, setting up and orchestrating resources for dev is often more difficult than provisioning the actual computing environments and can be time-consuming and costly. While some of the elements are essential for dev, others can sometimes be added only later, in staging, without causing undue difficulty. Alternatively, some resources can be shared among devs rather than provisioned for each instance.

Resources may include databases, either within Kubernetes or as a service, using Amazon RDS or Google Cloud SQL for database-on-the-fly; initial datasets in the database to provide initial functionality for the environment; networking, including setting up load balancers through Kubernetes services; DNS records; TLS certificates; and other elements required for your specific app.  

Dev accounts for third-party services that will be used in production, such as identity providers, must also be connected to the dev environment, and credentials entered. An initial investment of time and effort is required to ensure that all these elements are provisioned quickly, seamlessly and securely. In some cases, it may be easier and more cost effective to utilize static elements instead.

Tooling for provisioning

Congratulations! You’ve decided to set up your dev environment in the cloud and have established what that environment will include. Now it’s time to decide how much control you allow your developers when provisioning environments on their own.

The choice of which of the three common environment provisioning is right for your team depends on how ops-oriented your developers are and the level of permissions they hold. Each choice requires relevant tooling for spinning up environments as needed, as well as access to production accounts.

Manual

The easiest and most basic way to provision environments is to do so manually. By using Kubectl, Helm, or similar tools – assuming your devs know low-level tooling, have account-access permissions, and are familiar with the process of building Docker images on their own. While this is often the fastest option, only ops-oriented developers who can manage flows on their own can provision environments manually.

Tooling

Next-generation tooling for developing Kubernetes apps such as Skaffold by Google and Draft by Microsoft offer devs who have less knowledge of the underlying system a much simpler way to share and update configurations. By providing an end-to-end flow they take much of the pain out of learning how to properly operate Kubernetes. This way devs do not need to deal with building and rebuilding containers and pushing them to the environment.

Both tools offer two modes:

  • A CI mode, used by build automation tools to deploy to a cluster
  • A Dev mode, used by developers to immediately apply local changes to the development cluster

Devs require security permissions to use these tools just as they do for manual tools.

CI

The easiest way to make provisioning broadly accessible is to make it available at the press of a button — or its developer equivalent, which might be a CLI command or REST API. This easy-to-use and secure method makes provisioning development environments accessible for all developers, based on pre-defined, optimized CIs created by DevOps. Less-skilled developers can get environments as needed without delving into configuration issues, while basic configuration options are available to more sophisticated developers.

CIs also addresses security concerns by having permissions reside within the CI, rather than with individual devs. As such, they lower security and technology barriers to self-service provisioning. In addition, CI tools enable flexible, on-the-fly provisioning of other resources that otherwise would be much more complex to provision. Even exceptionally complex environments can be custom-programmed into CI tools for provisioning at the touch of a button.

Conclusion

In this post, we’ve discussed when to develop in the cloud. We’ve mentioned a number of issues to consider when establishing what you need for your cloud environment and how it will be provisioned. The next – and final — post in this series will focus on the challenges of actually developing in the cloud and how to address them. Stay tuned!

Rookout Sandbox

No registration needed

Play Now

Table of Contents
Get the latest news

Developing in the Cloud: The No-Bullshit Microservices Dev Guide (Part 4)

Liran Haimovitch | Co-Founder & CTO

7 minutes

Table of Contents

Welcome to the brave new world of developing in the cloud! You’ve heard all about the technical ins and outs of setting up a cloud-based microservices development environment and have decided to give it a whirl. Now you need to stock your toolbox with solutions that let you understand what your code is doing, so you know when something’s going wrong and can get accurate feedback as to what it is and how to fix it.

There are three general approaches to tooling up for cloud development. The first is to monitor the dev environment as you would production, using logs, APMs, and repurposing tools that are optimized to provide high-level feedback in production. The second approach is to use versions of the traditional debuggers you’ve used on your laptop which have been retrofitted to the cloud. The final option is to discover a new generation of debugging tools that are custom-designed to provide observability for cloud development.

Let’s have a better look at what each category of tools offers.

Production solutions

Traditional production tools allow you to see what your code is doing during the development process. Just as you would use them in production. The tools are optimized to provide high-level, low-fidelity feedback.

Because production tools are essential, many types of solutions are available, with several options to choose from for each type. Tools include:

Advantages

The major advantages of production tools focus on the central role they play in monitoring. The tools are widely available; most devs with any ops background are familiar with them and know how to use them. Production monitoring, tracking, and logging solutions are mature and reliable. Most are also relatively technology-agnostic, and you can use them in a variety of settings.

Disadvantages

Using production tools to monitor and debug microservices in dev, however, is far from ideal. You cannot use them during the early stages of development. And once you can, data is collected at low fidelity. So while the solutions can be relied on to alert you that something is wrong, they provide little direction as to just what that “something” is and how you can fix it.

Production tools generally provide a predefined, limited set of data.  Each time a dev needs to change the gathered data to get more information, it means writing additional code and redeploying the app. This can make debugging a long, painstaking, and painful process.

For devs that are not already familiar with them, learning to use production tools entails a significant learning curve. Since each tool only focuses on one aspect of production, devs require multiple solutions to monitor various aspects of the application. This duplication increases the burden on devs, consumes more resources, adds complexity to the debugging process, and drives up costs.

Debugger solutions

The second option for debugging microservices in the cloud is to utilize traditional debuggers which have been retrofitted for use in the cloud by tools such as Telepresence, Squash, and Draft. Beyond that standard functionality, each of these three solutions has its strengths and weaknesses.

Telepresence

Telepresence serves as a VPN for Kubernetes by making a laptop a network entity within the cluster. In effect, it allows you to execute your application locally, debug it on your machine and monitor it like a local application, while it’s acting as if it were running in the cloud. Beyond the obvious advantages of using a tool with which devs are familiar and comfortable, it also enables the use of valuable admin tools such as Postman, DataGrip, and others to access resources within Kubernetes.

On the downside, Telepresence works only with Kubernetes (obviously). It requires the reconfiguration of elements in the cloud deployment, including redirecting services to the dev’s machine. Thus, taking down from the cluster any deployment that is running locally, and making cloud resources available for local use.

Also, using a regular debugger to break into a microservices environment can easily disrupt it. Finally, using Telepresence to debug multiple microservices at the same time can be a cumbersome and error-prone process.

Squash

This is a debugger for microservices that utilizes remote debugging engines to provide a unified cross-microservice debugger experience. Plugins are available for several IDEs, which can be used to debug multiple processes within a microservices environment.

Alas, Squash also has some disadvantages. It currently supports only two languages, Java and Go. Plus, it requires a complex remote debugging configuration and cannot debug multiple replicas of the same deployment. Perhaps most discouraging is the fact that using a regular debugger in a microservices environment can easily break the system in unexpected ways. So you cannot always get an accurate read on what is actually occurring. Nonetheless, Squash is still a huge step up in the right direction for microservices debugging.

Draft

A third debugger solution is a promising tool that Microsoft is building to streamline the end-to-end development flow in Kubernetes. As we mentioned in Chasing Clouds, the previous installment of this series, it focuses on deploying code changes from a dev’s laptop to a cluster, as well as from a Git repo to a cluster through CI.

In this awesome video from a KubeCon SA 2018 session, Michelle Noorali demos using Draft to debug applications remotely. Unfortunately, docs on how we can do it ourselves are still missing. 🙁

When Draft does mature a bit, it should be an interesting tool for debugging Kubernetes, which we expect to have many of the same properties as Squash.

Non-breaking breakpoint solutions

Non-breaking breakpoint solutions, such as Stackdriver and Rookout, are designed as all-purpose debugging tools that enable devs to see what their code is doing, just as they would in their own IDE. The tools are optimized to provide high-fidelity data wherever your code is running, even in the cloud.

Among the main advantages of this new class of tools is that they do not break the environment or impact performance in any way. Dedicated web-based IDEs, installed and set up via SDKs, makes them easy to use. No redeployments are necessary, and they can simultaneously debug multiple microservices as well as multiple replicas of the same microservice. Non-breaking breakpoint solutions offer devs unparalleled visibility into interactions between microservices, as well as within individual microservices. They can be used in production as well as in development and staging.

By providing full debugging and data collection capabilities in production, non-breaking breakpoint solutions add clear and significant value to the dev toolkit. However, as a wholly new type of tool, they also require devs to adjust their techniques and learn to debug with a new tool that behaves differently than breakpoints that break.

While Stackdriver and Rookout utilize similar approaches, the solutions differ in some significant ways:

Stackdriver’s orientation is solely toward the Google Cloud — in fact, it is available free of cost to Google Cloud users. Rookout, on the other hand, is cloud-agnostic and can also be used on-premises. Rookout provides additional features for collaboration between devs and for sending data to third-party targets such as log aggregation and APMs. Check back here for more details about how Rookout and Stackdriver stack up in a future blog post.

It’s been quite a journey!

With this final post, our No-Bullshit Microservices Dev Guide draws to a close. Congratulations on making it through!

We hope it has helped you assess when local is the best option for developing your microservices and which tools can be helpful. When you decide to aim for the cloud, what to consider when provisioning your environment; and finally, the best tools for debugging your microservices in the cloud.

Still got questions? Bring them on! Microservices are a whole new development approach. Add in the cloud, and we are all, to some extent, on a steep learning curve. We’re happy to help as well as to hear your tips, suggestions, and feedback.

Rookout Sandbox

No registration needed

Play Now

Table of Contents
Get the latest news

Can’t Git No Satisfaction: Why We Need a New-Gen Source Control

Liran Haimovitch | Co-Founder & CTO

5 minutes

Table of Contents

Remember the good old days of enterprise software? When everything had to be installed on-premises? To install an application, you’d have to set up a big, vertically scalable server. You would then have to execute a single process written in C/C++, Java or .NET. Well, as you know, those days are long gone.

Everything has changed with the transition to the cloud and SaaS. Today, instead of comprising a single vertically scalable process, most applications comprise multiple horizontally scalable processes. This model was first pioneered by Google’s borg and by Netflix on EC2. Nowadays, though, you no longer have to be a large enterprise to access microservice infrastructures. Kubernetes and serverless have made microservices viable and accessible to even small startups and lone coders.

Let’s Git down to business

So where does Git fit into the picture? Git is an excellent match for single-process applications, but it starts to fail when it comes to multi-process applications. This is precisely what gave birth to the endless “mono-repo vs. multi-repo” flame-wars.

single-process applications

Each side of this debate classifies the other as zealous extremists (as only developers can!), but both of them miss the crux of the matter: Git and its accompanying ecosystem are not yet fit for the task of developing modern cloud-native applications.

Shots fired: multi-repos suck

Before we dive in, let’s answer this: what’s great about Git? It’s the almighty atomic commit, the groundbreaking (at the time) branching capabilities, and the ever-useful blame. Well, these beloved features all but disappear in a multi-repo setup. Working in multiple repositories comes with significant drawbacks, which is why it’s not at all surprising that some of the biggest names in the tech world, including Google and Facebook, have gone down the mono-repo path at a huge investment of time and resources.

Dependency management in a multi-repo setup is a nightmare. Instead of having everything in a single repository, you end up with repositories pointing to each other using two git features (git submodules and git subtree) and language-specific dependency management such as npm or Maven. The very existence of the many different methods to manage multi-repos is in itself proof that none of these tools are enough on their own. Git’s “source-of-truth” is no longer a single folder on your computer but a mishmash of source providers and various artifactories.

In developers’ everyday work, repository separation becomes an artificial barrier that impacts technological decisions. This creates a Conway’s Law effect, making early design decisions about component boundaries very hard to change. It also makes large scale refactorings a much trickier business.

However, the biggest failure of the multi-repo is cultural. Instead of having all your source code readily available to all developers, they have to jump hurdles to figure out which repo they need and then clone it. These seemingly-small obstacles often become high fences: developers stop reading and updating code in components and repositories that aren’t directly in their responsibility.

With all these engineering, operations and cultural barriers, why doesn’t everyone go the mono-repo route?

Take no prisoners: mono-repos suck too

Once you’ve packed everything into a single repository, figuring out the connections within the repository becomes a challenge. For humans, that can chip away at the original architecture, breaking away useful abstractions and jumbling everything together.

For machines, this lack of separation within the repo is even worse. When you push a code change to a repo, automated processes kick in. CI systems build and test the code, and then CD systems deploy it. Sometimes it’s to a test or staging environment, and sometimes directly to production.

There are certain components you will need to build and deploy hundreds of times a day. At the same time, there are other more delicate and mission-critical components. These require human supervision and extra precaution. The problem with mono-repository is that it mixes all of these components into one. More surprising is the fact that today’s vast Git CI ecosystem, with its impressive offerings in both the hosted and the SaaS space, doesn’t even try to tackle the issue. In fact, not only will Git CI tools rebuild and redeploy your entire repo, they are often built explicitly for multi-repo projects.

Another issue is large repository sizes. Git doesn’t handle large repos gracefully. You can easily end up with repo sizes that don’t fit in your hard-drive, or clone time that ends up in the hours. For big projects, this requires careful management and pruning of commit history. It is also essential to avoid committing dependencies, auto-generated files and other large files which may be necessary for specific scenarios.

Is there still hope for multi-repos?

There are new tools that seek to bring some of the benefits of mono-repos to multi-repos. These tools try to set up a configuration that would unite multiple repos under a single umbrella/abstraction layer, thus making managing multiple-repositories easier — for example, TwoSigma’s Git-meta, mateodelnorte’s meta, gitslave , and a bunch of others.

These tools bring back a bit of sanity into the complexities of managing multi-repos, reducing some of the toil and error-prone manual operations. But none of them truly give back the control and power of a single Git repo.

You can’t have your cake and Git it too

The downsides of multi-repos are real. You can’t deny the value of a (truly) single source of truth, (truly) atomic commits, and a (truly) single place to develop and collaborate. On the other hand, none of the downsides of mono-repos are inherent. All of them are related to the current implementation of the Git source control tool itself and its accompanying eco-system, especially CI/CD tools.

It’s time for a new generation of source control that wasn’t purely designed for open-source projects, C and the Linux kernel. A source control designed for delivering modern applications in a polyglot cloud-native world. One that embraces code dependencies and helps the engineering team define and manage them, rather than scaring them away. A source control that treats CI, CD, and releases as first-class citizens, rather than relying on the very useful add-ons provided by GitHub and its community.

Rookout Sandbox

No registration needed

Play Now

Table of Contents
Get the latest news

Stop shackling your data-scientists: tap into the dark side of ML / AI models

Or Weis | Co-Founder

3 minutes

Table of Contents

Developing Artificial Intelligence and Machine Learning models comes with many challenges. One of those challenges is understanding why a model acts in a certain way. What’s really happening behind its ‘decision-making’ process? What causes unforeseen behavior in a model? To offer a suitable solution we must first understand the problem. Is it a bug in the code? A structural error within the model itself? Or, perhaps it’s a biased dataset? The solution can be anything from a simple fix for a logical error to expanding the model via complex design work.

ML as a ‘black box’

Machine Learning and Artificial intelligence are a black box. While we’re entering and receiving data, we seldom understand exactly why it’s making the decisions that it makes. Data scientists attempting to improve their model need the right data to do so. Even when working locally, in the lab (say in Jupyter notebook), the overall software environment masks the behavioral data of the ML model from the scientists, adding ridiculous and unneeded friction.

Said masking is significantly worse when models are deployed in staging or production environments, which are often exclusively managed by IT or engineering teams. Consequently, data scientists have no choice but to rely on those teams. This can be a very frustrating and resource-heavy process both in terms of time and money. Even though the required data may be right in front of scientists, there is no way to see or access it directly. Well, until now, that is.

We wanted to empower data scientists by reducing the opaqueness of Machine Learning models. Creating more visibility into those models would enable professionals to understand models better; making adding new features, developing new data dimensions, and improving model accuracy much easier. This is why we have just introduced our first ‘Instant Observability’ flow for machine learning, AI, and big data systems; supporting Apache Spark, Tensorflow, and more.

Instant observability into your model

With Rookout’s new offering, data scientists can now observe their ML and AI models live in action at all stages of development. With this new capability, Machine Learning experts can get the data they need, regardless of whether the model is being trained, or if it’s running in the cloud or locally. A data scientist can use Rookout to debug in the lab, while the model is running and being trained, within Jupyter notebook, for instance, and then still get data after deployment and when the model is in production. Plus, there’s no need to add extra code, restart or redeploy. This way, data scientists can monitor, debug, iterate, and improve their models faster and more efficiently.

As you can see from the demo video above, professionals can now collect data-points in real-time, throughout the lifecycle of an ML model. Rookout makes model inputs, answers, and peripheral data accessible on-demand, on any platform. Now, when data scientists require data, they no longer have to request code changes from the IT and engineering teams or wait for the next release. They can simply use Rookout and observe in real-time as their models make decisions. These capabilities not only liberate data scientists but also free up backend engineers and CI/CD pipelines to focus on their own core work.

A new understanding

As we were working on this new tool, we’ve cooperated with several of our existing customers as beta design partners. One of these partners is Otonomo, the automotive data services platform. They use Spark for processing and analysis of their connected car user data. The company required a solution that would allow them to view every component of their distributed computing system running simultaneously. With Rookout, they can now quickly debug code that was previously hard-to-access, even as it runs in production.

Is there an easy way to understand the particular behavior of a Machine Learning model? Probably not. But with Rookout’s new feature and its non-breaking breakpoints, it is now possible to watch the behavior of ML models throughout their lifecycle. Data scientists can now iterate and improve their models much faster, without being slowed down by engineers and deployment cycles.

Rookout Sandbox

No registration needed

Play Now

Table of Contents
Get the latest news

K8s: Why it’s time to ditch legacy debugging

Zohar Einy | Solution Manager

6 minutes

Table of Contents

Kubernetes is a highly distributed, microservices oriented technology that allows devs to run code at scale. K8S revolutionized cloud infrastructure and made our lives a whole lot easier in many aspects. Developers don’t have to do anything but write code and wrap it in the docker container for K8S to handle. But even its greatest enthusiasts will admit debugging Kubernetes pods is still a pain.

In such a highly distributed system, reproducing the state of an error for simulating the exact situation you need to investigate is very difficult. In this post, I’m going to break down the existing approaches to troubleshooting and debugging Kubernetes applications, both looking at classic local debugging and the new methods of debugging remotely – directly in the cloud and in production – reviewing the pros and cons, and taking a glimpse at the future.

Our forefathers’ legacy: Debugging locally

Every developer debugs locally as part of their development cycle. Local debugging is the good old legacy we all grew up on as developers. It’s a crucial part of the development process and we do it pretty much every day. However, when it comes to K8S and the complexities of microservices architecture it becomes immensely difficult.

Each microservice you have will both serve and use services by other microservices. To add a new microservice to this complex architecture you will have to simulate the entire infrastructure and all of the relevant components on your own machine. You’ll have to do the same to be able to debug it. There are currently four popular approaches for simulating the different microservices and all of their dependencies locally:

  1. Automation Script – Usually provided by the DevOps / lead developer, the script makes sure devs can run the microservices on their own machines by simply running execution commands in order. The script often breaks, however, since you have to control the configuration and how the branch you’re using is aligned with other branches running on your machine. For developers, this can be a very iterative and frustrating process.
  2. Hotel – [OpenSource] – Performs as a local process manager for running microservices. Devs can start and stop services and see all of the logs within a single screen in the browser. Has the same disadvantages that the Automation Script has. Plus, it forces the dev team to get familiar with a new tool.
  3. Docker Compose – A tool for defining and running multi-container Docker applications. Its YAML needs to be maintained according to the architectural changes. It might also be difficult to replicate a more advanced Kubernetes configuration as part of the Compose. Another minor disadvantage is that it writes all logs (from all microservices) to one place. This forces developers to use grep command to isolate the logs for each microservice they would like to focus on.
  4. MinikubeAn official tool by CNCF which allows you to easily spin up a Kubernetes instance on your machine. Surprisingly, quite often your K8S configurations will likely not work out of the box in Minikube and may require some minor tweaking. Even worse, during the development process, devs may often need to make changes to the K8S configuration – adding/removing services for example. The learning curve required to use K8S with Minikube can be quite intimidating to some devs.

Sailing on a cloud: Debugging K8s remotely

While you’re able to debug the microservices which are hosted by your cloud providers, K8S has its own orchestration mechanism and optimization methodologies. Those methodologies make K8S great, but they also make debugging such a pain. Accessing pods is a very unstable operation. If you want to SSH to try and run your debugging tools on your pod, K8S might actually kill it a second before you get the data you wanted. So what are your current options?

  1. `logger.info(“Got Exit Signal: {}”.format(sig))` – The oldest trick in the book.
  2. Attaching to a process – This can be hard since you’ll have to share process id namespace between the debugger and the application – between the containers inside the pod;
  3. Redirecting traffic from the cluster to the developer’s machine – this will help you recreate an issue, but it isn’t secure and has disadvantages. If lots of data is pipelined through your system, this might be something your local computer won’t be able to handle.
    a. Sometimes you need to install DaemonSet on each node – which is privileged and mounts the container runtime socket.
    b. Privileged service running on each node, able to see all processes on all nodes.
    c. Redirecting traffic capability exposes data to the internet.
  4. Service mesh (Istio/ Linkerd, etc.) – this term describes the network of microservices and the interactions between them. It can track your microservices without the need to change your code. Service mesh proxies both inbound and outbound traffic, which makes it an ideal place to add debugging and tracing capabilities. It’s out-of-the-box distributed tracing capabilities allow you to see the full flow of a request through your microservices stack, and to pinpoint problematic requests or microservices. You can also get out-of-the-box success rate, requests per second and latency percentiles, and send them directly to your metrics DB, like Prometheus. The main downside of service mesh debugging is the fact it lacks the ability to find the root cause of an issue. It can tell you that microservice A is slow, but it won’t tell you why. This will often require you to dive back into the code with other tools to get to the bottom line.
  5. Adding logs at runtime solutions – this is the easiest way to deploy to your K8S architecture. Deployment means adding an SDK only to your code. It allows you to add more logs on the fly and you won’t have to write more code and redeploy to get your data instantly. This is, in fact, a dynamic way to get logs and applicative data from your code in real-time. Solutions in this space include Stackdriver debugger for GCP, and Rookout (all clouds)

Meet Rookout: on-demand, live datapoint collection

Rookout implements the fifth approach: adding logs/debug-snapshots at runtime and provides a solution for rapid debugging for dev, staging and production environments. It allows you to get the data you need from your Kubernetes application without writing more code, restarting, and redeploying. And best of all, it works the same way for local, remote, and even production deployments.

It feels just like working with a regular debugger. You set a breakpoint and get data instantly, only it never stops your application, at any moment. Rookout collects the data and pipelines it on the fly while allowing the application to perform continuously. Today it supports Node.JS, JVM-based languages (Java, Scala, Kotlin, etc.), and Python-based applications (2 and 3) both for PyPy and CPython interpreters, and will gradually cover everything.

As you can see in the video, I just discovered a bug in my K8s app.

Want to see how I fix it in just a couple of minutes? Register to check out the full video-guide to debugging K8S.

Rookout Sandbox

No registration needed

Play Now

Table of Contents
Get the latest news

Cloud Logging: machines first, humans second

Itiel Shwartz | Lead Production Engineer

6 minutes

Table of Contents

Logs. Do we really need them? As developers, we write the code and the tests, and everything seems to be looking great. Why then, do we need to spend even more time writing a bunch of lines nobody is ever going to read?

Recently I did a talk on the subject at StatsCraft (check out the slides here). This post, a summary of the talk I gave, will discuss why we need good, informative logs, and how we can write them well enough. I’ll also cover different tools that might just take your logging to the next level.

Logging for humans

Usually, one can divide the logging journey into three stages. First is no logs at all, aka ‘logs are for losers’:  at this point, the developers simply don’t believe in the importance of logs. They often realize their mistake only when it’s too late, both figuratively and literally: usually sometime in the middle of the night when something fails for no apparent reason.

The next stage is bad logging: the developer is adding some unhelpful log message. For instance: Something bad has happened. This isn’t really useful, but it is still better than no logging at all.

And finally, the stage we all want to reach – good logging: here we understand logging is important and start writing descriptive messages. Something like:

Org name is not valid, org_name=”hello world”, timestamp is 1989/11/11

So how do you make sure you’re always at the ‘good logging’ stage? It might help to remember the following:

  • When writing logs do not think of yourself but focus instead on the dev that will probably encounter that log later on. Would you understand it out of context if you were in his/her shoes?
  • When unexpected things happen – you should log them. Let’s keep surprises to the bare minimum, especially unpleasant ones…
  • Each log should contain as much relevant data as possible. You can’t have too many relevant details. Every little piece of data can be crucial when something goes south.
  • It’s OK to add and remove logs. Logging is dynamic – in order to increase visibility or reduce noise, add and remove logs whenever needed.

Logging for machines

The world of logging for machines is full of possibilities. In most cases, data is going to arrive at some sort of centralized logging system such as ELK, Logz, Splunk, etc. We now have visualization, alerts, aggregation with other logs, smart search, and much more. As you may know, these features are missing when writing a log that is intended to be readable by a human. So how can we make logs better for machines?  A good start would be to remember that the King of logging for machines is, of course, JSON.

In order to better understand our logs’ context, it’s wise to add as much information as possible:

  • Adding request-related fields: org name, IP, user email, time, etc. This will allow devs to understand how, when, and who this log refers to.
  • Per env – commit hash, GitHub tag, machine name. This will allow devs to understand if the problem is something new/sporadic (per machine), or something that happens across all machines.
  • Use a smarter logger to get better logs – “for free” 🙂

Machine logs

Python – Structlog: `structlog` makes logging in Python more powerful and less painful. With it, you can add structure to your log entries. If you wish, `structlog` can take care of your log entries output. You can also choose to forward them to a preferred logging system.

There are several advantages to smart logging:

  1. it’s easy to implement and use. Its interface is very similar to the ‘regular’ logger, with more capabilities:
  1. Data binding. Since log entries are dictionaries, you can start binding and re-binding key/value pairs to your loggers to ensure they are present in every following logging call:
  1. Powerful Pipelines. Each log entry goes through a processor pipeline which is just a chain of functions. These functions receive a dictionary and return a new dictionary which gets fed into the next function. That allows for simple but powerful data manipulation. Old log:
  1. A log enrichment function (happens once per log):
  1. New log:

Similar logging infra exists in any language: Golang – Logrus, JS – Winston, etc.

Distributed tracing: or as it’s often called — request tracing. This method can be used for profiling and monitoring apps, mostly those based on a microservices architecture. Using distributed tracing can help track down the causes of poor performance and the exact spots where failures had occurred. This method allows devs to track requests through multiple services, providing various metadata which can later be reassembled into a complete picture of the app’s behavior at runtime.

Logging for everyone, on-demand!

Logging data in advance can be challenging. So what happens if you forget to set a log line and things come crashing down? Or when the only log you have says Something bad happened? Luckily, there are tools you can use to quickly get the data you need from your application while it’s running.

Stackdriver: If your app is running on Google Cloud you can use Stackdriver to get data from your code using breakpoints in production. However, it is geared towards helping devs integrate with the Google Cloud platform, and isn’t meant to be used as a general data collection tool.

Rookout: Set non-breaking breakpoints in your production code and get any data you might need – in an instant. This means you don’t have to write extra code, restart or redeploy your application. Just click and get the exact data you need in real-time. Rookout works on all clouds and platforms seamlessly: On-Prem, Monoliths, GCP, Azure, AWS, AWS Lambda, ECS, Fargate, etc. You can also pipeline your data anywhere it might be needed: DBs, APM, logging, exception manager, alerting, etc. Moreover, your data doesn’t have to go through the cloud at all, or even through Rookout’s server. You can drive data directly to your final target, even within your internal network.

Among the unique aspects of Rookout as an infrastructure solution is adding a temporal aspect to logs. Suddenly, developers can say and apply things like “I want this log for only a week.” “I want these data snapshots only when a specific condition happens.” “I want this data to be collected until an event happens,” or “I want this service to collect data until another service decides otherwise”. Rookout completely changes the way we can think about logs.

We’ve come a log way

Driving logs down the river of time, we’ve come a very long way. From simple human text lines, through smart, best practices, structured data, processing pipelines, tracing, to on-demand logging for everyone with a click.

Every step in this journey is a step in the evolution of software, both as a whole and per project. No one can be certain if this journey has an end, but the ride and every step of the way sure get easier with each log line.

Rookout Sandbox

No registration needed

Play Now

Table of Contents
Get the latest news

Why your devs suck at dev-on-call

Or Weis | Co-Founder

11 minutes

Table of Contents

Written in collaboration with Mickael Alliel

Modern software production stops for no one, and everyone is needed to keep it rolling. Every dev is on-call. Great speed and friction produce a lot of heat, and when everything is on fire all the time, even the best devs and engineers struggle to keep the train speeding onward without getting burned.

What makes maintaining modern software production so challenging? And what is the difference between being good and being bad at dev-on-call? Let’s dive in and see.

Back in my day, things were simple

In days gone by, software projects were far simpler things than what we know today. As we moved from single-process desktop apps to large-scale, distributed, cloud-based solutions, simplicity was run over by the move-fast-and-break-things truck of complexity. Supporting and maintaining software evolved from a simple task carried by small teams with a basic skill set, to company-wide efforts, requiring our best engineers.

Nowadays, software projects comprise multiple services and microservices distributed in the cloud (as well as on-prem, at the edge, and on physical devices). Each service is created by a different dev, a different team, and maybe even a different department or a third party. However, all of these parts must harmoniously play together as a beautiful orchestra, and as we’ve mentioned before: stopping or pausing is not an option.

Supporting and maintaining software

The show must go on!

It doesn’t matter if a company is aiming for 99.9 or 99.99 percent uptime, or whether it settles on a mere 90%. There is no real way of avoiding a 24/7 dev availability pattern. This brought about the ridiculous fast growth of solutions like Pagerduty, Opsgenie, Victor-ops, and more.

So now we page, alert, and wake our devs around the clock. But even if they can shake the daze of sleep and sand from their eyes at 3 am, can we expect them to succeed? It turns out that the late hours are the least of your devs’ problems.

The following is a thorough yet incomplete list of the challenges devs often face while being on-call. To understand the hardships devs go through when they’re on-call, you’ll have to put yourself in a developer’s shoes for the next few paragraphs. It’s going to be quite a journey, are you ready? Here we go.

Why is dev on call so hard?

Jumble

Context-switches: Being dev-on-call takes a toll on your mental health. You are facing context switches between your regular tasks and production issues which keep popping up every so often. This requires you to stop everything you’re doing and take care of the issue at hand. Good luck going back to… What was it I was doing again?

Handoffs: With software constantly becoming more complex, it’s rare for one developer to have all the knowledge, skill, and expertise to fully resolve an issue. This often requires incidents to involve multiple team members, and escalate or hand off the case to another fellow. Also, let’s be honest for a sec here. When you’re fixing something in the middle of the night you just want to go back to sleep. The last thing you want to do is write down what happened and how you fixed it. By the time the next person gets to be on-call, you’ll probably forget to tell them some crucial piece of info that would’ve saved the moment when the same issue occurred again.

Stress

This one is kind of a no-brainer. You’re working late, long hours while being the sole person responsible for solving critical issues that may pop up in unexpected times. The pressure IS ON (we’ll save you an extra Queen reference here)! Joining this party are also blame, shame, public embarrassment, and their millennial compatriot – FOMO (fear of missing out).

After working a 10-hour workday, you go back home but you need to take care of something again. You may have to cancel some social events you wanted to attend. If you’re in an adventurous mood, when you finally go out to dinner with a friend, you inevitably need to take out your laptop because an alert has just popped up. Tired, you fix the issue rapidly but then, when something else breaks down because of it, you’re the one getting blamed.

Lack of familiarity and domain expertise

Dependency on others and proprietary practices: You might be navigating unknown territories and you’re not familiar enough with the code where the issue arises. Not knowing how to query logs efficiently, or what to look for in APMs and metrics systems can make dev-on-call duty unbearable.

Missing internal documentation on resolving the issue: There will always be a moment when you stumble upon something that was done 6 months ago, went undocumented, and needs to be fixed. This takes me back to the time I was renewing an SSL certificate to use in a Google cloud storage public endpoint. I found a bash script buried deep inside of folders nobody has ever bothered to check. The script used a command-line tool that has become deprecated, was renamed, and has changed its default configuration since the last time we used it. How was I supposed to know that Google accepts ‘ec256’ generated private keys, but the default of our command-line tool generated ‘ec384’ type keys? When Google fails it just says it failed, nothing else. Sometimes Google just doesn’t have all the answers.

Being confined and limited

Limited access: You’re on-call. You’re the one person who is supposed to take care of issues when nobody else can, and yet, you don’t have access to the database. You cannot update users nor this one script that can save the company since it requires a password you do not have. It’s 2:30 AM, of course, no one with the ability to help is answering their phone.

Limited visibility/observability: New components and systems are added to software projects on a daily basis, and code depth constantly increases. Even with all the available logging, APM and tracing solutions, you often find that the answer to the problem you’re trying to solve is beyond your reach. The issues that have logs/ traces/ exceptions/ etc. in the first place are the ones we already know about. What about all the rest? It’s rare that humans (devs included) do a good job of predicting the future.

Once, when I was on-call, I had an easy task to implement: send an SMS with a confirmation code. I thought to myself, “this is a perfect serverless use-case,” and went on to write a lambda function only to forget that the easiest tasks always come back to haunt me. Lambdas are a pain to debug since there was (see below) no easy way to observe them without updating them. And so, I had to go through hell to understand what was going on in my serverless function.

Distributed problems

In distributed cloud computing, finding out where the issue came from and which server to debug is not always a trivial task. Microservice architecture, multiregional cluster, load balancing, thousands of requests per second. Do all these buzzwords sound familiar? Well, imagine how I felt when a customer was sending a badly formatted request. I can tell you this for sure: it was not making things better. Finding out who it’s coming from is easy. The hard part is figuring out where it’s going and intercepting it soon enough to get something useful out of the server crashing. Because the logs just aren’t enough. That’s when you connect a remote debugger into a random server hoping for the jackpot. Oh, and it’s also when you wish you had added more logs last week.

You can step out of the dev-shoes now. That was quite a ride now, wasn’t it? Is it any wonder then, that being on-call is so frustrating for devs? With so much working against them, are we setting our developers for failure (sooner or later) in dev-on-call? How can we set up the playing field for success?

playing field for success

Culture to the rescue: Empower people

Being on-call infringes on the developer’s personal time, which isn’t fun for any of us. However, a lot of the negativity around dev-on-call actually comes from the organization and its culture. If the organization doesn’t value and give proper incentives and compensation for the developer’s investment and time, frustration and resentment will be quick to follow.

Build a sustainable and positive experience for your developers

You can do that via a healthy on-call rotation. Make sure you have a supportive team of engineers who have a deep understanding of the system and its architecture. Moreover, make sure they have the best tools available to help them solve issues faster.

Encourage the sharing and propagation of information

Every time an on-call issue is resolved – it must be documented. Because it WILL happen again. When it does, you’ll be happy your devs took the time for the documentation process. Teams must understand that when they’re unwilling to document an issue, they’re simply shooting themselves in the foot.

Let devs know when to escalate

Promote teamwork and good communications within your R&D department. That way, when your devs are stuck and unsure of what to do, they won’t gamble. Knowing their team is fully behind them, your devs will call someone who knows. Sure, it might bother them, but it will probably save the entire dev team and the company a whole lot of trouble in the long run.

Bake handoffs into your methodology

We’ve all heard the good old “The dev on-call before me, didn’t tell me about issue X/Y” excuse. Well, that’s now a problem for the current dev-on-call to solve. Motivate your devs to ask questions! The previous dev-on-call may have been too distracted or too tired to document an important issue. It is every dev’s responsibility to keep surprises to a minimum by asking the ones who came before them as many questions as possible.

Finally, encourage developers to learn from the experience of others. Seek and learn from other companies’ dev-on-call War Stories. They might come in handy when your devs run into a similar issue when they’re on-call.

when your devs run into a similar issue

Technology to the rescue: Liberate Data

By now everyone knows the basic tools of the SRE/Dev-on-call trade: Using round-robin scheduling to wake the devs with paging solutions (Pagerduty, Opsgine, etc.); Syncing them on tickets with ticketing systems like Jira and Zendesk, all initially triggered by APM solutions  (AppD, Datadog, Newrelic, Prometheus etc.) or exception management (like Sentry.io or Rollbar). But what’s the next step? How can technology help us face the remaining challenges of dev-on-call work?

A repeating theme we noticed in the challenges of dev-on-call is access to data. Access to any type of data can make a difference, be it organizational data, operational data, behavioral data, or any other kind. Developers at large and those who are on-call in particular, require the ability to access data around and within the software and share it in a clear manner within a team.

Sharing data

Existing platforms, such as the exception management platform Sentry.io, are expanding to add more integrations and team management capabilities. Their aim is to create better communication around errors and incidents. New solutions like Blameless.com offer tailored experiences for SRE/ dev-on-call team flow. Aimed at bringing a more systematic approach to both incident data sharing, and post-mortem data sharing, while setting the ground for automation / AI for incidents.

Accessing data and Observability

On-the-fly data collection solutions like Rookout provide a platform for retrieving data-points, variables, log-lines, and metrics from LIVE software, on-demand with non-breaking breakpoints. This enables devs (on-call and not), DevOps, support SREs, and others to instantly access data in production code and share it with the rest of the team to drill down the issue.

Rookout connects to other tools like logging, APM, Slack, and more, allowing users to aggregate all necessary data for sharing in the organization’s data-sink of choice. With the democratization of data, Rookout empowers multiple personas to take part in dev-on-call, thus making handoffs much easier. And the best part? It’s available for free here.

Accessing and Sharing Data

As the ecosystem matures, aggregation and sharing solutions are beginning to interconnect. This is clearly seen in the integration between Rookout and Sentry.io in which devs can move directly from an alert to accessing and sharing more data with the team.

If you can’t stand the heat, stay out of production

The cloud is steamrolling at your door, can your devs stand the heat? With the complexity of the dev-on-call challenge crystalized and the key methods to approach the challenge both with culture and tech, we believe you can fend off the flames.

Got dev-on-call war stories to share? Don’t be shy shoot us an email at warstories@rookout.com, and you can have your story immortalized as part of the following posts in this series.

Rookout Sandbox

No registration needed

Play Now

Debugging Other People's Code
Table of Contents
Get the latest news

How to make debugging other people’s legacy code suck less

Or Weis | Co-Founder

6 minutes

Debugging Other People's Code
Table of Contents

It’s 2 AM on a Saturday and you get a call. You bolt out of bed and pick up the phone knowing that something terrible has happened. No, your dog didn’t get kidnapped and you don’t need to use your particular set of skills and parental rage to bring its captors to justice. Instead, your weekend slumber has been interrupted because there’s a bug in a system and you have to fix it.

Debugging other people's code

Whether you’re debugging legacy code early on a Saturday or in the middle of the workweek it sucks. Nearly every system that you work on will have code that was written by someone else. In some cases, that code may have been written more than 10 years ago.

When some old code creates a bug what should your first line of defense be? Surprisingly it’s not a methodology or a tool. It’s a personality trait. Let me explain.

Empathy: the first line of defense against legacy code debugging

“Programming today is a race between software engineers striving to build bigger and better idiot-proof programs, and the Universe trying to produce bigger and better idiots. So far, the Universe is winning”. – Rick Cook

After dealing with many bugs, I know how easy it is to get frustrated. But, the real key to making headway is showing empathy toward whoever wrote the code in the first place. This breaks you out of fight or flight thinking and helps you approach the problem logically. Use these questions to develop empathy for your fellow developers:

  • What was the last developer trying to achieve?
  • What was their mindset for achieving this goal?
  • What pitfalls may they have inadvertently run into and how could they have dealt with them?
  • How did the challenges at that point in time affect their thinking?

These questions will keep you open-minded and help you understand the landscape faster. Most importantly, they help you identify the mindsets of those who wrote the legacy code. The closer you get to their thinking, the better you walk in their shoes, the more likely you’ll be to understand their intentions and the strengths and weaknesses of their code/design. Understandings that will speed up your debugging process.

Applying empathy to your debugging process

Think of empathy as your prep work. It gets you in the mindset to understand other people’s mindsets. Now you need to apply it to a process.

Here’s what I’ve seen to be the most critical steps in the process of debugging legacy code.

  1. No man is an island. Get the right information handoff. Before you can debug anything, you need to understand what it does and how it does it. More often than not, there will still be someone at the company who understands the code, even if they didn’t write it. Your goal is to gather information, understand their mindset, and learn the history of that piece of software. This will help you see things from their perspective as you work through the documentation and code. While it’s easy to think “I can figure it out on my own,” sharing mindsets with other people often creates faster and better results.
  2. No (micro)service is an island. Understand the architecture around the system. The component you’re working on will rarely be standalone, and you’ll rarely be able to fully understand it and how it affects the system without looking at the bigger picture. To understand the architecture, ask yourself: What are the requirements for the system? What top-level concepts are part of this system?
  3. Read before you run. Start with a static review. Read through the code and recreate the process in your mind. Use empathy and the information you’ve gathered to understand why things were done a certain way and where errors could exist. It can be tempting to jump right in guns blazing and just run the code to see where it fails. While you usually won’t miss key information for debugging, you would be missing the right context and mindset to interpret this information.
  4. Take it for a run. Continue with a dynamic review. By running the software, especially with the help of a debugger, you can observe how it behaves and review its log lines. You’ll also be able to test out data flows, which is very important for systems that rely on other components. Enabling you to see the bigger picture from the details.

Into the onion, skills to keep you at the top of your game

“Debugging is like an onion. There are multiple layers to it, and the more you peel them back, the more likely you’re going to start crying at inappropriate times.” – @iamdevloper

Software as a whole is going through changes. Systems are more scaled up, distributed, and asynchronous. This creates opportunities for friction, especially in older software that contains legacy code which is more likely to break in this modern framework. And it makes it more difficult for you to determine where the bugs are. These changes also mean that debugging processes are getting more complicated.

To keep up, you need to keep developing your skills as a developer. There are three specific skills that I advise developers to cultivate so that they can be at the top of their game.

First, the most critical skill is being able to work with and shift between mindsets quickly. As a developer, you need to quickly shift between the mindsets behind every one of the many components that make up a system. This is extremely hard to do (we’re humans and have limited brainpower), but when you achieve it, you’ll be able to debug more quickly in high-pressure situations.

Second, you need to use your time more wisely than ever. The more encapsulated, complex, or data-driven a solution is, the more difficult it will be to see the truth of how it functions. One client told us that just getting set up for preliminary debugging is laborious and takes at least an hour. When you understand how to prioritize your testing, you’ll be able to get in the zone and get the answers you need before it’s too late.

Third, you need to master the art of data collection and debugging without breaking stuff. Use non-breaking breakpoints and observability tools to understand as much as you can, so you can minimize logging and redeployment efforts.

Killing bugs with kindness (and empathy)

Debugging other people’s legacy code will always suck. But, you don’t have to feel helpless while the bug holds your systems captive. Build up your empathy, learn to use mindsets to your advantage, and make good use of your debugging time. With this particular set of skills, you will find the bug, you will kill it, and you might even get a sequel.

Rookout Sandbox

No registration needed

Play Now

Table of Contents
Get the latest news

Towards Better DevOps KPIs: A codeless change maturity model

Liran Haimovitch | Co-Founder & CTO

6 minutes

Table of Contents

DevOps Research and Assessment (DORA) and Google Cloud recently released the 2019 Accelerate State of DevOps Report. The report discusses four core DevOps key performance indicators (KPIs) for measuring change. For most of us in software engineering, especially in the era of “configuration as code,” change means “code change” and is about commits to some source control repository.

And yet, value can be delivered and systems changed without a single line of code being written, through the concept of codeless changes, which include any changes to a software product that don’t require a developer to write code. Generally, these changes are requested to enable a particular stakeholder to get more value out of a software product. When broadened to the general case, these changes may even result in an entirely new business model.

However, with the current code change-based KPIs, moving from code changes to codeless changes can depress KPI measures of performance by decreasing the measured rate of code change. Additionally, moving the easiest and most familiar code changes to codeless processes means that changes accomplished by altering code are trickier and more substantial, which could increase defects per change — and also depress KPIs.

Codeless Change Maturity Model

Non-code changes are less discrete and harder to measure than changes to code, especially since some codeless changes are fully automated. Therefore, instead of a KPI-based metric, I am proposing a codeless change maturity model. This model looks at business processes and evaluates whether software development or other processes are making changes that deliver value.

We’ll follow a particular business process, business intelligence (BI) metrics monitoring, to see how it takes shape through the maturity model.

Hands-On Change

The basic codeless change maturity

This is the most basic maturity level, where business processes start. At this level, R&D knows little to nothing about the business process and the changes it requires. Every change is a new user requirement delivered by the business owner and must be evaluated and implemented using the “generic” software development life cycle (SDLC). In our example, this would be represented by the engineering team building the first BI dashboard for a stakeholder.

Hand-Crafting a Process

Hand-Crafting a Process

At this level, R&D has had multiple change requests from users to implement similar business processes. The requirement will still be delivered to the business owner, who has some experience in estimating and defining it. The change will be implemented by the R&D team, perhaps using tools and techniques they have adopted to make these specific sorts of changes without having to write lots of new code. When the engineering team builds the tenth BI dashboard, they may already have informal processes for building it.

To mature to this level, a company should be asking:

  • Is this user request similar to the ones we’ve had before?
  • Can we create any processes or tools to make this change faster?

R&D Hand-Off

R&D Hand-Off

At this level, the organization has defined a class of codeless changes as a routine part of doing business. There’s a defined use case to which this process should be applied, and a specific way to request the change. This change will often be supported using a formal set of tools and techniques, usually enabling changes to be performed outside of the SDLC. Having a formal process means that these changes can be carried out by technical personnel who are not part of the R&D team, such as a professional services team or integration partners. For our example, this could be BI dashboards that are built by an analyst rather than a developer, and relying on raw information exported to a data warehouse.

To mature to this level, a company should be asking:

Should we create a formal process for customers to request the change?
Are we prepared to spend the money and time to create tools and methods so that non-developers can make the change?
Given that more users will request the change once they know it’s possible, do we have the necessary staff time?

‘All Hands’ (DIY)

‘All Hands’ (DIY)

At this level of maturity, the organization has not only defined a class of changes but has implemented a process allowing end-users to make the changes by themselves. The change needs to be very rigidly defined so it can be easily distributed to a large number of people. The UX is central to this level of maturity. It must not only be possible to make the change but also easy for the end-user to do so.

A self-service BI tool that allows all stakeholders to create and share their own dashboards would be a good example of this type of end-user change. It’s also a good, real-world example of the importance of the UX; there are a lot of confusing and badly-designed dashboard tools out there, and they make it hard for end-users to make the changes they need, on their own!

  • Not every change should be handed to end-users in this way. To mature to this level, a company should be asking:
  • Is the change defined narrowly and simply enough to allow the end-user to make it?
  • Can the end-user possibly break anything by making the change?
  • Is the change requested often enough to justify the time and expense of developing user-facing software to handle it?
  • Will giving users control of the change limit future development possibilities?

Hands-Free (automation)

At this level, the organization has built a system that’s capable of modifying its behavior to meet individual users’ needs. Machine learning is often used to provide this level of flexibility but it can also be achieved using simple rulesets

To mature to this level, a company should be asking:

  • Is the change something that users would want to be automated?
  • Will automation feel ‘creepy’ or intrusive?
  • Are we prepared to provide ongoing product support for an automated feature?
  • Do we want to provide users with the ability to manually override the automation?

Bottom Line

Measuring code change for code change’s own sake can sometimes incentivize developers to take on the ‘easy’ tasks that really should be taken out of code altogether. Businesses need to move beyond the standard DevOps KPIs and properly assess and value codeless changes, too. This means measuring how development teams are advancing along this maturity model alongside the classic KPIs.

Modern software engineering focuses on delivering value to the parent organization, so it’s important for software companies to understand the business needs that require changes to be made. If we can pinpoint where change is most required and ask ourselves the questions above, we can advance more quickly through the change maturity model, with less coding and faster, easier and safer delivery of value.

Illustrations by Ortal Avraham

This article was originally published on TheNewStack

Rookout Sandbox

No registration needed

Play Now

Table of Contents
Get the latest news

How To Become A Kickass Dev Manager In 2021

Elad Uzan | Solution Engineer

8 minutes

Table of Contents

As all dev managers, including ourselves, have witnessed, the last few years have been characterized by unprecedented and rapid technological advances. Due to this, there has been a fundamental change in the way applications are being developed. The software world as we knew it shifted from monolithic app development to new methods such as microservices architectures, cloud functions, and distributed systems that are faster and more agile. These, and other similar processes, have accelerated the speed of development, fundamentally changing the way applications are developed and communicate with each other.

While this evolution has brought a myriad of advantages – such as creating new businesses, new capabilities, and even helped organizations to produce more value – there are still significant challenges that come with managing this change and the developers that have created and maintained it.

Being a dev manager is a challenge in and of itself, but when it comes to managing developers? That’s a whole different ball game. Not only do you need to be able to handle a wide area of skills in a dynamic environment, but you also need to be responsible for a variety of applications and resources and have the ability to manage strong personalities. As if that weren’t enough to deal with, the job also includes day-to-day management like task planning and prioritization, development cycle management, versions publishing, bug management, meetings, and so on and so forth. It’s kind of a very long list.

So, with all of these challenges, how do you ensure that your devs are being their best dev selves? Well, apart from the right tools, a lot of their success lies in their having a great manager. And having a great manager? That part lies with you. In honor of the new year, we’ve put together three key action items that we’ve found the best dev managers do. So grab that glass of champagne and sip away as we cheer on being the most kickass dev manager of 2021!

Invest in your team

‍Establishing a relationship with and gaining the trust of the engineers you’re managing is a key way to establish yourself as a successful dev manager. As with everything good in life- much like a plant- your team needs to be cared for and nurtured. Or in this case, invested in.

Without a team that’s willing to listen to you, not only will you not be able to get anything done, but you’ll also lose your developers. Because let’s face it- who would want to stay in an environment they’re not happy in?

So how do you establish this relationship in actuality and ensure that your team is operating at their best?

Start off by making sure that you invest time in identifying bottlenecks that are affecting your team. This clears obstacles in their way and makes sure that they have the most advanced arsenal of tools available to them. This helps to win their trust and when your team trusts you to take care of them, together you’ll be able to achieve much more. This type of investment always pays off.

Once the bottlenecks have been identified, take a deeper look at your devs’ tools. Arming the team with great tools will place you as a tech leader that pushes for innovation. Using the best tools has many positive impacts. These can range from your devs avoiding frustration,  becoming more efficient, solving issues faster, all of which translates to higher productivity levels.

Try asking yourself: can I give up on my current tools or processes (such as CI/CD pipelines or advanced monitoring tools) and still be able to do the job? In most cases, the answer is a resounding YES. But, if we’re going to be honest with ourselves, you won’t actually end up doing that. These processes and tools save you time, effort, money, and ultimately make your team perform significantly better.

Using the right tools is not just an investment for the developers you’re managing, it’s also an investment for you. While that may seem contrary, it’s because managers always need to find the ‘sweet spot’ between bugs and new product features. Fixing bugs makes your customer happier, but it’s also slowing down your team from writing more code to enhance the product features, and you as a manager need to perfectly balance between them.

How to find the sweet spot

‍Thinking about debugging microservices or cloud functions in production environments always makes me think about one of the things that excites me the most: fighter jets. A fighter jet has many moving parts and systems that need to work together in real-time in order for it to be able to fly. When there is a malfunction in mid-air, the pilot has to be able to understand the root of the problem in the shortest possible time, all while the plane is in the air in the middle of a crisis. Sounds terrifying? It is. And software debugging really isn’t so different. It’s a complex and hard to scale process, especially when done in restricted environments, such as production.

In the upcoming year, with all these flying components, your developers are the pilots that need to be able to pinpoint an issue as quickly as possible with the least amount of effort, all while their code is in flight (or running live, to use the precise terminology). For example, in case your team faces a code related issue, live debugging is exactly what you need. Live debugging the platform that has the bug can save a significant amount of hours for your team by minimizing the time spent on code changes, rebuilding, and going through CI/CD just to get more data.

Yet, all of this is just the tip of the iceberg. Live debugging can also allow you to generate logs on the fly if needed, thus meaning that your developers won’t need to try and reproduce that issue elsewhere.

As a manager, you’ll often find yourself facing the dilemma of how much time to invest in resolving bugs and how much to keep for new features. It is clear that while new features generate new value, bug fixes preserve what you already have. Deciding between them is always difficult and a decision that you’ll find yourself needing to make on a daily basis.

Fixing bugs faster means money being saved and more time being freed. This then translates to your team having the ability to take on new tasks that create more business impact, such as new product features. And all of that together leads to more value for your organization.

The bottom line is that when your devs are using the right tools, you won’t have to make the difficult choices of choosing one or the other. Contrary to what you’ve been told your whole life, you can actually have your cake and eat it too.

Give them better visibility for better understandability

Oftentimes engineers lack the data necessary to understand what’s happening in their code and don’t have a simple method to get that data. They frequently find themselves at a crossroads, faced with the dilemma: do I develop the task ahead of me with the information I already have, or do I develop a feature that will get me more data? This is just one of the many dilemmas and challenges that software engineers face daily, and as a manager, you’ll need to find the solution.

This is where software understandability comes into play. Essentially, it means that an application can be effortlessly understood by developers, whether it’s those who created it or those who join along the way. This is achieved when developers at all levels are able to make updates to it in a way that is safe, clear, and predictable.

Understanding your remote environment is very important, and it’s very different from local environments. If you attempt to do so by closing your eyes and walking blind, you’ll find it is quite difficult. Deploying an app to a remote environment is one of those times that developers are faced with this choice and are in need of understandability. They are giving up on some senses – such as their debugger – and use other ones – like metrics, monitoring, and logs – to gain some understanding of what is going on. However, in actuality, none of these capabilities really gives them visibility into how their code is doing while everything looks like working.

As a dev manager, it’s important that you help your developers reach this fundamental level of understanding of how the whole app is performing. This means that they’ll understand how each part (i.e. function, a specific line of code) works and are able to figure out issues before they happen.

Live debugging will not only make it easier to debug an app when an issue occurs, but will also allow you to routinely analyze the application and understand it’s behavior. By incorporating this into your pipeline, you’ll ensure that your team isn’t moving blindly through their code.

Don’t Manage. Lead.

‍Managing a team of developers has very little to do with dealing with coding and much more about dealing with, well, basically everything else. As a manager, you have the ability to push your team forward by using the right tools and being a tech leader. Pushing for innovation always creates better processes, improves efficiency and velocity, and keeps your team at the forefront of technology. When you look back, you will see all the changes you made and all the tools you added for your team and will see how they improved their productivity and the quality of their work. As a leader, always remember that leaders create great developers and great developers build great products.

So no matter which choice you make, always make sure that your devs are the top priority. Wishing you a happy new year from us and looking forward to seeing what this new year brings you, dev manager-style 😉

Rookout Sandbox

No registration needed

Play Now

Table of Contents
Get the latest news

A Window of Opportunity: How Windowing Saved Our Data Table

Tal Koren

7 minutes

Table of Contents

The modern age of web development that includes modularized, encapsulated web components, has brought us a plethora of tools, technologies, frameworks, and libraries of all varieties. With every such tool that is created to simplify our lives as developers in the long run, there’s also a catch we sometimes neglect to consider: the cost of maintenance and performance.

In the Rookout app (built with React), we have a list containing a potentially unlimited amount of messages which are fetched using a GraphQL subscription. Essentially, every time you place a Non-Breaking Breakpoint in your code and trigger that breakpoint, a message row is displayed, which includes 3 component cells:

  1. The time of the message arrival
  2. The filename the breakpoint is in
  3. The message log line

For this table, react-table v6 has been used since Rookout was initially built. Since users can place breakpoints almost anywhere, a single breakpoint can be triggered multiple times per second. This causes our GraphQL service to push new data to our table, which results in many rendering operations being queued by React at once.

We’ve known for quite a while that something in our table wasn’t as performant as it could be, but there were other more pressing issues and tasks that were prioritized at the time. However, we have lately come to the realization that the time has come to resolve this issue for good.

To illustrate the problem and how it manifests itself, here’s a visualization of how it performed prior to fixing it. This occurred when scrolling and while new messages were being received (note the laggy UI and the FPS meter, specifically at the FPS count).


Finding the cause

In the months prior to dealing with it, I personally attributed the sluggishness to the fact that our table was rendering way too many items at once and realized that windowing might just be the solution to all our problems. However, I wanted to cover all plausible reasons for this performance hit, to ensure that I didn’t hit the nail just because I had a hammer in my hand.

“If all you have is a hammer, everything looks like a nail.” ~Abraham Maslow, The Psychology of Science

And so the investigation began. I took a few days to try different approaches, such as:

  • Using why-did-you-render to determine if any excess re-renders are happening
  • Using some of React’s memoization techniques, namely the memo top-level API, the useCallback and useMemo hooks, and reading about knowing when to use which
  • Profiling the app using the React Developer Tools extension and trying to figure out where the bottleneck is
  • Reading a lot about memoization, with and without relation to React, including gotchas, common misconceptions, and more
  • Giving react-virtualized a try to see if its windowing mechanism solves the problem (spoiler alert: it did)

Eventually, I came to the conclusion that I had been right from the get-go. Although there were indeed some excess re-renders happening, they weren’t the root of the issue, and the problem persisted even though I fixed them. The root of the issue was the fact that we’ve been rendering countless amount of rows, each including 3 components, which themselves contain more components.


What are the options?

I knew two things for certain. The first was that we needed to leverage the windowing concept to solve our problem. The second was that we needed to find a solution that supports the current functionality we have in our table (sorting, filtering, column resizing, and row expansion).

If you’re not familiar with the concept of windowing, otherwise known as Virtualization, it basically means rendering only what the user actually sees, thus saving resources in re-renders (since there are fewer components to render). Here’s a visualization of this, taken from web.dev’s excellent post about the subject.


After working my way through a bit of research, I ended up with two popular libraries that can be used for showing data in a list or a tabular format, while leveraging windowing for better performance.

The first option is react-virtualized, which was created by Brian Vaughn, who happens to be a React core team member. Virtualized supports windowing out of the box and provides a big selection of components to help you deal with a variety of use cases, including handling tables, grids, masonry layouts, and more. It’s a robust library that does a lot and does it well.

The second option is react-table in its newest version (7), by Tanner Linsley. Unlike version 6 it supports windowing using react-window, as well as filtering and sorting out of the box. Also, it includes a change in philosophy as opposed to v.6: it is not at all opinionated about how you structure or design your table. With the clever use of the library’s custom hooks, you can have your table look however you want, while creating custom interactions, using the library’s sorting and filtering mechanisms.

The big selling points of react-table had to do with its support for expanded rows, filtering, sorting and column resizing functionalities. Similar functionalities are possible in react-virtualized as well, though they do require custom code that wouldn’t be needed with react-table. Another point in its favor was the fact that react-table uses react-window as a means to handle windowing. React-window is another library created by Brian Vaughn, which was created as a leaner alternative to react-virtualized. It takes fewer resources and actual bundle size by supporting windowing with fewer additional components to handle specific use cases. It is the de-facto solution to most excessive rendering happening in lists and tables in modern apps.

Cracking the case

Eventually, after making sure that the team agreed and had no objections, we went with react-table and react-window. The migration took a while since some new code was required, along with studying the react-window, react-virtualized, and react-table ecosystems, as well as their respective components. Since our UI includes a lot of custom interactions and behavior, like components that need to re-render based on a debounced resizing event of the split pane in which the table resides, among other things, it definitely wasn’t a walk in the park but was without a doubt very worth it.

The results of using react-window and react-table, compared to before, are amazing (seriously- I’m not kidding) and stay the same regardless of how many messages there are (again, look at the less-laggy UI and the FPS meter, specifically the FPS count!).


Bonus: A Crazy Little Thing Called Memoization

Getting to know memoization in React better is probably the greatest lesson I’ve gained from this, apart from realizing how awesome the concept of windowing is and actually putting it to use.

React-table takes memoization very seriously and uses it heavily to optimize its behavior. When I first started to research what was driving our frontend crazy, I used useMemo in several places to try and squeeze a little more out of react-table v7. Then, when I wanted to pass a second dependency to useMemo’s dependency array, I noticed that for some reason it gets ignored.

After some investigation, it turned out that it happens because useMemo keeps so much data in its cache, that React sometimes clears it, making things go south.

This made me remove most useMemo calls in this component and stay solely with the one that’s crucial for react-table’s instantiation: the columns declaration.

When optimizing performance, regardless of whether it’s a list component or an actual piece of arbitrary code, make sure to only memoize what matters. And remember! Every optimization comes with a cost.


Summing up

React-window and react-table are two pieces of amazing software. They power complex lists and tables for web applications all over in a beautiful and efficient way.

The Front End codebase of Rookout is complex and contains many moving parts. Just like any other startup, sometimes certain goals, features, or bug fixes are of more importance than others. It’s near impossible to get everything you want done, so make sure that you are able to distinguish between those that you must have and those that are nice to have.

The challenge we faced was the result of early adoption of an older version of react-table. As you know: the more users you have, the more use cases (and possibly bugs) you encounter. Some of those use cases are more performance-heavy than others and eventually you come to a point where you have to take care of them and make them better both for your users’ and your own sake.

In case you were wondering about which windowing solution fits your scenario best or how much actual value it can potentially have, well, here you have it! In a list containing an unlimited amount of items, each containing nested components of its own, react-table + react-window are our absolute favorites. Now we can move on to solve yet another problem and help our users solve theirs. 🙂


Rookout Sandbox

No registration needed

Play Now

Table of Contents
Get the latest news

Happy Developers: Navigators Of The Data Age

Or Weis | Co-Founder

7 minutes

Table of Contents


In the age of discovery, navigators changed the world. Their unique skills won them fame, riches, and glory, as well as the ears and support of kings and emperors.
The rulers of old who knew the importance of investing in these skilled frontier men rewarded their nations with the longest and wealthiest golden ages they’d ever seen. Nowadays, in the age of data, developers are the new navigators. Their happiness is the key to the success of modern businesses and the employers and companies who understand this have the opportunity to become market leaders.

Traversing the oceans of data

Software engineers, DevOps, SREs, Data Scientists, and developers at large are the new helmsman, navigators, and cartographers. The skills developers have and their unique access to the tools of their trade is the key to solving modern problems – problems of scale, automation, AI training, complex calculation and prediction, and in general, of data manipulation. Tools were and still are a huge part of both the developer and navigator professions. While navigators had the sextant, star charts, kamals, compasses, and containers, developers have an even more impressive list of tools such as IDEs, compilers, CI/CD, ML/AI models, Programming languages, cloud-services, serverless, Istio, Kubernetes, and containers, to name just a few.

As you’ve probably noticed “containers” repeat on both lists, and indeed developers have named much of their modern tools after maritime namesakes. The same is true for Kubernetes (‘Helmsman’ in Greek), Istio (‘sail’ in Greek), and many more. When surveying modern software projects, it quickly becomes apparent that the required toolchain is constantly growing, and hence the know-how and efforts that are required from developers are constantly growing as well. Of course, there is no doubt that without both the tools and developers organizations wouldn’t be able to approach, let alone traverse, the oceans of data.

The importance of quality data

Data is not the new gold or oil, it’s the new oxygen. Every part of the modern business needs it, ranging from sales to marketing to product, all the way through security, data science, and of course to engineering itself. However, the pursuit and effort to obtain data is not about blindly collecting, as opposed to what some vendors of big-data solutions might be claiming. Data is about quality before quantity. Each voyage is about getting to the right data at the right time and how to derive the right products from it. You don’t want to drown in data, you want to swim in it. As historian Yuval Noah Harari put it in his bestselling book Homo Deus: A History of Tomorrow: “In ancient times having power meant having access to data. Today having power means knowing what to ignore.”


Looking at data science really highlights this fact. The better data scientists are able to label and curate their data sets, the better outcome they can achieve. While more flexibility is afforded with deep learning, the quality of data still remains pivotal. Quality, as with many other aspects of life, translates to not only skill, but motivation and guidance. The ability to see the new frontier that can be obtained beyond the veils of data at the horizon, is directly linked to the creativity, freedom, and ability to persevere through obstacles. If we boil all these parameters down to a key one- happiness would be it. We need our developers happy.

Developers – You need them happy

The basic fact is that in order to truly succeed at their jobs at the level you would need to spark a golden age, your developers have to be happy and motivated. Just like their discovery age counterparts, good developers are hard to find and so it becomes a simple matter of supply and demand. If you want to get this supply, you better listen to their demands. It is currently estimated that by 2021 US companies will be experiencing a shortage of 1.4 million software developers to fill positions.
So how do we make developers happy?

Top causes of dev unhappiness

Before we can discuss how to make developers happy, we need to delve into the root of the issue and understand the cause of their unhappiness. According to the article “On the Unhappiness of Software Developers”, the way to foster happiness is to limit unhappiness. Yes, agreed, this seems quite evident. So what exactly makes these developers, these people who are standing at the helm of the future of technology, unhappy? 10 key causes were found to be the source. The first three originate from the software developer’s own being. This was found in instances when devs were stuck solving a problem, felt their skills and/or knowledge were inadequate, and when experiencing personal issues. The other seven causes are produced by external causes, such as colleagues underperforming, unexplained broken code, and bad decisions. As we can see, much of their unhappiness stems from sources directly relating to their job. So, how can we, with this knowledge, flip it to benefit our devs?


What makes developers happy

The following is a list of key concepts companies can adopt to improve developer wellness and happiness. The list focuses on the unique aspects that are relevant for developers, taking into account you are already doing your best to take care of their happiness as people first.


  • Reduce context switches:
  • Context switches are interruptions to the workflow that require devs to shift attention from one task to the other. When CPU running software performs context switches it hurts performance. When people do it – it hurts performance and happiness.
    Most developers know that in order to truly get the job done right one needs to get “into the zone”, a focused deep thinking state of mind. Context-switches are the death of that.
  • This can be achieved via methods like:
  • Planning a supportive schedule that doesn’t burden developers with meetings and concentrates blocks of sequential work in which developers can get into their zone.
  • Creating a quiet and supportive environment and culture.
  • Investing in high-quality workstation gear – desks, screens, mice, keyboards, and possibly most important: good noise-reducing head-phones.
  • Investing in tools that streamline dev work – such as IDEs (e.g. JetBrains), or productivity apps (e.g. Alfred)
  • Improve software knowledge and understanding – allocate time for learning:
    You need to understand the great professional pressure devs are constantly under; that developer work constantly requires devs to learn and relearn topics and technologies as new methods, solutions, and technology, in general, is constantly rushing forward. From this understanding, you can come to elevate the pressure and help your devs invest the time they need to remain up to date, both personally as professionals and, more specifically, as engineers combating technical debt for your organization.
  • Make resolving issues easy and blame-free:
    Like a car, which is only truly tested when the rubber hits the road; software is only truly tested when it meets reality and production workloads. This makes testing, debugging, and handling incidents both difficult and extremely stressful. True developer agility is gained with a focus on quick iteration, learning, and improvement. This requires an enabling culture, one that values learning over blaming. In addition, investing in infrastructure and tools that enable agility in these processes: modern APM (e.g. AppDynamics, Datadog), exception management  (e.g. Sentry),  and production debugging (e.g. Rookout) can dramatically reduce friction, as well as save your devs a lot of time.
  • Make communication between devs and the rest of the org easy:
  • Developers have their own ways of communication, on average somewhat more introverted, sarcastic, critical, and of course technological. Embrace it- and encourage them and the rest of your organization to communicate. If your devs aren’t invested in your business goals; don’t be surprised when they fail to be motivated by them and ultimately fail to deliver for them.
  • Developer excellence: As a theme developer excellence or wellness is becoming something companies are putting emphasis on, even hiring key personnel to lead this focus, in some cases VP and C-Level. While not a magic cure-all, this is a good strategy to communicate how important the wellbeing of developers is and allocate mind-share, time, and resources to driving it.

The Future is Dev

Looking at human history, there are distinct ages – periods in which key roles in society lead revolutions that forever change the fate of mankind. Shamans and chieftains, philosophers, kings, renaissance-men, and most notably in the age of discovery, explorers, and navigators whose unique skills and spirit drove civilization forward, quite literally, by connecting the old world and the new world.
In this age of data, developers are taking the lead, harnessing an ever-growing arsenal of tools, constantly requiring them to learn, adapt, and perform, while the challenges are constantly growing in scale and complexity. As the problems faced grow, so do the rewards. Consequently, the companies that best support their developers and take care of their happiness, will win a new world that holds a future that’s probably beyond our wildest dreams.

Rookout Sandbox

No registration needed

Play Now