Rookout is now a part of the Dynatrace family!

Table of Contents
Get the latest news

Definitive Guide to Remote Java Debugging

Maor Rudick

15 minutes

Table of Contents

In the world of software development, there’s no such thing as writing perfect code. As such, almost every software developer ends up spending a great deal of their time debugging code. Therefore, one of the best ways to increase your efficiency as a developer is to have the ability to locate errors, identify the root cause, and fix it to resolve problems in your codebase. While debugging is very crucial to producing high-quality software, it is also one of the most challenging skills to master.

As a developer, you can always improve your understanding of debugging by using new resources and taking a logical, rational, and analytical line of attack when confronting coding problems. Additionally, you must focus on learning and adopting the most helpful and effective debugging techniques. One such technique is remote debugging, which comes in handy when developing and maintaining software in today’s progressively remote-focused world.

In this article, we will explain everything you need to know about remote debugging using Java. Before diving into more details, let’s understand what exactly remote debugging means.

What is Remote Java Debugging?

Remote Java Debugging is the process of debugging a Java program or application running on another machine or a server environment. Unlike local debugging, where you debug an application that runs on the same device as your IDE, remote debugging requires establishing a connection between the debugger and the target system.

To demonstrate this a bit better, here’s a quick refresher of the Java Platform Debugger Architecture (JPDA) by Sun Microsystems. JPDA is a multi-tier architecture through which you can debug Java applications. It comprises the Java Debug Interface (JDI), the Java Virtual Machine Tool Interface (JVMTI), and the Java Debug Wire Protocol (JDWP), as shown in this high-level architecture diagram.

Java Platform Debugger Architecture - Java Debug Interface (JDI), the Java Virtual Machine Tool Interface (JVMTI), and the Java Debug Wire Protocol (JDWP)

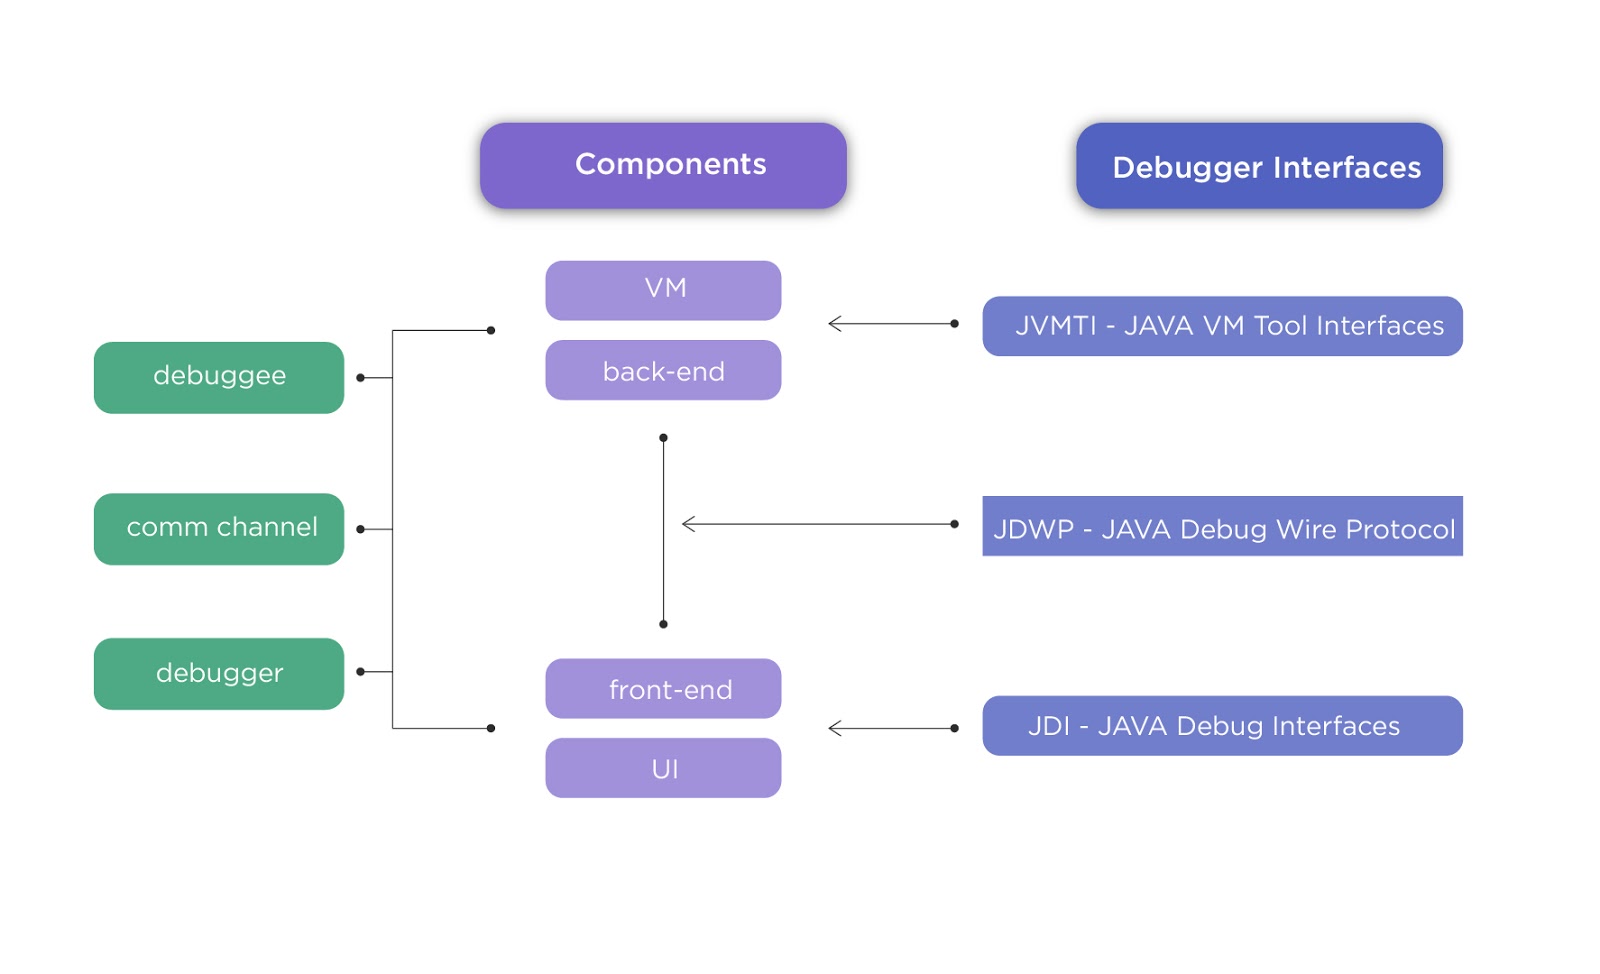
As illustrated, the Java Debug Wire Protocol (JDWP) is a protocol that contains information transmitted between the JVMTI and JDI. Once a connection is established, JDWP is used for communicating instructions between the debugger and debuggee (the application program being debugged) when performing remote debugging.

Remote Java debugging can be used to troubleshoot and fix the most common classes of bugs that Java developers run into time and again. These include:

  • Run-time errors: these are errors that occur during program execution and usually throw exceptions.
  • Logic errors: these bugs produce wrong or invalid outputs due to incorrect code implementation. However, they are different from run-time errors in that exceptions are not generated. Logic errors in Java can range from memory leaks to buffer overflow.
  • Syntactical or compilation errors: these Java errors are highly common but easy to debug since they usually result from typing mistakes.
  • Threading errors: this class of bugs constitutes the largest percentage of Java errors that every debugging tool should address. Threading bugs are usually difficult to reproduce and track down. They include deadlocks, synchronization errors, access violations, data race bugs, and more.

Why Use Remote Java Debugging

There are multiple reasons why developers may want to perform remote debugging. These include:

  1. When the target system cannot run a local debugger 

It is common for developers to encounter situations where the target system does not support a local debugger. For instance, when debugging an embedded system where attaching a debugger is difficult, you might want to debug the application remotely. The same applies to distributed applications where logging is decentralized, and replicating a bug is more complicated.

Similarly, in the event that the target system lacks enough resources, for instance, memory or CPU power, to support the running applications and a resident debugger concurrently,  you can only resort to remote debugging.

  1. When local debugging sessions interfere with other applications running on the target system

Far too often, initiating a local debugging session steps in the way of running applications. This is usually the case when the target system is interactive. Using a remote debugger that directs its output to a remote screen helps avoid this problem.

Remote debugging also comes in handy when debugging applications residing on dedicated machines such as web servers whose services cannot be shut down to allow local debugging.

  1. When you cannot access the application’s source files from the target system

When the source files for the application being debugged cannot be accessed locally, you should establish a secure connection with the host system and launch a remote debugging session. This is also the case when debugging a program that relies on live data. When the visibility of some types of bugs depends on the state of a running system, remote debugging is the best way to check into the bugs and understand how they occur. This happens often when debugging problems in a production environment.

Remote Java debugging can also be used in scenarios where the developer and target system reside in different physical locations. This results in significant time and cost savings.

As you can see, there are tons of reasons why development teams may opt to debug a Java application remotely. And the beauty in performing remote Java debugging is that it enhances collaboration among development teams and allows developers to troubleshoot code problems in modern software architecture.

How to Perform Remote Java Debugging

Various debugging platforms allow developers to debug their Java applications remotely. This includes regular IDEs that support remote debugging capabilities such as Eclipse, NetBeans, Visual Studio, and IntelliJ IDEA. So, start by choosing a Java JVM that fits into your workflow and supports remote debugging.

To debug your Java application remotely, you should follow two distinct steps. The first involves passing remote debugging arguments to JVM, and the second, configuring your IDE to allow remote debugging.

Passing remote debugging arguments to JVM

JDWP contains a wide array of command-line arguments used for debugging.  Xdebug is used to enable debugging features such as remote debugging while Xrunjdwp specifies JDWP implementation and connectivity details in the target VM. In Java V5 and subsequent releases, you use -agentlib:jdwp instead of -Xdebug and -Xrunjdwp.

To invoke a remote Java application application, you should supply the right configurations for transport, server, address, and suspend arguments, as shown below.

java -agentlib:jdwp=transport=dt_socket,server=y,suspend=n,address=127.0.0.1:8000

For Java 5 and earlier, we use the runjdwp arguments as shown below.

java -Xdebug

– Xrunjdwp_transport=dt_socket,server=y,suspend=n,address=8000

You can learn more about JVM arguments and debug settings by checking the JPDA documentation.

Configuring the IDE

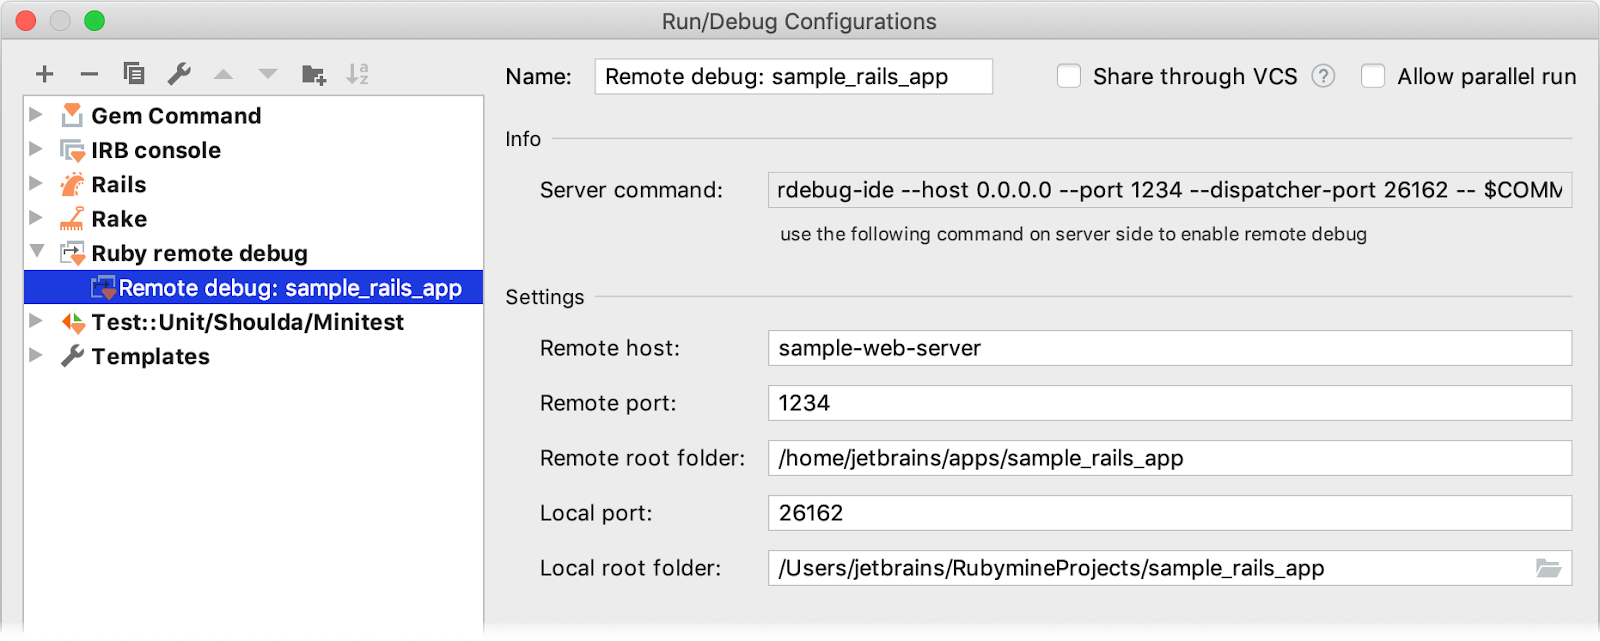
After passing remote debugging arguments to your JVM, you now need to configure your development environment to allow remote launch. Of course, the configuration steps you take will depend on the Java debugging tool you’re using.

When entering the configuration details for launching a remote debugging session, always ensure that you provide the remote machine’s correct hostname or IP address. Once done with the configuration, then you’re set for remote debugging.

Challenges of Remote Java Debugging

There are a few downsides associated with remote Java debugging. These include:

  • Security implications: when performing remote debugging, you open up specific ports to allow the debugger to access the server. This introduces a potential security risk to your system since bad actors who hit the server can also initiate debugging or perform malicious actions.
  • Performance degradation: remote debugging mode affects an application’s or server’s performance because some JVM optimizations that provide significant performance boost are usually disabled.
  • Logging concerns: some logging implementations used during debugging usually write log information to files within the application. Such solutions are not perfect because if an application crashes, there’s a chance that you might lose recent log messages. Another scenario is when log information is buried deep inside a directory that is difficult to access. Getting diagnostic information from such files can oftentimes be frustrating.

An Effective Approach to Remote Java Debugging

To debug Java applications properly, you must collect data to figure out precisely what is causing the bug. However, this can be problematic when debugging a Java application remotely and can often come with many performance caveats, as mentioned earlier.

A better remote debugging option would be using an advanced debugger like Rookout, which allows you to debug Java applications smoothly in both development and production environments. Rookout is a unique live production debugger that enables you to collect on-demand data from live code, accelerating the identification of root causes and bug resolution.

Using a tool like Rookout will streamline the remote Java debugging process in multiple ways, but these are three of the most notable ones.

Setting non-breaking breakpoints

The vast majority of Java bugs involve thread interactions. For this reason, an excellent Java debugging tool should be thread-centric to enable easier identification of bugs in multi-threaded Java applications. Unfortunately, regular IDE debuggers do not address this because, as you step through the code, you slow down the debugging process, which prevents the recreation of erroneous events.

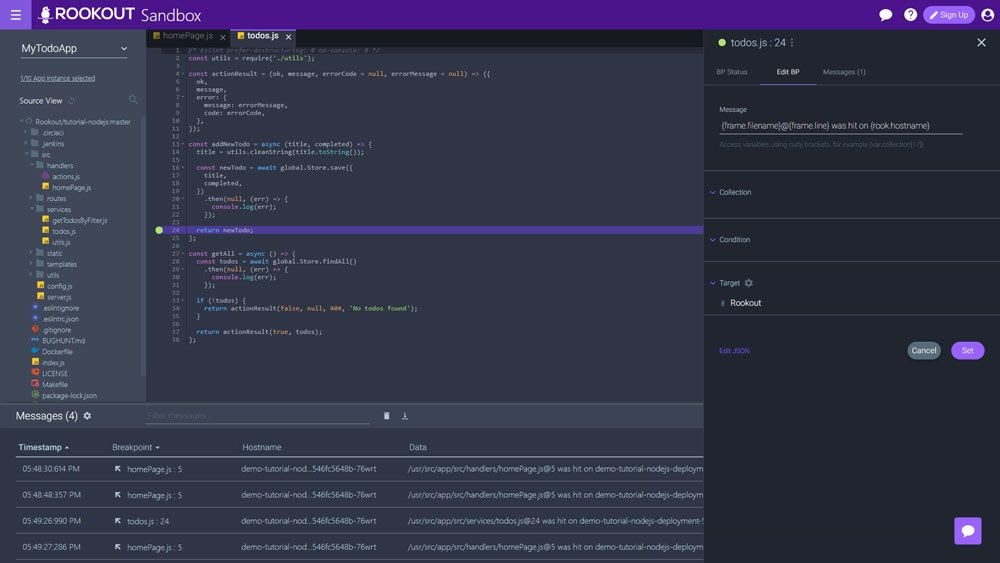
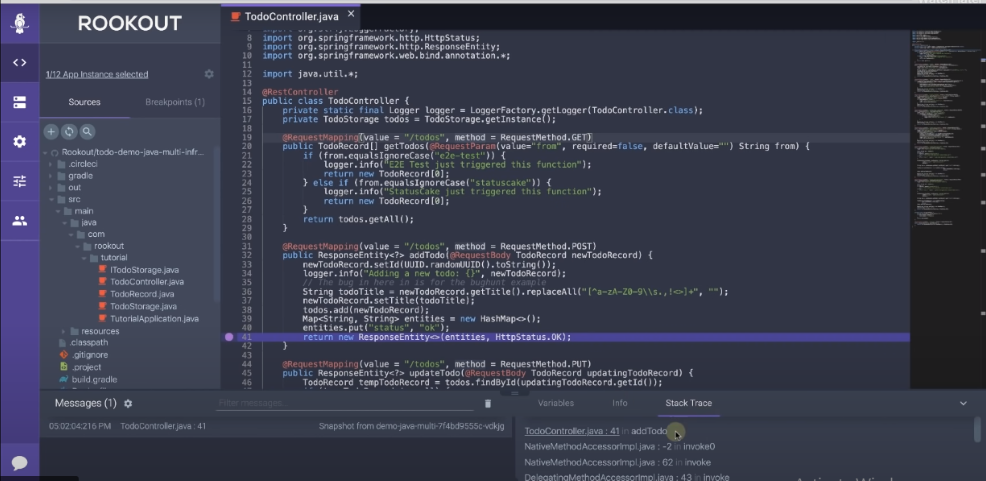
Using Rookout, you can remotely set and place non-breaking breakpoints in your Java application to inspect the full state or the live application or specific variables during execution. Non-breaking breakpoints help you identify and resolve common threading errors since they do not touch your code. This means you can get data from running code without breaking or stopping the application. This feature allows you to run remote Java debugging sessions as if you were debugging defective code locally using a classic debugger.

Here is a snapshot showing a non-breaking breakpoint set on line 41. Notice how you can inspect variables and their values, check the server, process information, and examine the stack trace on the Rookout debugger.

Rookout remote debugger - Non-breaking breakpoint

Seamless log-collection

Rookout streamlines log collection during debugging, thereby solving one of the most common pain points of remote debugging. This tool lets you extract live code data points, including logs, variables, and other metrics from your code without stopping your application, redeploying it, or writing extra code.

This allows instant observability into a running application, which speeds up root-cause analysis.

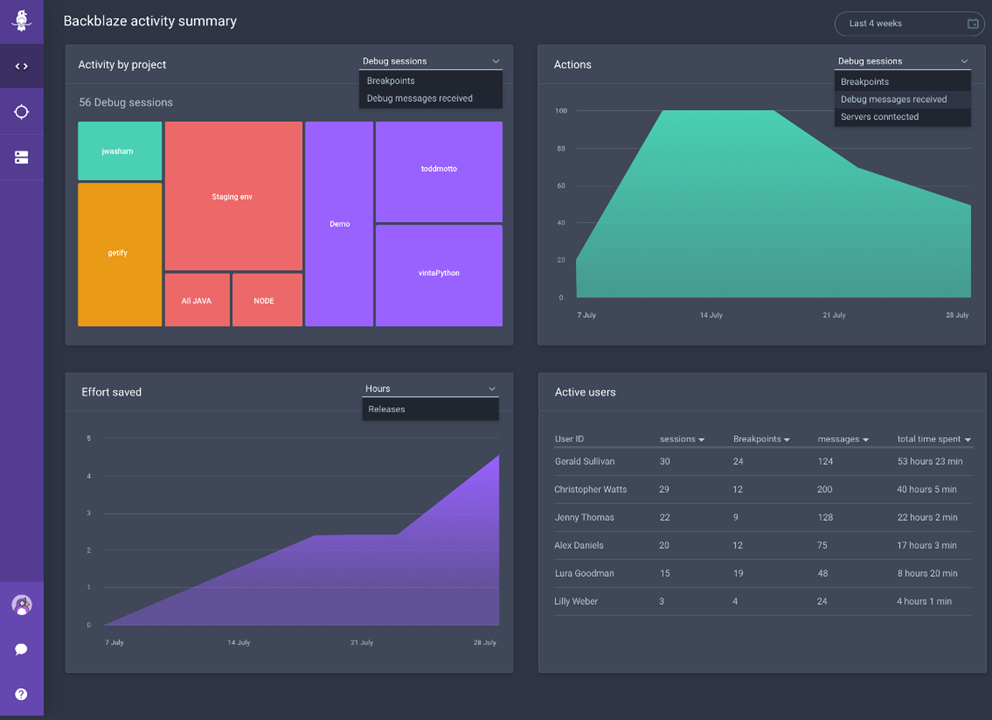
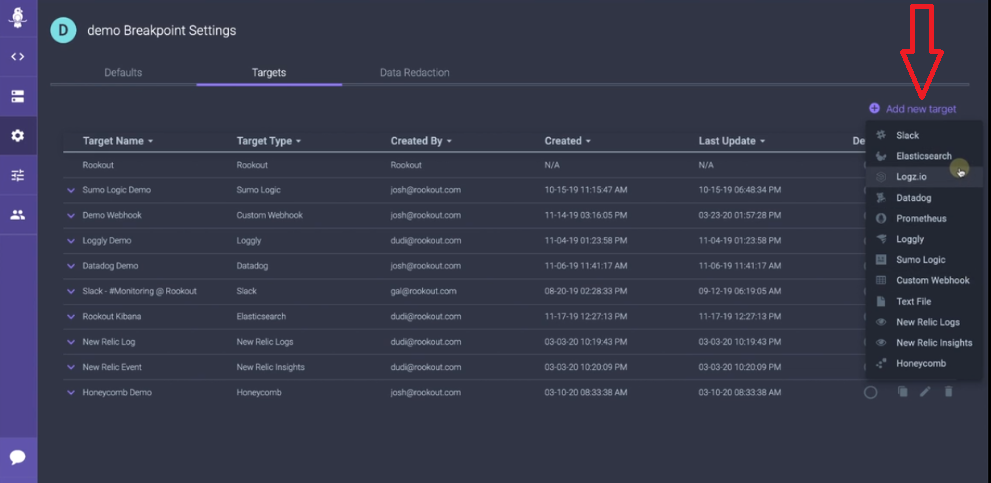
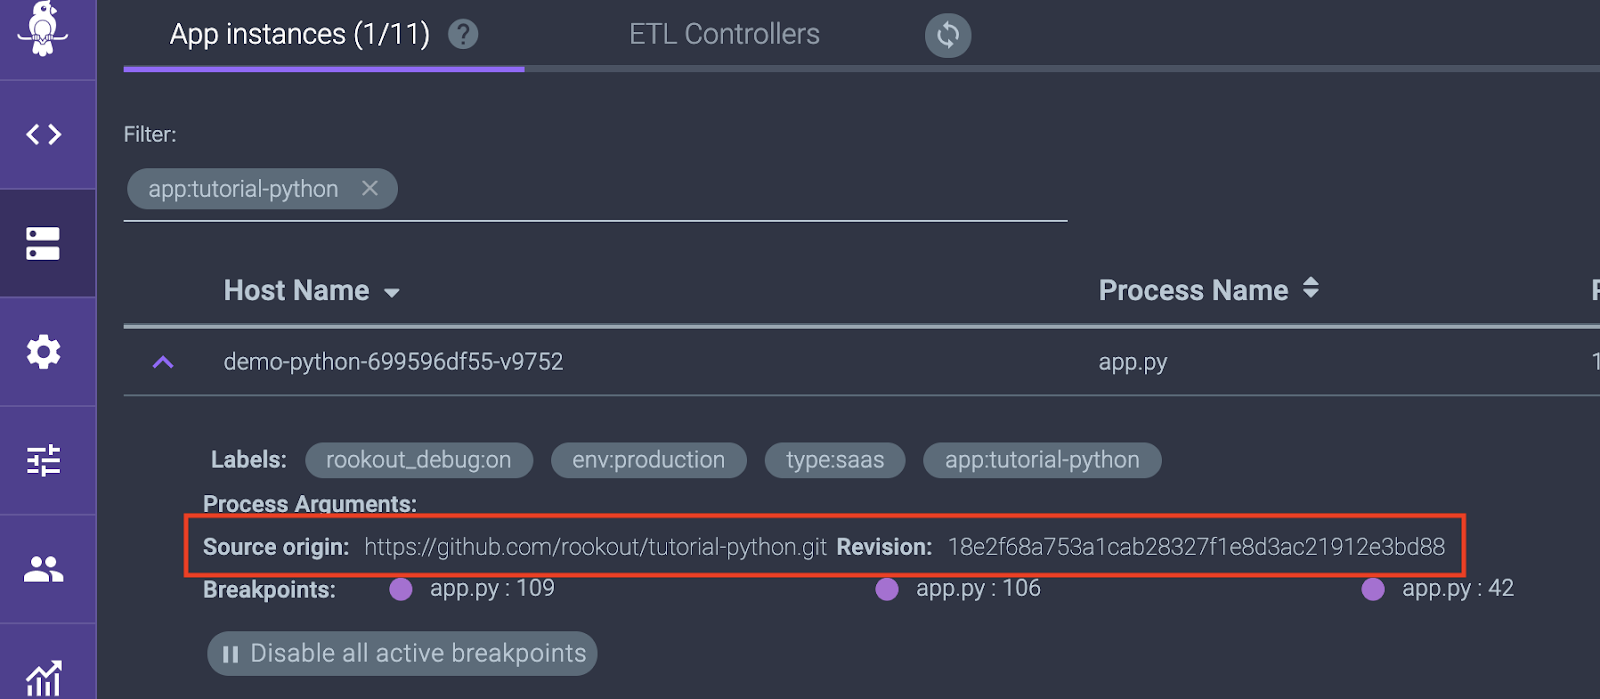
Besides fetching valuable data for debugging, Rookout allows you to export or pipeline your data to external performance monitoring, alerting, or logging solutions like Sentry or Datadog. You can see that the Rookout debugger allows you to export debugging data to a log analysis platform of your choice in the snapshot here.

export java debugging data to a log analysis platform

Enhanced team effort

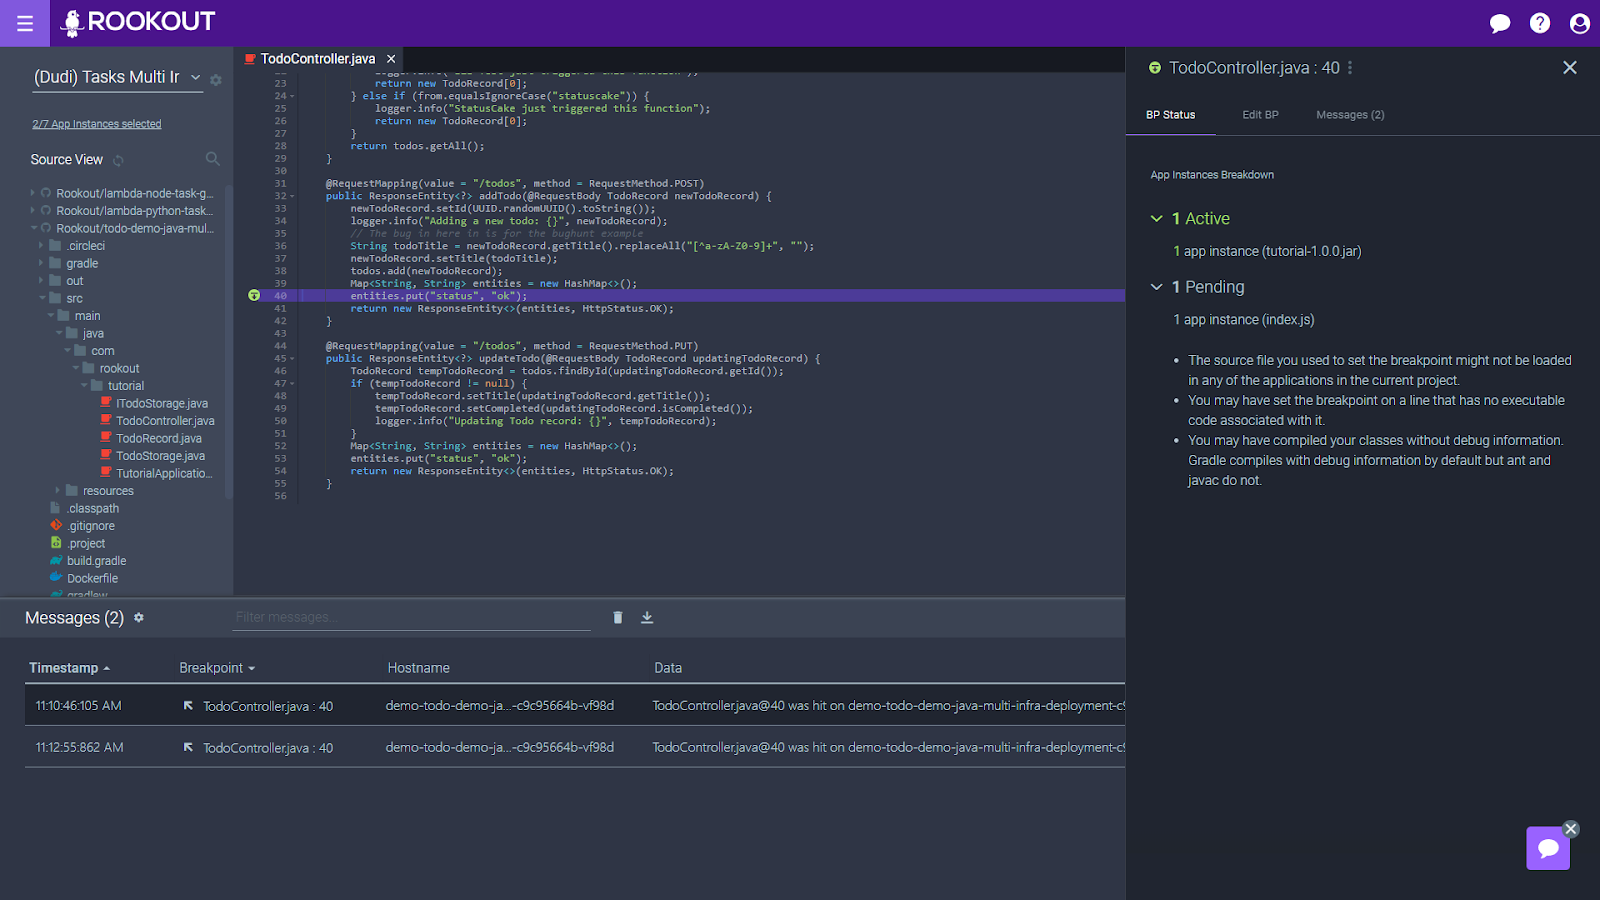
Another key benefit of using a solution like Rookout for remote debugging is that it enables developers to collaborate across support and engineering teams. Rookout focuses on conveying rich quality data containing details on software incidents and user behaviors. It also allows team members to share such detailed pictures for live debug sessions. This enhances team efforts since bug investigations are handed off with ease.

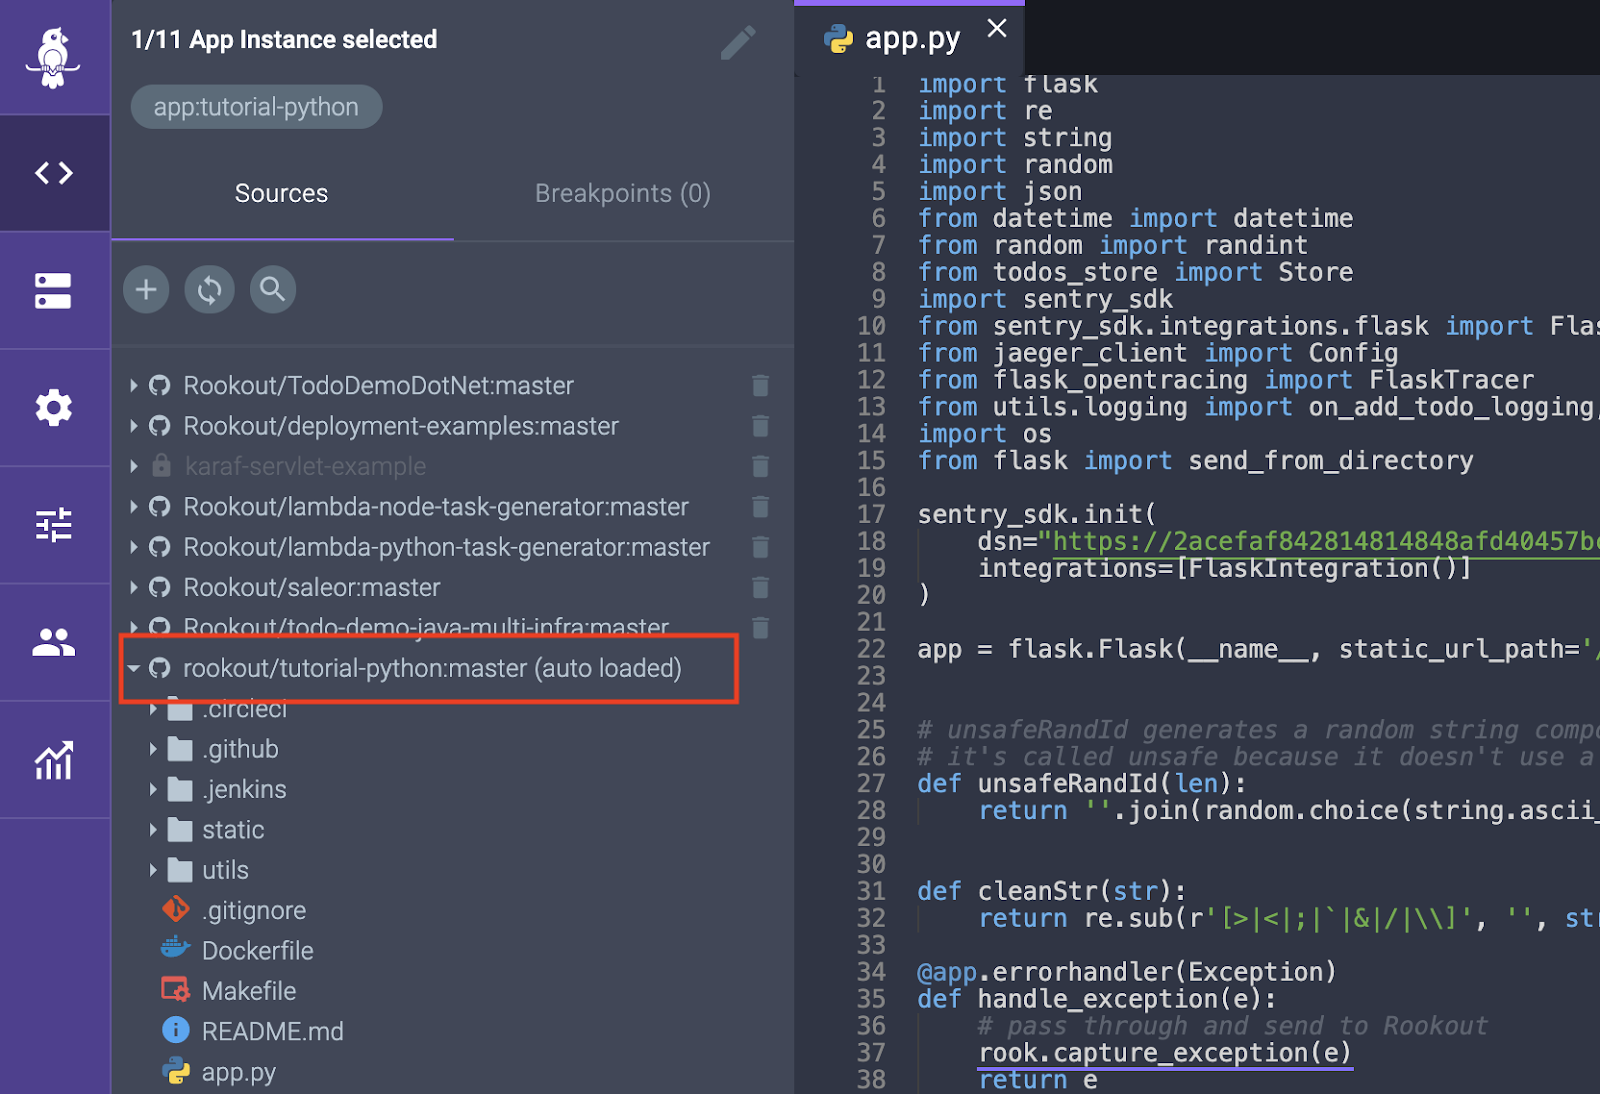
Here is a screenshot showing an example of a shareable debugging session in the Rookout debugger.

Rookout remote java debugger - shareable session

Tools like Rookout bring the much-needed agility to the modern debugging process. As remote working takes the world by storm, remote debugging becomes inevitable in our development workflow.

To facilitate smooth remote debugging, you should build an ideal Java debugging tool upon scale and distribution. This means that instead of having developers connect over a network every time they wish to debug an application, debugging platforms should provide greater control by allowing developers to debug an application component they want without struggling with debugger connections.

Rookout remote java debugger

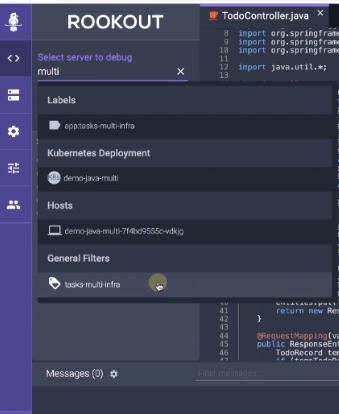
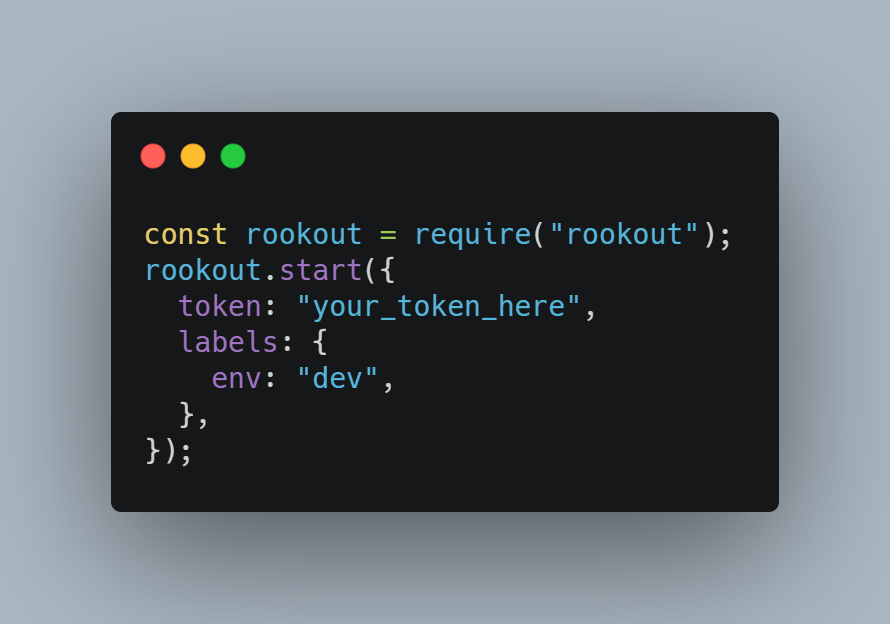
Rookout does precisely this. It saves users a lot of time spent on initial configuration for remote debugging. All you need to do is add a single line of code to your application’s entry file and any team member will be able to debug the application without additional configuration.

Best practices for Java Debugging

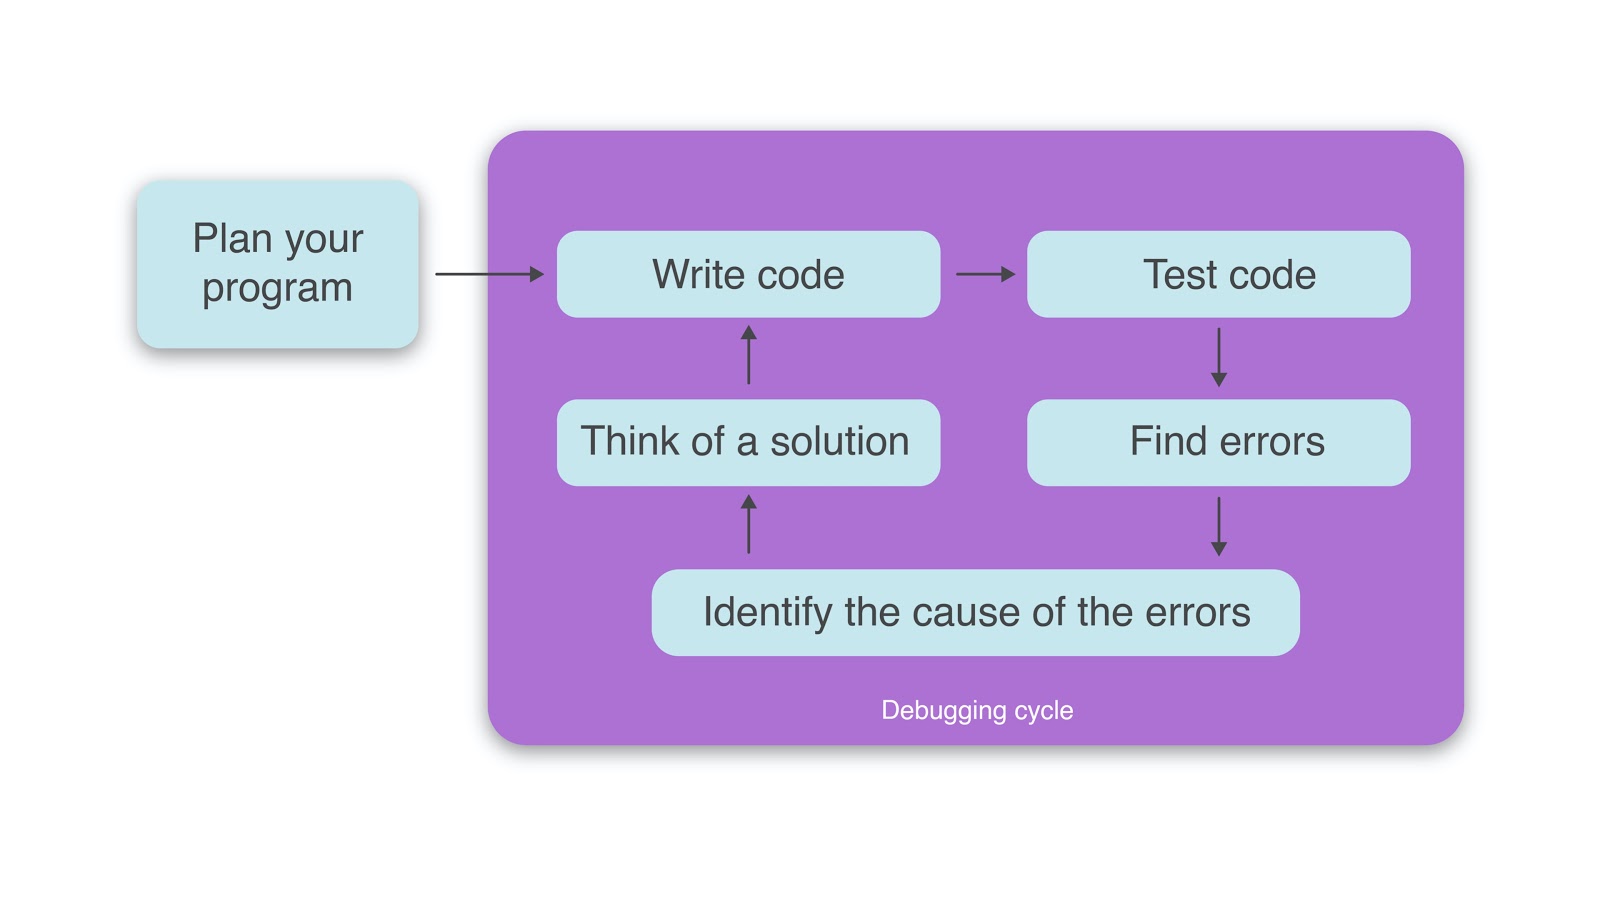
Debugging systems might seem challenging even to the most experienced coding veterans, especially when performing in a production environment. However, as a developer, you can make it easier by following the right techniques. Remember, the goal is to find the source of the problem in your Java code, determine possible causes, test out hypotheses until the actual root cause is found, and finally eliminate the causes to ensure it doesn’t happen again.

This process requires a systematic step-by-step approach, like the one shown below.

Remote java debugging approach diagram

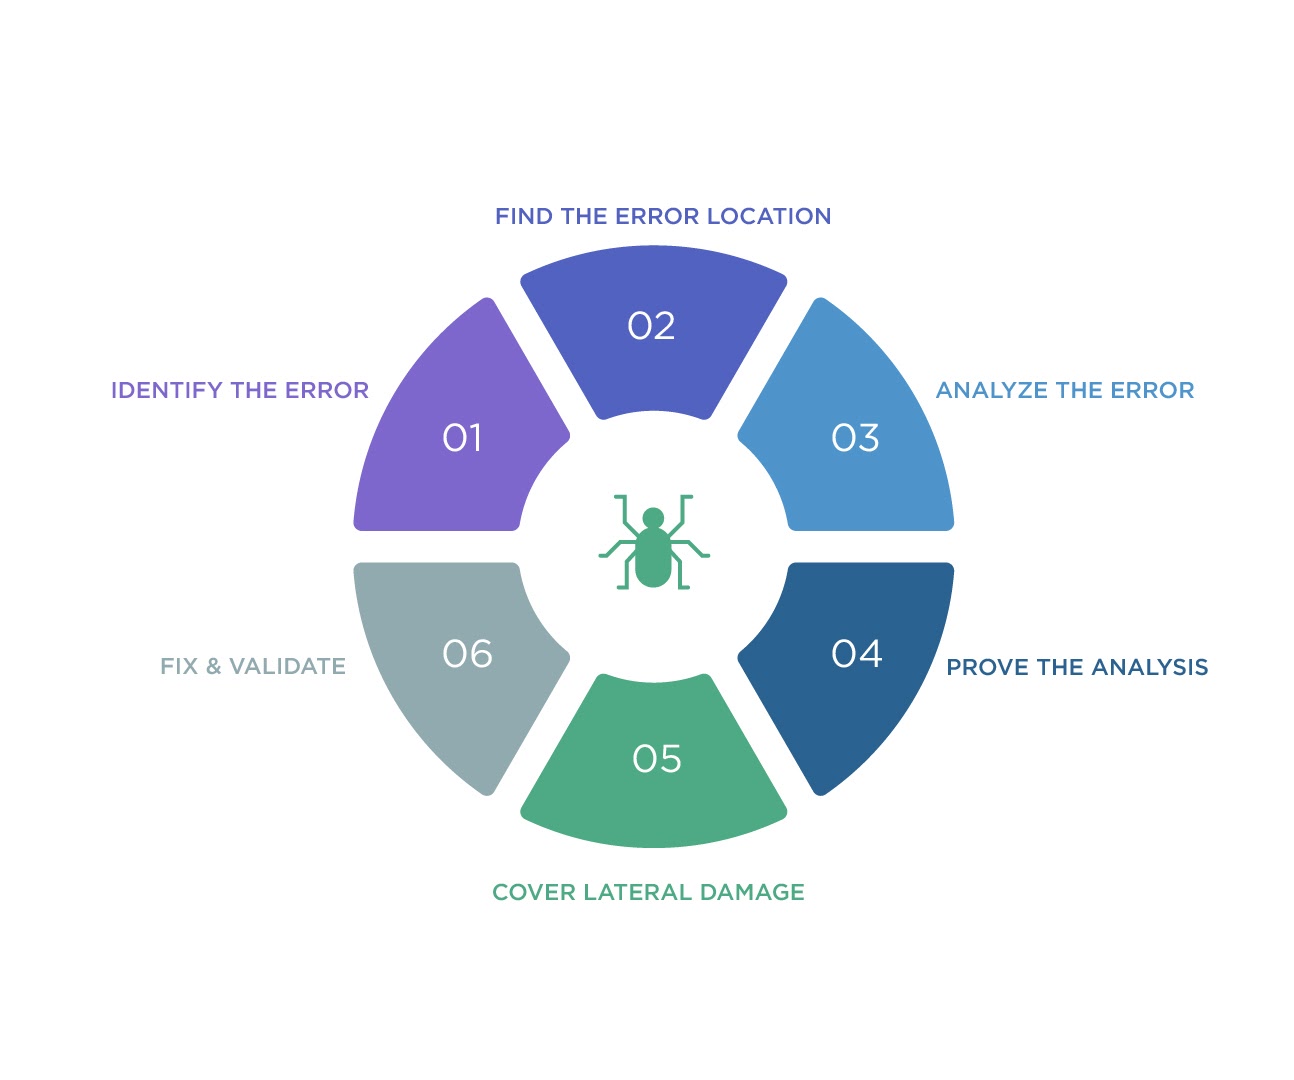
As a Java developer looking to excel in remote debugging, there are some fundamental rules that you should never neglect. This section puts together a couple of best practices essential for anyone looking to enhance their Java debugging skills and speed.

  • First, refrain from using the debugger

There’s more to debugging than fiddling around the debugger and modifying your Java code to see if it works. So, the first rule of thumb when debugging a problem is to avoid firing up the debugger.  We know the debugger can help solve virtually any problem in your codebase, but it’s not always the best place to start.

Instead, sit back and unleash the power of your mental arsenal to find the source of trouble in your codebase.  When you understand how the system works, you will realize that tons of Java bugs can be fixed without touching the debugger.

  • Reproduce the error

The easiest way to debug a problem is by recreating it. If you cannot understand the sequence of events leading to the problem, it will be almost impossible to solve it or verify that the applied fix works correctly. So, gather as much evidence as you can about the error, including all conditions leading to the problem.

If the bug in your Java code is an intermittent problem, do not claim that it cannot be replicated. Go ahead and insert a few more logging statements or non-breaking breakpoints in your code. The key is to gather as much information as possible about the problem.

After confirming that you can reproduce the problem, sit back and take a more in-depth look at the source code. See if you can get a few more clues about how the system should work. At this point, you should have a couple of hypotheses to test.

  • Test your hypotheses

Most developers resort to opening the debugger to test their hypothesis. This is an okay route to take, but not just yet. A better approach would be creating unit tests that will exploit issues in parts of the program that aren’t working correctly.

Unit tests not only help you eliminate error possibilities in your debugging journey but also provide a way of verifying that your fix worked. Another advantage of writing unit tests is that even if they fail, you will have disproved your hypotheses and added another unit test to your system, thereby making it more robust.

In situations that you cannot write unit tests to exploit an error, then it’s okay to use the debugger. However, always be deliberate about what you want to debug and have a specific reason for doing it– not merely looking around your code.

  • Validate assumptions

It is common for developers to make assumptions when debugging Java code. Instead of assuming that your code should be working in a particular manner or that the program should output certain values, stop and check if you’re on the right path.

By validating your expectations using unit tests, you will realize that every time you encounter an unexplainable bug, rarely will basic assumptions lie at the heart of the problem.

  • Apply the divide and conquer method

One of the most effective ways of expediting the debugging process is cutting down the problem to narrow your search. When the system is split into two, it becomes easier to find the range of your target. Anytime you feel stuck, divide your Java codebase into two parts and eliminate that which cannot cause your problem.

Once you take away parts of your code that cannot be responsible for the error, you can work your way through the rest and identify those components behind the bug. When doing so, remember that some bugs defend each other. So, eliminate them as soon as you find them.

  • Verify that the problem is really fixed

One last piece of advice when debugging Java code is that every time you fix a problem, always strive to understand why the fix worked. Remember, bugs do not go away by themselves, so if you can’t understand how the applied fix solves the intended problem, chances are that the bug might still be hiding.

We’re saying this because, during the course of your debugging journey, you tend to alter even the code that isn’t part of the official fix. While it is okay to have changes that do not break your code, some fixes might hide the problem. For this reason, you must always understand how your solution fixed the bug causes or erroneous compilation process. Additionally, you should consider running some regression tests to eliminate bug instances that might occur after the new build.

Conclusion

Whether you’re creating a new product or maintaining an already developed application, remote debugging comes in handy as a solution to the most prevalent debugging problems in modern software architecture. After all, bugs are an inevitable part of every programmer’s life. And like any other aspect of software development, remote debugging is an art and science that you can only excel at through constant learning and practice. So, use the tips in this article to guide you to streamline your remote Java debugging processes and remember to choose a tool that gives you the desired speed and ease in your development workflow.

References

Rookout Sandbox

No registration needed

Play Now

Table of Contents
Get the latest news

Are You Making These 3 Debugging Mistakes?

Dudi Cohen | VP R&D

8 minutes

Table of Contents

I have been managing R&D teams for the past 14 years or so and have learned many lessons along the way. Some of the best lessons have come about in the moment when your software meets the real world and you find that you need to debug remotely. Part of them were learned from my own battle scars and some were taught to me by my peers and employees. One of the most important lessons I learned – and also gave – is how to estimate time, and in accordance with that, how to answer questions about time estimations. Time estimation is difficult because R&D tasks are often very tough to predict. So, let me be more exact. Development time itself is easy to predict and research time is a bit harder, even though it can be properly scoped and limited. But when it comes to finishing with a task, ensuring there are no bugs, and that everything is working perfectly? That’s the hard part. I stopped answering the question “how long will it take to develop this feature?”. Instead I answer, “Do you want to know how much time it will take to develop it? Or do you want to know how long we’ll be fixing bugs related to it?”.

Assessing your problem solving strategy

‍Always expect the unexpected. Our true faces are usually revealed when we encounter problems. These problems will eventually arrive at the moment you write your first line of code in a new feature. When doing so, understand that somewhere out there in the dark a bug is waiting to surface. No matter how many tests and how much future proofing you’ll code in, those bugs will arrive in the end. So which strategy are you going to use when those bugs attack you? Since their arrival is inevitable, I advise that you devise your strategy in advance. The best way to build this strategy is to understand how efficient it will be, how many risks you can take, and how you can plan your tasks to handle it.

Join me in a journey down the rabbit hole that we call remote debugging as I describe three types of developers and their strategies- all to try and explain what you really shouldn’t do. Every company has one of these personalities. You can escape them when they’re around and maybe you’ve even been one of them. It’s ok, there’s no shame if you are, some of my best friends and I have sinned as one of the following personas.

1. The Code Starer

‍Your code is the absolute truth of your application. Your application doesn’t have a life of its own. It behaves the way it does because you told it what to do with your code. You gave that application specific instructions and these instructions can’t be interpreted differently. The Code Starer believes that there is one thing holy: your code.

The code doesn’t lie, and if there is a bug, the only relevant thing that can be done to solve it is to look at the code. “Let me just look at the code and I’ll find that bug”. Those are the famous last words of the Code Starer, as he goes down into his cave to stare at the code. And yes, sometimes looking at the code will give you more understanding on what the code is expected to do and what possible failures and sharp corners exist that you can stumble into. However, you or one of your colleagues have written this code and – hopefully – the code was also peer reviewed. So why would going over the code again and again and again give you a better insight?

As it is, the code isn’t the only player in this game. There is also the data being processed by your application, there are the users that make sure to create the weirdest unexpected data, and the production environment can be ever-changing. Staring at the code relentlessly and hoping that the answer will be written there is useless. Most importantly: it is very inefficient. 

When trying to solve a problem, the best way to go about it is to find out more information that you didn’t have before. Looking at the code is actually looking at information that hasn’t changed and has been there all the time. If you want to be efficient, don’t waste your time looking at the existing information that will ostensibly give you nothing new. No one wants to be a Code Starer.

2. The Reenactor

‍Do you know those guys that spent a week configuring their laptop’s IDE? It’s honestly amazing. You spend a ton of time configuring your environment and then everything that you do on your machine is magic. You’ll have a keyboard shortcut for everything, as well as a real time linter, an autocomplete auto-predictor AI that writes the code for you, and an automated script to order lunch.

Sounds magical, right? The problem is that once you get used to your own customized laptop, you really can’t work on any other mere mortal’s laptop. A similar situation can sometimes happen to The Reenactor when he encounters a bug in the wild. The Reenactor will see and admit that there is a bug in production. However, production is different than on his dev laptop. He can’t SSH into the production machine and load up his VIM configuration, because he isn’t even allowed to SSH. But he has a magical debugger, profiler, real-time code injector, and a rubber duck. The only thing that he now needs to do is to reproduce the bug and make the bug appear on his dev laptop. When that bug appears in The Reenactor’s laptop, everything will be clear as day and the bug will be squashed. And thus, the task of solving a bug becomes a one men’s quest to reproduce the bug.

That quest is now a bunch of unplanned multiple tasks – dumping user data from production and constantly retrying to perform a core dump of the right component in production at the right time. And when all of this fails, The Reenactor might try to engage the customer that encountered the bug with an investigation to collect any sort of information that will allow him to retrace that bug and make it reappear on his own terms. My advice? Don’t waste your time on reenacting. Your time is valuable. You might be able to solve your bug when it appears on your laptop, but making it appear might be wasted time that you could use to develop other features.

3. The Lumberjack

‍The Lumberjack understands that he needs more information. He has learned some lessons that the Code Starer hasn’t yet learned. When he encounters a bug in the wild, he doesn’t try to bring the bug home, but rather knows that a bug in the wild should be handled in the wild. So how does the Lumberjack collect more information about the bug?

The Lumberjack adds logs and removes logs. Placing the logs in the right place will take time, because the fact of the matter is that collecting the right piece of information will take time. Why, you ask? Well, because adding logs is writing code and deploying new code takes time (write, test, review, deploy). Sometimes adding logs might even hurt your application’s performance and this might be a conversation topic that you wouldn’t like to have with your customer.

The Lumberjack will always believe that he is one log line away from solving the bug. And sometimes when the customer is responsible for upgrading or deploying your application, you’ll hear this from the Lumberjack: “All I need is information from that log line, let’s ask the customer to upgrade one last time”. It is easy to understand that your customer’s patience might be lost. The Lumberjack’s life is a risky one with all the going back and forth with redeploying code to get more information. As a Lumberjack, you might lose your customer’s patience pretty fast.

Go Forth and Debug

I might have exaggerated slightly, but sometimes some of these strategies are valid. With this being said, you should understand that having the right tools in advance can save you a lot of time when debugging.
Simply put, don’t be a fanatic and or any of the following archetypes:

  1. Don’t be a Code Starer – Devise a strategy that collects more information and don’t delve into the information you already have. Be efficient and focus on getting more information. Understand that you might not be able to collect it in advance and plan how it will be collected.
  2. Don’t be a Reenactor – Understand that a bug in production or a bug in the real world will require different tools and a different approach. You can’t allow yourself to work endlessly and waste your time on reproducing the bug in your own comfort zone. You can’t bring the battle into your field. You will have to go ahead and face the battle where it happens.
  3. Don’t be a Lumberjack – Don’t take the risk again and again, believing that all you need is just one more piece of information. Understand that every time you redeploy and change your code, you waste time and take a risk.

The most important thing is to expect the unexpected and to build a debugging strategy that enables you and your team to be able to deal with it. The unexpected happens when you click on that “deploy” button, letting your code roam free and meet the real world.

Rookout Sandbox

No registration needed

Play Now

Table of Contents
Get the latest news

Embedding Docker Source Code Version Information

Josh Hendrick | Senior Solutions Engineer

7 minutes

Table of Contents

As organizations place focus on innovation and digital transformation across enterprise IT, we continue to see increased adoption of containers and microservice application development patterns. Containers have brought developers new levels of flexibility and portability, but oftentimes still leave developers with questions about the best way to configure and build those containers. One interesting area that comes up is around how developers can most easily embed source code version information into their images. Most development teams need a simple and easy way to do this so that they can understand exactly which source code repository and code revision were used to build the container image as it’s important for auditing and debugging purposes.

It’s not uncommon to run into developers who are slowed down in their debugging process because they are not sure which version of their code is running, or even worse (!) end up trying to debug the wrong version of their application based on the code they have loaded in their local IDE. Worry not, for we know just the way to avoid this fate. In this guide, we’ll talk briefly about the potential approaches to embedding source code version information into Docker images and then dive into detail on how embedding that information into your container will allow for quick and easy setup for on the fly debugging with Rookout.

Embedding Docker Versioning Information

Having source code version information available to your application can be beneficial. It allows for traceability back to the code repository and specific commit that your running application is using. This could be useful when debugging or even for use directly by your application during runtime for the purposes of displaying version information to your users.

One possible approach to embedding source code version information with Git based repositories is to include the .git folder along with your sources when building your image. This folder is typically a hidden folder at the root of your cloned Git repository and is used to store information about the current branch, commits, and other Git related configuration information. In a standard CI/CD workflow, the CI tool will clone the entire repository and then build an image based on the contents of the Dockerbuild or Docker compose files. When the image is built, typically the .git folder is excluded due to the fact that it can be quite large and including it could potentially slow down the build process and create issues with Docker layer caching. One nice solution is to just include a subset of the .git files that contain the most relevant information. This can be accomplished nicely by using the .dockerignore file.

Using the .dockerignore File

The .dockerignore file allows for inclusion or exclusion of specific files in the built Docker image. When the Docker image is built, files and folders that need to be used are compressed and sent to the Docker daemon from the Docker CLI. You may have specific large files or folders that you would like to exclude from this build context. In this case, the .dockerignore file comes in handy.

The .dockerignore file goes at the root of your build directory and for our purposes could look something like this:

# Files and Folders to ignore
.git
# Allow files for specific files with an !
!.git/HEAD
!.git/config
!.git/refs

In the above example, we’re first excluding the entire .git directory. Then we’re utilizing the include capability (with an exclamation point) to include just the specific files that can give relevant version information without all of the overhead of the entire .git folder.

The HEAD file is a pointer to the current branch reference and looks something like this:

ref: refs/heads/master

The .git config is a file which contains Git configuration information as well as the Git origin and may look something like this:‍

[core]
repositoryformatversion = 0
filemode = true
bare = false
logallrefupdates = true
ignorecase = true
precomposeunicode = true

[remote "origin"]
url = https://github.com/Rookout/tutorial-python
fetch = +refs/heads/*:refs/remotes/origin/*

[branch "master"]
remote = origin
merge = refs/heads/master

‍And finally the refs folder contains references to commit objects. Now that these files have been added, there is a direct path to retrieving a reference to the current revision. The config file links us directly to the remote origin url ‘https://github.com/Rookout/tutorial-python’ as shown above and the HEAD file gives us a pointer to ‘refs/heads/master’. By following the pointer to the ‘refs/heads/master’ file, we will be able to find the commit hash, which should look similar to the following:

18e2f68a753a1cab28327f1e8d3ac21912e3bd88

‍So now, rather than including the entire .git folder and potentially slowing the build down, we can include just a few relevant files that get us the information we need.

Using Version Information in Rookout

If you are using Rookout for on the fly debugging of your applications, you will need to understand which version of your code is deployed in your test or dev environment and then use that same code version from Rookout when you want to debug your running application. This is logical in that the source code commit you’re using from within Rookout should match the commit of code running in your test or production environment so that you can be sure you’re debugging the same codebase. In order to make this process as easy as possible, Rookout has the ability to read source code version information directly from the .git folder where your application is running.

By embedding the relevant files from your .git directory as discussed previously, Rookout can read the version information and automatically fetch your source code repository with the correct commit on the fly. By having Rookout automatically fetch your source code repository when you are ready to start debugging, much of the manual, error prone effort in ensuring that the code you’re using locally matches exactly what is deployed in your application is eliminated.

Setting Up Auto Source Fetching in Rookout

One additional option to allow Rookout to automatically fetch your source code repository is to set environment variables that Rookout can read, namely ROOKOUT_COMMIT and ROOKOUT_SOURCE_ORIGIN which you can read more about here. The main challenge with that approach is that it can be time consuming to figure out how to extract and set those arguments as part of a CI process. To improve on that approach, we can simply include the files from the .git directory as discussed above and let Rookout work its magic.

Here is an example Docker file that could use this approach:

FROM python:3.8-slim
WORKDIR /app
ADD requirements.txt .
RUN pip install -r requirements.txt
# move relevant files
ADD app.py .
ADD todos_store.py .
COPY utils/ ./utils
ADD static/ ./static
# COPY Git files for auto source fetching
COPY .git ./.git
#ENV FLASK_APP "app.py"
CMD ["python", "app.py"]

Notice from the above example, that it’s required to first COPY the .git folder to the Docker build context as seen in this line:

# COPY Git files for auto source fetching
COPY .git ./.git

This makes sure the .git folder is available to be packaged and when used in conjunction with the .dockerignore file, allows us to properly exclude the files and folders from .git that we don’t care about.

Tying It All Together

Now, when your Docker image is built, in addition to copying your source files, the relevant .git files and folders will be included. Rookout will then read these files and make an API call to automatically detect and fetch the correct code commit running in your environment.

When viewing the Application Instances screen from Rookout, you should now see the Source origin and Revision commit hash automatically populated.

When in the debugger view, your source code should have the words auto loaded in parenthesis to signify that Rookout automatically fetched the sources based on the information in the .git folder.


By utilizing the above approach when using Rookout, it gives a seamless and simple approach to debugging your applications on the fly, without having to manage or worry about which code commit is deployed into your environment. We know it seems too good to be true, but give it a try. It’s worth it.

Rookout Sandbox

No registration needed

Play Now

Table of Contents
Get the latest news

When Debugging Meets Performance

Oded Keret | VP of Product

6 minutes

Table of Contents

Our ongoing goal at Rookout, the Live Debugging company, is to turn the debugging of live, remote applications into something that every developer can easily do as part of their daily workflow. Recently, we have taken this challenge one step further. What if we could make it so developers were also able to solve performance issues on a daily basis as well? Some recent additions we made to the Rookout platform are the first step towards turning that vision into a reality.


Our investment into tracking server metrics started following a series of requests we have received from our customers. When these requests started coming in, we were quite surprised. We used to think that debugging was first and foremost about seeing the code, while CPU and memory are usually what you look into only when the APM tool wakes you up. But as our customers taught us, live debugging and production debugging require a shift-left approach in attitude. Seeing the code is no longer the sole responsibility of the developer, and watching for performance hits is no longer the sole responsibility of the IT / Ops / DevOps group.

As we launched some recent performance tracking features, we had a chance to think about where debugging and performance fit together. Here are some of the highlights.


Traditionally, the world of debugging applications has a clear cut between two practices: local debugging and live, remote debugging.


Local debugging is something that happens in the developer’s own IDE, most likely by running a single instance of the application locally. This is done by setting a breakpoint, running the app in debug mode, reaching the line of code where the breakpoint is set, and debugging step by step. In this debugging method the developer’s main point of interest is what is the behavior of each individual line of code, each individual variable.

This method of debugging is most commonly used to reproduce and troubleshoot issues with the behavior of the application, its business logic, and its user experience.


Live, remote debugging is something that happens by either integrating to a remote server (or servers) or by relying on a logging pipeline. This method is less intuitive, and requires a higher engineering skill set and learning curve. It also requires more effort and time every time it is used. This is often the reason that only senior engineers use it, and when they do, well, let’s be honest- it’s only because they had no other option (that is – they just couldn’t debug locally).

Performance troubleshooting is debugging

‍Troubleshooting performance issues, such as a high cpu spike or a memory leak, is one case where local debugging just won’t cut it.


There are a few reasons that make performance debugging something that can only be done by way of live/remote debugging:

  1. The hardware used on the developer’s desktop is different from the hardware used in the ‘live environment’, which essentially means that performance measurement will not represent the real world behavior.
  2. Running the application locally is often done by using a different app configuration than the one used in live environments. Running one pod or lambda function will not have the same footprint as running dozens or hundreds of pods or functions, all dynamically spinning up and down and all interacting with each other.
  3. Most desktop computers don’t have a built in set of performance monitoring tools – for instance, you don’t install AppDynamics or DataDog on your desktop. You may use the “resource monitor” or whatever local app is provided by your favorite OS vendor. In most cases, the local monitoring tool will not give you the granularity you need to troubleshoot a performance issue.
  4. Most developers don’t know how to troubleshoot performance issues. It is often considered a high expertise practice, which in many teams is handled by a so-called ‘performance expert’. Knowing what to measure, how to measure it, and how to fix an issue that causes a performance hit are all considered unique specializations in the world of software engineering.


Due to these reasons and others, troubleshooting performance issues is something that usually happens later in the development cycle, often on a dedicated environment (some organizations have a “performance” environment, which is something between a staging env and a production environment), often by a performance specialist.

These environments bring the set of challenges that Remote/Live debugging is set to solve – attaching to remote servers, attaching to multiple, dynamically deployed servers, handling changes in source code versions and more.

Raise your debugging game by handling performance

However, as good as all this sounds, having a remote/live debugging solution doesn’t mean it can be used to troubleshoot performance issues. Some live debugging tools simply don’t have the capability yet. In many cases debugging is done using one tool and by the developer who wrote the app, while performance troubleshooting is done using another set of tools and by the SRE or developer on call.


Thanks to some recent additions to our live debugging platform, we have now extended our core debugger into a tool that can also be used for solving performance issues. And that turns performance troubleshooting into something that non-experts can do, just as Rookout turns remote/live debugging into something that non-experts can do.

It’s all about the timing

As we mentioned at the top of this post, the initial reasoning behind this move was a repeated request from our customers. When debugging live, remote environments, they realized that getting a CPU or memory sample along with a debug snapshot, in the dev-friendly IDE experience, and without struggling to install a server monitor and correlate its results from logs from another tool, would make their debugging more efficient and enable more engineers to troubleshoot such issues. So faced with that much possibility, how could we not?


Secret sugar coating cherry sauce

‍Some traditional debuggers have the ability to track CPU and memory, with Visual Studio being the most notable among them. Some of the newer exception catching tools also provide similar capabilities, usually from a production debugging perspective.

From conversations with the same customers who requested these features in Rookout, our guesstimation is that even though these tools have these abilities, few users know these tools actually have these features. This is either because they don’t know about them, because they don’t know how to use them, or because they simply don’t perceive these tools as tools for performance troubleshooting (which, if we’re not sugar-coating it, is probably a challenge that Rookout will face as well).


As with other problems that Rookout solves, the unique value in Rookout is giving developers something they are used to. A debugger look and feel is much more dev-friendly than setting up and learning to use a server monitor, which is also external to the developer environment and is far away from the code.

And to put the cherry on top, Rookout lets you measure these server metrics without adding code, which is our thing.

So what are you waiting for? Go ahead. Try it out. See how easy performance debugging is. You’re welcome 😉


Rookout Sandbox

No registration needed

Play Now

Table of Contents
Get the latest news

New Beginnings

Shahar Fogel | CEO

2 minutes

Table of Contents

In the past few weeks, I had the great pleasure of joining the amazing rocketship known as Rookout, and I’m honored not only to be onboard but take the pilot seat as well, joining as Rookout’s new CEO.

The early days

I have been beside Rookout from its very early days, and more importantly – close to its founders from their early days. Or, Liran, and I belong to a unique training / family in the intelligence corps, which specializes in cyber security.  We kept in touch after our service, and when Or and Liran came to me with their idea of Rookout, I knew it would be a success. Though we parted ways career-wise, I remained close to the team, following with excitement as Rookout continued to soar to new heights. 

Today it is clear that Rookout has become a true leader in the devops space, bringing production grade debugging to everyone. For developers feeling the pain of debugging, only Rookout provides the ability to understand code in action, with ease and without interfering with its performance.

It’s all about the people

Since its inception, the Rookout team has grown dramatically, adding awesome team members both in our Tel-Aviv and California offices. Truly, one of the perks I’m most excited about is working with these great people on building such a great product, within the unique, geekey, and super warm and open culture.   

The talented people here, their achievements thus far, and the many customers using Rookout, stand as a true testament to the fantastic work Or and Liran have invested in setting the foundations for this company. I thank them both for welcoming me with open arms and spending the time and effort of getting me up to speed.

A bright future

As excited as I am about Rookout’s present, the future holds an even greater promise. We have some great plans to help developers better understand their software in 2020 and beyond – Empowering engineers to be more agile and productive, saving time on debugging and spending more time shipping great software.

Onwards and Upwards!

Rookout Sandbox

No registration needed

Play Now

Table of Contents
Get the latest news

“Hello, Ruby Debugging”

Oded Keret | VP of Product

5 minutes

Table of Contents

Learning a new language is always a joyous event. From the first innocent google search, through the first “hello world”, to always being surprised when the classic text is somehow printed to the screen/command line console/browser tab/local text file. The entire time your mind is quickly soaking in new ideas and concepts, new syntax and phrases, and new ways of doing things. Some of them can be compared to the languages you already know. Others are brand new. So nil is the new null, and I should expect a NoMethodError instead of a ClassNotFoundException.


[Caveman debugging. Whether you’re using printf or puts, it’s as effective as ever]


When our customers asked that we add Ruby support, we had a happy chance to go through this excitement. Some of us on the team are passionate python advocates, while others favor Go. Some appreciate the power and maturity of the classics like Java and C++, while others prefer the scale and flexibility of Node.js. But so far only a handful of the team had a chance to actually code in Ruby.

Looking at you, Ruby

And so we took the first steps with joy. Running through a quick tutorial, printing some friendly lines, figuring out how to quickly show the power of the new language without getting our hands too dirty. But when you write code, life is bound to get dirty sooner or later. Something won’t work as you expected, an exception will be thrown, the app will crash and burn. You won’t be sure if it’s because you’re not a Ruby specialist yet or because you made a rooky (he he he) mistake.

This is the point in which you will reach the less fun part of learning a new language – learning how to debug it.


[pry is the new gdb]


From puts debugging to rubber ducks

‍One of the first pages I googled under “how to debug Ruby” was naturally this one. I quickly learned that puts is my new print, and that pry is my new gdb. I learned how to gem-open and gem-unpack to see the source code. I was about to google further for a VSCode Ruby debugger plugin when I read a line that made me smile: “When all else fails, explain the problem to someone else”. It’s good to know that no matter how much changes when switching to a new language, rubber duck debugging is still your best friend. And, just to be on the safe side, I always have my rubber duck at my desk. It’s sitting there quietly, next to a purple Rook. Both of them sit there smiling, not judging me, willing to lend me a helping hand. Wing. Whatever.


The debugging guide went on to mention Wireshark, Strace, and curl, and when those words were used I usually ended up putting my hoodie on and looking for my safe space. Debugging is hard, but debugging in an unfamiliar language and without a familiar debugging tool is harder. Fear not though. Rookout is now here to help.


There is no such place as far away Ruby debugging

I started with local debugging using the newly found VSCode debugger and lo and behold! I had found the experience I was looking for: find a suspected line of code, set a breakpoint, run the app, hit the code. Essentially, it was a step-step-step through the code, looking at the local variables, and then comparing them to what I expected their value to be. When things look strange and you’re in a foreign land, when primitives aren’t primitives anymore because everything is classes, when you start to lose confidence in your coding prowess – well, let’s just say that it’s good to have the familiar debugger experience to keep you feeling at home.


[Local debugging using breakpoints. Feels like home]


After a couple of hours of happily debugging Ruby on my desktop, it was time to take things to the next level. I began by deploying the app to a cloud machine, labeling it “production”, then bringing my dream app to life. Sounds too good to be true, right? Obviously, as this is where things really started going sideways.


Even when debugging my “native” coding languages, remote debugging is a challenge. These challenges range from knowing where the code is running to making sure it’s running the same version I’m viewing in my IDE, to finding the relevant debug information, and getting access to a remote machine. All these steps require a significant learning curve and even after you’ve gone through them, each remote debugging session starts with that uneasy feeling at the pit of your stomach that something will definitely go wrong.


My first stab at remote Ruby debugging was no different. Finding the right IDE and plugin for the job, struggling with configuring a remote debug configuration, realizing I have to ask for SSH credentials… It seemed as if all the things I hate about remote debugging were back to haunt me. The thrill of coding in a new language started to lose its appeal, and I began to long for a remote debugger that would make me feel at home.


New Language, Same Debugger

‍As the title of this blog post hints, Rookout has newly added support for Ruby debugging. Installing the Rookout Ruby gem is a simple one-time task. And the best part? Once it’s up, you can debug any Ruby app, wherever it’s running. No waiting for puts lines to be added, no attaching to a remote server, no need to switch tools and learn new ones when moving from local debugging to remote, cloud, and even production debugging.


Setting up the Rookout SDK is a one-time code change – just add the following snippet into your app, as soon as it is initialized:


require 'rookout' ::Rookout.start token: ['[Your Rookout Token]', labels: {env: "dev"}]


Check it out for yourself: https://docs.rookout.com/docs/ruby-setup/

And happy debugging!


Rookout Sandbox

No registration needed

Play Now

Table of Contents
Get the latest news

Production Debugging: Everything You Need to Know

Maor Rudick

10 minutes

Table of Contents

What is Production Debugging?

Production debugging, as the name suggests, takes place when one must debug the production environment and see the root cause of this problem. This is a form of debugging that can also be done remotely, as during the production phase, it may not be possible to debug within the local environment of the application. These production bugs are trickier to resolve as well, because the development team may not have access to the local environment when the problems do crop up.

Production debugging cycle.

Why production debugging is needed

In a perfect world, all errors and bugs would be caught in the development or QA phase. No differences would exist between the three environments, making the entire deployment workflow more robust and predictable. All settings would be uniform. However, the world is not perfect, and so this kind of complete uniformity is tough to achieve.

Consider, for example, an application heavily oriented around data (internal or third party). The data sets for production are not identical to the datasets for QA or development. In this case, problems may arise that were not caught in the early stages because the production environment uses a different, untested data set.

There are two possibilities in this scenario: either the data set will be made available to test in the other environments or there will be an effort to identify the problem and its solution directly within the production environment. When the latter possibility is realized, production debugging procedures are followed.

Advantages and Disadvantages of Production Debugging 

Production debugging, as with all methods of debugging, has its pros and cons. Here are some of the most important ones to note:

Advantages:

  • Development Speed: The sooner you find the root of the problem, the faster it can be resolved. Being able to identify and fix a problem while the application is in production without having to reproduce the error locally is a great advantage in terms of velocity. As this form of debugging can also be done remotely (more on this later), a developer need not spend time trying to access or replicate the local environment.
  • Parallel Running: an application can be debugged in production without needing to shut it down. This is desirable, as the users can continue using the application while the bug is being fixed, allowing a seamless experience for the user.

Disadvantages:

  • Affects Performance: Depending on the method used, troubleshooting an application running in production may have a negative impact on its performance. Even the lightest solution can impact the overall performance. Each log line is another code statement that needs to be run. If one uses a log-everything approach, then each log line will hamper the performance of the application.
  • User Experience Risks: Modifying the application while it is being actively used can create unpredictable situations for your users and disrupt the overall user experience. It may slow the application down or cause unexpected bugs and errors that the user may encounter, prompting a poor experience.

Modern Infrastructure Challenges to Production Debugging

Today’s infrastructures are becoming more and more distributed. While this is mostly to maintain big applications efficiently, it is difficult to debug because it is difficult to trace the bug back to its source. In a distributed application, there are many moving parts, and when a problem occurs in the system, it must first be isolated to see its origin.

An example of such a phenomenon is serverless computing. Not only does it use a distributed architecture, but it represents an abstraction of the underlying application infrastructure and its abilities. In this architecture, the application is decoupled at the functional level, which is single-purpose, programmatic functions hosted on managed infrastructure.

Therefore, it’s almost impossible for a developer to perform a debugging process in normal conditions because the application does not run in a local environment.

Under these circumstances, developers need to gather enough information to solve the problem directly from the running application (function in case of serverless). Therefore, a remote troubleshooting procedure is required. As mentioned earlier, production debugging can also be done remotely through a remote debugging process.

What is Remote Debugging?

Remote debugging is debugging an application that does not run in your local environment. This is usually done by connecting the remotely running application to your development environment. In COVID times, this debugging method has become increasingly popular.

Remote Debugging vs. Classic Debugging 

The core principle behind remote debugging and classic debugging is the same: you collect data from the concerned application and analyze it to find problems and their solutions.

In a classic debugging situation, you have all the tools you need. You run the application locally, and then based on your preferences, you can either run some tests, place a debugger, or write some log statements. If the problem originated internally and you can replicate the exact conditions within the local environment, the issue should be easy to solve.

For remote debugging, you don’t have the same flexibility. For example, with logs you only see the output you set before the deployment. However, if you want to log new information within the application, you would have to modify the code and deploy a new version of the application.

A debugger would have to install different tools on the server, run the application in debug mode, and remotely connect to it using some advanced IDE. This process will not only make the application nearly unresponsive for users, but also wouldn’t be possible as you don’t have access to the host server. Therefore, for remote debugging, either use information that you already have or search for new ways of collecting data.

How to debug in Remote or Production environments

When it comes to production debugging or remotely debugging an application in general, you can take some steps to reduce friction, both before and once the issue is already present.

Testing

One step you can take is to test the application in advance. By writing the correct automated test cases for your application you are able to drastically reduce the bug-potential-surface and detect prospective problems before they become costly.

There is no scenario in which you can say you tested everything and nothing could break. There can always be scenarios that were omitted or impossible to foresee in a test case, which is why testing can never be foolproof. Furthermore, this approach usually includes high costs in the form of heavy (and sometimes slow) R&D cycles, strenuous CI/CD infrastructure work, and strict testing requirements.

Testing is important and it should catch most of your bugs before you deploy the code, but it is not airtight. Here is what else you can do in case some bugs reach the production environment.

Define the Scope of your Debugging

You mainly need to figure out the root source of the problem. Did the issue originate from this service or did something else break in a different service and it cascaded here as well? The last thing you want to do when you try to solve a bug is to waste time by troubleshooting the wrong service.

Logging

Logging largely represents a process of collecting data about your application until you figure out the root cause. This approach has a lot of value when things go wrong and requires fixes. This is because the more data a developer collects, the higher the chance they will then have the required information to resolve the incident.

While logging is often something that is configured before deploying an application, it can also help to troubleshoot future issues.

However, with that being said, logging comes with downsides as well, such as logging too much or too little and performance issues.

Logging too much or too little

On the one hand, logging too much information will create an excess of information that will only make a developer’s job harder. On the other hand, logging too little may cause developers to miss pieces of information that would have helped them to understand the problem.

Simply put, a balance should be found for the amount of logging that you do. One way that this can be achieved is by logging at the proper level (bug, info warn, error, etc) and then splitting the levels into different files.

Performance issues

Writing log statements in your application achieves the goals of better understandability and observability for your application, helping you solve problems quickly. The last thing you want to do with log statements is to create new issues.

A logging statement is just another line of code that the compiler will execute. When you only have a few lines, the impact is almost 0. However, when you have thousands, the overall performance of the application will be diminished, especially if you aren’t logging efficiently.

For example, in a JavaScript ecosystem (this example is referring to NodeJS), the basic way of logging is using the console.log() method. The problem is that even if this is the easiest and most basic way of logging, this is not the most efficient.  Proper loggers should be used like winston or morgan that don’t print messages on the console object.

Classic tools 

If neither testing nor logging helps you to prevent or understand a problem and the incident can’t be replicated in a local environment, the next step is to use a special tool for remote debugging. These tools differ from environment to environment and can bring new challenges, as they can be difficult to install and configure.

For example, if you want to debug an application that is running on a Windows server, then you will need to download and install the remote tools on the Windows server. At the same time, you must be sure that you install the tools that match your versions. After this, you need to configure the server correctly to allow remote debugging. At the same time, running your production application in debug mode will make it almost unresponsive for the end users.

In addition to all of this, there may be cases where classic tools can’t be used at all. It could be because there is no access to the host as it is a serverless application, or perhaps they are too hard to configure. Classic tools are an option but there is not much that can be done with them, because rather than helping to quickly identify issues, they often only create more.

New Tools

As mentioned previously, the problem with classic tools is that they are difficult to use and they impact the performance of the application. Therefore, a tool is needed that does exactly what the classic tools do, but with none of the complications.

One of these tools is Rookout, a live remote debugging tool that is easy to use. It helps developers collect data from their application with no performance tradeoffs.

‍Here’s how Rookout differs from classic tools and how it solves the two previously mentioned problems.


Production Debugging platform.

This tool is easy to use as all that needs to be done in order to connect it to an application is to install the library offered for the programming language of interest, and then add it in the project.


Production debugging install SDK agent.

Rookout also introduces Non-Breaking Breakpoints. Once the application is connected with the tool, the developer can start a debugging session from the main dashboard as they would normally do in a local environment. The difference is that this time, they are doing it live on the remote server. Developers can set breakpoints and inspect the code without impacting the performance of the application.

Conclusion

Delivering a bug-free application to consumers is not a perfect or realistic process. Unique situations can still arise, either because nuances were missed in the development or testing phase or the production environment differs from the one used in development or testing. Nevertheless, developers should try to prevent as much as they can while staying prepared to address them if needed.

Read More

Rookout Sandbox

No registration needed

Play Now

Table of Contents
Get the latest news

Why Are You Logging If You’re Not Using the Logs?

Noa Goldman | Senior Product Manager

7 minutes

Table of Contents

There comes a time in every developer’s life (or daily routine, we’re not here to judge) where they have to go and fix a bug. Back in the days when I used to be a developer, I distinctly remember how each time I would go face to face with a bug, my favorite method to fix it was to add log lines. I mean, why not, right?

I – and every other developer in existence, I’m sure – hated debugging, what with all the time it took to reproduce the bug and debug locally while trying to duplicate production in my local machine. I was constantly trying to save myself more time and avoid the whole process and believed that logging would be the way to achieve this.

I added log lines everywhere. Imagine Oprah giving out presents on her show? That’s more or less how I set log lines. “And this line of code gets a log and this piece of code gets a log”, well, you get the picture. You probably think I’m overexaggerating, but unfortunately, I’m not. Instead of reproducing locally, I wanted to be able to tell a story. It would be a story that would be faster to understand and which would take me to the cause rapidly.


The experience of an over-logger

‍Unfortunately, my system didn’t work. Instead of telling a story, I found myself surrounded by a crazy amount of logs which only confused me more, and eventually, I had to reproduce the bug locally again anyways.

Every time I went back to my logging tool, I had to then look for a specific log that would tell me the bug’s story. But suffice to say it was less than easy, and the time I spent looking for an informative log was taking way too long.

The easiest part of log maintenance is adding them wherever you want them. The harder parts come when you have to follow them and clean up after yourself. This was yet another thing I hadn’t thought of before embarking on my log-happy journey. I realized that it’s not just about adding the logs. Eventually, as with code, logs also need to be rewritten. When variables, logics, and code are changing – so too are logs. All this maintenance work didn’t suit my debugging attitude well.

To make it even worse, and as if maintaining them wasn’t enough, the costs definitely were. The amount of money my team needed to spend in order to keep all these logs up and running was extravagant. Spending money on different log tools and purchasing more and more storage simply so that we could have a place to store all our logs just wasn’t worth it. All of this money was spent on paying for logging tools, but it didn’t actually save any of the developers time or effort.

I found that I, and all the developers around me, were becoming fatigued by the endless amounts of logs and the effort it took to write and maintain them, when all we wanted was to simply get the information we needed to get to the source of the bug.

As is with most things in life, I learned a lot through experience. Logs are much like ingesting the right amount of caffeine- just enough and you are invincible, able to conquer any bug in your path. Too much, and well, you’ll be reduced to a twitching mess of a human, wondering where you went wrong.‍

Why logging is beneficial

‍Don’t get me wrong, you definitely shouldn’t stop logging. For any developer team, logging can oftentimes be a lifesaver. As a manager, you need to make sure that your team is walking into it with fully open eyes and understand that it’s not going to be the magic key that unlocks all of their code’s secrets.‍

How to optimize logging

‍In order to maximize your team’s logs for the best results, I recommend that you make sure of the following:

  1. When collaborating as a team, not all devs are familiar with every part of the code and not all team members will know right away where they should start debugging. Placing logs from time to time in the right areas can be extremely helpful for your team.
  2. Logging should be well planned. You don’t log because you can, you log because it helps the team to onboard. Logging, when done right, tells the story of the app
  3. Think twice and plan ahead. Logs within the team need to be managed right, by being implemented under a strict standard and placed in familiar areas. Imagine your team of developers. Whether they are junior developers or seniors with 10 years of experience, it’s probably not their first logging rodeo. Each developer came to the team with a different logging method, but that doesn’t mean that one is necessarily better than the other. It’s simply a matter of taste.

Keeping track of how logs are implemented, how they are written, and maintaining a standard within your team will get you organized and help to tell a story that will eventually save your team a significant amount of debugging time.

Why meaningful logging is the most important kind

‍Meaning is everything when it comes to logs- if you can’t understand them, you won’t be able to get the information you need to debug. Imagine that there’s an emergency situation: your production environment is on fire and you have to fix it now. You have one buoy: your logs. And everything is dependent on how much your team can understand and gain necessary knowledge from them. Keeping your team in sync and structuring their habits to write meaningful logs can make the difference when it comes to how fast your team can solve a bug.

This can be done by deciding on a team standard together. Make sure that together your team comes up with all the meaningful flows that you will want to see while debugging or when checking that everything is on track with your app. When doing so, think of the important variables or certain states that you want to be presented immediately, without your team having to go the extra mile and look for them. The best way to find these variables is to think of a time when you had a bug you had to solve fast. What were the values which helped you to understand the issue fastest? Those are the variables to employ.

Logs are meant for the whole team. It’s important that when writing logs, whoever is doing so is keeping in mind their audience and who these logs meant for. This  will help them to adapt their logging language and create logs that are easy for others to understand. No more misunderstood logs, and many more bugs crushed.


When to add logs

‍Teamwork is important. What is being logged as a team needs to be decided together. Much like writing logs or deciding on a log’s location, defining what should be logged is a key decision. When managing a team of developers, it is important to define important factors together in order to them while the application is running.

The decision should be made according to what is known to be a trouble-making area. Any critical flows that may happen within the app and can be predicted ahead of time, should be logged and captured. The key is to be able to avoid fires. When used wisely, logs are helpful in preventing damages ahead of time.

Only troubleshooting is not fun

‍Predicting fires are certainly one of the most important needs when logging. However, there are other reasons to add logs. Certain logs can be added for business or management reasons, such as keeping track of specific events like signing in or users editing their accounts.

It can also be used for profiling and timing certain areas of the code. Statistics can be taken from logs within the application, logging when certain things are happening can help the team detect behaviors and insights.

The Logging Life

‍So really, why are you logging if you’re not actually using the logs? It’s a question that is becoming more and more prevalent the more we realize that logs just aren’t the be-all and end-all that we used to believe they were. Don’t cast them aside just yet, but perhaps it’s time to consider employing logging tools that can get you that data you need to debug easily and efficiently, without needing to bash your head against the wall while you attempt to do so.

Live production debuggers, such as Rookout, do just this. Instead of writing endless log lines to be able to go back and get the information you need, set a non-breaking breakpoint and get the data you need instantly. It’s really as simple as that. So take the time for another coffee, grab chocolate, and have a happy debugging session.

Rookout Sandbox

No registration needed

Play Now

Table of Contents
Get the latest news

Focus On The Path, Not Only The Product: Here’s Why

Dudi Cohen | VP R&D

7 minutes

Table of Contents

As engineers, we continuously aim for perfection. The drive to deliver the perfect product sometimes defines how good we are as engineers. We often discuss and fine tune the term and the essence of our product’s perfection. Some claim that a perfect product is one that handles all the edge cases, works flawlessly, and can do everything. Others assert that the perfect product is the one that is simply ‘good enough’ for the customer, as it delivers what the customer wants and needs and doesn’t invest time in irrelevant esoteric features. But what about the road to building your perfect product? Shouldn’t that be perfected as well? Sometimes we don’t really invest in how we create those perfect products and how we write those amazing pieces of code.

Customer first

There’s no doubt that the top priority you should consider when writing your code or developing your product is, without a doubt, your customer. Your product is developed for someone and that someone might be your customer who is willing to pay for it, a whole community of people who will use it without cost, or even only for yourself. You will do anything to deliver the best product possible to your customers. 

This means that when you consider each step in the development process, the top priority that should be on your mind is your customer. But what about you? Are you thinking about yourself? Do you consider yourself a priority in the development process? Well, probably not. You don’t matter as much because the customer is the most important element to consider. Because, well, you know, “customer first”. Let’s take a step back, though. Is this really the case? Do you and your team only need a laptop and an endless supply of coffee? Or maybe is it time to start thinking about yourself too and where you (yes, you, looking at you) fit into this process and actually, dare I say, improve it?

Do it for the customer

Whenever I want to spend money on a new tool for my team and me, I need to explain to myself (and of course, my CEO as well) why I need to spend the money. After all, the customer is first, and we already spent a good amount of money on the must haves for creating a great product: the newest Macbooks, the Jura (see it below in all its glory in our new offices) and the freshest coffee beans. After all, we’re not building software for the sake of building software and for the sake of adopting the coolest newest tools. No, we’re building software to sell it and to change how developers work. So why do we need to invest in a new tool? Why spend a lot of money on a new APM? Why shell out thousands of dollars for that top of the line IDE when I can use VIM? 

As far as I see it, the answer is pretty simple and it returns to the “Customer First” idiom. We need to invest that money, not for ourselves, not for the employees, not for security, but rather we need to invest that money (and time) for the customer. Yes, you read that right. Invest in yourself, for the customer. Because the more you invest in yourself, the better you are, and ultimately the customer will receive more. So yes, go out and live your best life.

What’s good enough for the customer?

We are no longer in the era of “fire and forget” product delivery. When a customer chooses your product, he isn’t just choosing to use your product, but rather he is also choosing you. When you buy a smartphone, you don’t just buy it and forget about the vendor. You buy that smartphone because you also consider the support, the user community, future software upgrades, security updates, the application store, and the entire ecosystem behind it. Sometimes, this is why you’re okay with paying more because you know that the vendor will keep delivering for you. 

This is the first and most important reason as to why you should invest in your own processes and your own tools. You do it not just because you create awesome products, but because your customer expects that you will keep on delivering. 

When you or your manager ask yourself, “Should I really be investing time and money on a new tool?” or “Shouldn’t I be investing time in a new feature for the customer?”, try to imagine how your customer will react when you’ll be explaining to them how you will improve the quality and velocity of your product delivery. Will your customer appreciate the improvement of the process?

Starting from scratch or creating a relationship

If you are yet to release a product and don’t have any customers, then I’m guessing that you probably think I’ve been speaking nonsense up until here. Thinking that you need to push forward as hard as you can while ignoring the road there might be a good strategy for the short term. However, if you’re using the wrong tools – or not using tools at all – then you might be creating a great technical debt. This can mean that once you have a customer and you won’t meet their expectations, there’s a chance they say farewell sooner than expected. 

Additionally, when looking at the long term, since you do want to ultimately deliver a product to your customers, the one thing that you don’t want -and can’t afford – to lose on the way is your developers. Using the wrong tools can cause fatigue and frustration among your team and you might find yourself without a team before you can even deliver. Don’t think about investing in the best logging service or the best debugging tool as for your employees, but rather as how you’ll be investing in it for your customer. This is because you want your employees to deliver the best product that they can and be as productive as they can for your customer.

Treat yourself for a better road

At Rookout, we have invested a significant amount of time into making our product as easy to integrate and use as possible. We aim for our customers to use our data collection and debugging tools as part of their daily routine. We tried to make our UX as familiar as possible for developers so that diving into a debug session will be a breeze. Yet, when our users hear about “remote debugging” and “production real time debugging”, they sometimes take a step back. Their first response is either “I don’t have the time or focus to learn something new” or “I’ll just add logs or ssh into that machine”. But, does your customer really want you to be SSHing into a production machine? Even more so, are you even allowed to do that? Does your customer appreciate the fact that you won’t be able to collect logs and find a bug while you have a code freeze? So we have just the solution: invest in yourself. Treat yourself to some magical debugging tools. Trust me, your customers will appreciate the results.

You’re not alone

Adopting new technologies, new methods, and new habits is quite difficult. No wonder weight watchers and other support groups exist. It is hard to make a change and you need people around you for support. Adding an open-source tool to your workflow is similar. When you add an open source tool into your toolbox, you’ll have the open source community to help you out (pending availability, popularity, and even how different your environment is from other peoples’). 

At Rookout, we believe that the path to the perfect product is just as important in the product itself. That’s why we have invested a lot of time in both our documentation and our detailed deployment examples so that the journey to using our platform doesn’t have to feel like that. But if you’re having trouble adopting our tools, please remember that there’s a team of engineers that are more than happy to assist you. We know that trying something new is sometimes challenging – and just a tad bit scary – and we’re here to help out. Ping us on support@rookout.com or even use our app’s built-in chat.

Rookout Sandbox

No registration needed

Play Now

Table of Contents
Get the latest news

A Guide to Software Understandability: Why It’s Essential To Every Developer

Maor Rudick

2 minutes

Table of Contents

Whether it’s debugging, modernizing your software, or finding information in a production environment, understandability is the answer. This Intellyx whitepaper takes an in-depth look at the concept of Software Understandability and why it’s so essential for developer teams – and every developer! –  to have it as a part of their workflow.

When it comes to software development, why is it that developers’ code doesn’t always behave as they expect it to? Well, it all comes down to one missing key element of their workflow: software understandability.

So what is software understandability? According to Intellyx, “Understandability is information about running code sufficient to understand its behavior on a line-by-line basis, regardless of the complexity of the production environment.

“Without understandability, those coders are working in the dark – and the risks inherent in introducing new bugs into production are substantial.” 

Developers must go through an extremely long process to get the data they need to understand what is happening in their code. Take debugging for example. When trying to find the root cause of a bug, a developer can face endless deployment cycles and wade through many log lines in their attempt to get the data they need to find the source of the issue. Without an understanding of what’s happening in their own code, productivity and velocity can plummet, involving unnecessarily long wait times, lots of wasted resources, and a great many unproductive hours.

“The software in production may be changing as it’s scaling up (or down) – and the changes will typically take place too quickly for humans to manage.”

“An understandability tool… brings information about the running software in production to developers, providing visibility into how individual lines of code impact the behavior of running software, without impacting that software.”

Download Whitepaper Here

Rookout Sandbox

No registration needed

Play Now

Table of Contents
Get the latest news

The Modern Developer Workflow with Waypoint

Josh Hendrick | Senior Solutions Engineer

5 minutes

Table of Contents

Modern developers are under ever increasing pressure to deliver software applications to the business in record time. This means shorter development cycles and a push to have code production ready as early as possible. In addition, many development teams no longer throw the code over the metaphorical wall to be handled by operations and production support teams, but rather oftentimes own the entire end to end delivery chain.


In order to meet these lofty expectations, developers are adopting tools and processes which promise to allow them to focus more on what’s of critical importance – writing code. As development teams move towards the DevOps view of the world, focusing more on automation of manual tasks and improving software understandability across the SDLC become critical focus areas.

HashiCorp’s new open source project, Waypoint, fits nicely into this modern developer workflow by helping to provide a consistent and simplified experience for building, deploying, and releasing applications across a multitude of platforms. For teams that want to quickly and easily automate their end to end software delivery process, Waypoint gives developers the ability to reduce complexity and simplify their development workflow. Software delivery automation coupled with the ability to continuously and seamlessly debug across platforms and environments can give development teams the ability to improve the understandability of their software and optimize their workflows from build to bug fix.

Why You Should Simplify Build, Deploy, Release

Many organizations today are making the move from monolith to distributed, cloud-native architectures. It can be a daunting task for developers who now have to not only build or refactor these new applications, but also become familiar with many new areas of technology required to make these systems work from building containers, to generating Kubernetes YAML manifest files, and more. Any technology which can reduce the learning curve and simplify processes is almost always welcome with open arms. Waypoint aims to reduce the complexity of automating the delivery pipeline with a single simple and easy to use technology.

Developers want tools that fit into their existing ways of working. Waypoint hits the mark here in that it’s a command line tool which works similarly to other Hashicorp products. Simply calling ‘waypoint up’ with a configuration file defined will run the build, deploy, and release workflow defined in the configuration file. This makes it incredibly easy to fit into existing build and deployment tools like GitHub actions or Jenkins.  

This also enables development teams to simplify the often complex toolchain used across build, deploy, and release processes. Many times there are multiple tools with their own sets of learning curves and maintenance work involved in a deployment pipeline. Waypoint gives teams an opportunity to reduce overall complexity and potentially technical debt that can build up over time. This allows teams to both shorten their time to value as well as create consistent processes across the organization.

How Observability and Debugging Are Employed Across the SDLC

Once build, deploy, and release tools have executed and your application is running in your dev, staging, or production environments, it is equally as important to have proper observability and monitoring tools in place to allow for quick discovery of defects or problem areas in your running application. If you look across most organizations today, Application Performance Monitoring (APM) tools have become standard in enterprise environments.  They not only allow teams to monitor whether their applications meet SLA’s and performance requirements, but also allows teams to more easily identify potential issues in their code.

While APM tools may get you to a general problem area of the code, they are less helpful when developers need to dive into the inner workings of the code to analyze a problem in a running application. In addition, they are often less valuable in lower development environments where things might not work as expected much of the time. This leaves teams with the often used option of pushing a new log line to debug those pesky issues that aren’t easily solvable. Even with a fully automated pipeline from Waypoint, new releases can still take 10-30 minutes in a dev environment and usually much longer in downstream environments. Remote debugging of these applications across a combination of on-prem and cloud based environments can prove to be a complex task. The right tool for the job here is a remote debugging solution which allows teams to continuously debug on-demand in any environment without making changes to their code or having to push a new release.

How To Increase Developer Velocity

When we sum up the areas discussed so far, the underlying motivator for adopting these new technologies is to increase developer velocity and increase the speed at which teams can release new software. Automating build, deploy and release cycles frees up developers to focus more on writing code and building new features for their customers. Giving developers the tools they need to remotely debug those running applications whenever the need arises ensures that they aren’t wasting unnecessary cycles debugging newly deployed code which can oftentimes drag on for days or weeks at a time.

Most organizations adopting DevOps practices are now tracking key metrics such as MTTR (mean time to repair), deployment frequency, MLT (mean lead time for changes), and others which directly impact developer velocity. Adopting tools like Waypoint allow development teams to deploy more frequently ensuring that they can respond quickly to business changes. Remote debugging solutions like Rookout allow those teams to reduce their MTTR from days or weeks to minutes or hours. It’s important not to sit on the sidelines and wait for these metrics to improve on their own.  Most organizations can benefit immensely from adopting new cutting edge technology that can save time and greatly improve the quality of software.

Achieving Success

It’s become clear over the years that software service providers who adopt tools that fit effortlessly into developers existing workflows and processes typically experience the most success and highest levels of adoption by the developer community. Developers are constantly looking for new tools and processes that allow them to write better code while moving at a faster pace. Build, deploy, and release tools like Waypoint and others are democratizing delivery pipelines and lowering the time to value when automating application releases. Proper build, deploy and release methodologies coupled with the ability to dynamically and intelligently debug those deployed applications across any environment are keys to accelerating the software delivery process and will undoubtedly keep organizations on path to delight their customers.

Rookout Sandbox

No registration needed

Play Now

Table of Contents
Get the latest news

Setting a Live Debugging Dashboard to Catch a Thief of Time

Oded Keret | VP of Product

7 minutes

Table of Contents

They say that procrastination is the thief of time. In the world of software development, there are some additional “time thieves” that prevent our teams from developing new features or slow them down as they attempt to fix issues.

As software engineers or R&D managers, we take it for granted that our teams spend a lot of their time waiting for compiling, testing, and deploying. We know that many a coffee break was justified by an unpreventable waiting period created by an automated process that causes idle downtime and unwanted context switches in the engineer’s work process. We invest in building automated tools and devops practices to ensure they have a minimal impact on the velocity of our teams. But one thief still lurks in the darkness, stealing precious time without us even realizing it. This thief is called debugging.

Debugging in the best of times and the worst of times

We are used to thinking of debugging as something that happens only after feature development has finished. In the traditional world of waterfall, debugging mostly happens after the code was thrown over the wall at the QA team. In the world of DevOps, however, we expect that debugging will mostly happen after the feature is deployed in production, and then see customers interacting with it in ways we didn’t anticipate.

We know that we will then face the challenges of reproducing the issue locally, writing a unit test that covers it, connecting to a remote machine, struggling with getting the right version of the code, and other such time consuming tasks that will slow us down as we try to reach the root cause.

In reality, we know that a lot of debugging happens during feature development. As soon as a developer wrote a couple of lines of code, the code already has at least one bug. The obvious bugs are cleared when testing the feature locally on the developer’s laptop. Some will only be discovered later in testing or staging environments. And no matter how hard we try, some will be encountered by customers in the production environment.

We usually give more weight to those bugs, as we measure our MTTR and try to understand the impact of production issues on our business. We also tend to take for granted that debugging locally and debugging in dev/staging/testing environments will always happen. But as with other KPIs in the world of software development, without measurement the weight we give to debugging in the production environment will often be biased, as we will not realize how many hours our teams invested in debugging locally or in other remote environments.

Oh, where does the time go?

In other development and troubleshooting domains, we make sure to have very strict and precise time tracking. We measure how long it takes to develop a feature, either by directly using designated tools or indirectly based on our agile planning and retrospective ceremonies. We measure how long it takes to fix an issue, and we track it rigorously in our support ticketing systems. Then, if we think our engineers have had enough coffee that day, we may even invest  in not only improving our CICD systems, but also in measuring and reducing time wasted on compiling, building, and automating testing flows.

[How much time was spent debugging during the last sprint?]

In some teams, the above time tracking is part of the release ceremony. Before every sprint, goals are set to reduce idle time and issue resolution time. At the end of every sprint, teams hope that by reducing wasted time, they are able to release more features and keep their customers satisfied. However, such measurement is rarely allocated to debugging efforts, which are a significant part of every feature development cycle. Often, this is because there are no specific tools for measuring debugging time or because of the misconception that “debugging just happens”. We can’t anticipate how many bugs we will have and we can’t anticipate how long it will take to fix them.

Saving time to spend more time

When a feature has been developed, developers believe that they can’t say how much of the development time was spent debugging. When a feature has been released, teams measure how much they invested in writing it, but not how long they keep investing in debugging it in prod.

This is where the Rookout Live Debugging Heatmap comes in. This new feature was developed in order to help uncover the hidden time thief and empower developers to steal back the time it took from them. This allows them to spend more time building cool features, and make their bug resolution become much quicker.

Rookout Live Debugging Heatmap shows how much time was spent debugging. Take it one step further, and it shows us a breakdown of how much time was spent debugging in a specific application, environment, or version.

“That is because you don’t yet know how to deal with time,” said Wen. “But I will teach you to deal with time as you would deal with a coat, to be worn when necessary and discarded when not.”

It will show you, for example, that even though you thought the most important issues happen in production, 80% of remote debug sessions actually happen in your staging environment. Debugging in staging is just as hard and time-consuming as debugging in production, and the fact that we solve most bugs in staging means two things:

One, that we saved a bunch of bugs from being discovered by our customers.

And two, that we saved a lot of time and effort. This means we saved many programming hours that can instead be spent on developing more features, fixing more bugs, and drinking more coffee.

It will also show you that even though you thought the overall quality and user experience of your application is high, because the APM dashboards are green and very few jira tickets are identified with resolving issues in the application – the reality is that every day your developers spend hours debugging issues, issues that are not tracked by jira and not monitored by the APM. This knowledge will help you prioritize a refactoring, test coverage, and logging effort into improving the stability of your application. Lastly, it will help you pinpoint the stability and quality of specific releases., which will allow you to track the ongoing improvement in your team’s velocity and quality.

Always leave time for coffee. And chocolate.

In addition to the above, at Rookout we have added features that let you know who in your team is debugging, how often your team has live debugging sessions, and how much time and effort Rookout has saved your team.

That last one is based on feedback we received from customers. These customers told us that 10 minutes of debugging with Rookout will often save them 1-2 hours of having to reproduce the issue locally, wait for log lines to be added, find the correct repo and more.

For some of our customers, the ratio is even higher. Recently a customer told us that in certain environments adding a log line will take up to 24 hours, as the application is deployed once a day. So, having Rookout around would reduce their MTTR significantly.

Other customers suggested we integrate into their lifecycle management or support systems, so we can track how much debugging time was invested in each customer incident. We may get to that in the near future, and once we do, we hope the heatmap will be even more helpful.

“Computations have been made by experts. With these pills, you save fifty-three minutes in every week.”
“And what do I do with those fifty-three minutes?”
“Anything you like…”
“As for me,” said the little prince to himself, “if I had fifty-three minutes to spend as I liked, I should walk at my leisure toward a spring of fresh water.”

With the Rookout Live Debugging Heatmap coming to your Rookout dashboard, we expect it will reveal a lot of time saved for you. What will you do with that extra time? Will you develop more features to increase your customer satisfaction? Will you fix even more bugs, improving the quality and user experience of your service? Or will you go and have another cup of coffee? (Maybe with a biscuit along with it. Chocolate is preferable. Just make sure it’s not nougat.)

Rookout Sandbox

No registration needed

Play Now