There’s nothing worse than creating that perfect cup of coffee, sitting down, putting yourself into the mindset of digging deep into your production environment, and…nothing. Because your application is a complex living beast and seeing how all the pieces fit together is often more than you’ve bargained for.
While trying to figure out what’s what, your coffee is growing cold, and you’re becoming increasingly frustrated. Those Slack notifications are piling up, those Jira tickets aren’t going away, and you’ve just burned through more time than you cared to.
Sound familiar?
The first thing you have to do in every troubleshooting session is to gain a sense of the puzzle in front of you. Unfortunately, in modern cloud-native applications, troubleshooting is often easier said than done. This is where we, as Rookout, felt we had a unique opportunity to make things easier for our customers.
Making Live Debugging Even More Intuitive
As a developer-first observability tool we map all our customers’ code across all their microservices and environments. Now, we’ve made that information easily available to all of our users to help them gain a better understanding of their applications and make their debugging sessions even more productive.
At the core of it, we’ve added a new screen that allows software engineers to easily slice and dice across all their running applications, see how everything comes together, and even know exactly what version of code is running where.
What does this look like? Well, I’m glad you asked.
1. Structured Facets & Categories: these new facets and categories are intended to help the users to explore, discover, and review the various values and properties of their applications that are divided by structured sections. Users can use them in the application selection to search within the application values, define a specific set of applications to debug, and learn about their applications.
2. Active and inactive applications: the use of the new toggle will allow users to easily navigate between two different modes: seeing what’s running right now versus seeing all the applications that have recently run. Looking at an inactive application is useful when working with Serverless, batch, and other kinds of cloud-native applications that aren’t continuously on.
3. Application properties: with this, users now have copious amounts of knowledge at their fingertips. The new properties pane will provide essential information users need to understand and debug cloud-native and Serverless applications. This includes everything from hostname, Kubernetes and Serverless metadata, custom labels, to process command line, and even the exact source code revision!
4. Free Search Ability: users can free search whatever they want, by Key or Value, and by a specific application value or category. This helps the users explore and discover their different matched applications.
On top of everything else, this new experience allowed us to bring to life our #1 feature request – easily selecting multiple microservices for simultaneously debugging cross-service requests in a seamless manner.
The TL;DR
Gain an unprecedented view of your application with our brand-new explorer. See where your code is deployed and how everything comes together. And remember, live debugging is always just a click away.
We always want to use the best of the best when it comes to Kubernetes tooling. We keep up with the latest projects, download them when ready to try them out, and see where they could fit in our development work here at Rookout. As part of our migration to Kubernetes-native tools, our most important goal is to make it seamless and smooth so our developers will stay agile, fast, and happy. For some of that migration, we’ve faced some challenges, particularly with pipelines.
Our developers maintain their own pipelines just by the code repo, using Jenkinsfile or GitHub Actions workflows. This allows them to maintain their pipeline in a sandbox environment without influencing their team pipeline. Only after making sure everything is right, the pipeline can update within the main branch by pull request.
This multibranch pipeline feature is crucial for keeping our teams agile and fast. Therefore as a DevOps engineer at Rookout, my team and I have reviewed several tools to migrate to k8s native CI/CD pipelines. and, as a Kubernetes enthusiast, I am looking for the most powerful k8s-native tools to get the best performance out of it.
One tool that has made a big impression on us is Argo. Well, two tools really: Argo Workflows and Argo Events. Together, they suit our needs as an advanced CI tool, giving us more freedom with custom configuration and logic.
This tutorial will cover building out and configuring and then performing a debug on a Kubernetes-native multibranch pipeline using Argo. Over the course of the walkthrough, we’ll use the Rookout Live Debugger to debug ArgoEvents.
Argo’s Benefits
We’re not only using it for pipelines but other automated processes, such as our data platform ETLs. By adopting these tools we have significantly sped up our build process. Argo gives us:
Parallel testing
On-demand temporary environments of our microservices applications, and
We now manage each step of the build process with version control and, of course, in GitOps with ArgoCD.
ArgoCD also uses CRDs (Custom Resource Definition), Kubernetes Custom Resource Definitions that record the desired state of and allow configuration of ArgoCD clusters.
Management of Argo Workflow Template CRDs takes place in a centralized repo, making it easy to use standard steps like kaniko build parameterized steps or GitHub action steps.
However, if our team wants to add a new step in a sandbox environment just “near their code” as they are used to doing, things can get messy.
Multibranch Pipelines
For that problem, I thought about how I could give our dev teams that multi-branch pipeline that they’re used to. My solution is a lean YAML interface inside the repo that configures their pipeline.
This lean format is much more developer-first – e.g., devs can focus on the logic itself and fear configuring long YAML files.
This lean configuration is then passed as JSON inside a POST HTTP request and with GitHub Actions – for each push – in any branch to our Argo Events EventSource. Metadata is also passed for labeling, such as committer identity, branch name, etc.
Configuring the Multibranch Pipeline
Now we can use the pipeline configuration as a parameter inside Workflows that a Sensor can create for us (with a k8s trigger) – we just need to parameterize it right. An example is provided here:
After creating a new Workflow CRD inside the cluster, the ArgoWorkflows controller will handle the heavy lifting by consuming the Workflow CRD and then running those multi-pod pipelines.
That’s the true power of microservice architecture and controllers!
A Kubernetes-Native Debug Process Using Rookout
The only problem with the above approach is that ArgoEvents doesn’t yet support the injection of blocks using parameters.
In fact, there is a bug in ArgoEvents itself. We can’t <em>"unmarshall" </em>the workflow instance spec.
When the Workflows CRD returns “cannot unmarshall spec: cannot restore struct from: string”, it means that the block parameter is serialized into a string and can’t be injected as JSON.
But hey, this is open source! We can debug it and contribute back to the growing Kubernetes-native community.
To accomplish that fast, I have injected the Rookout rook (agent) into the sensor section of ArgoEvents so that we can debug the sensor that we’re creating. I’ve also injected ENV parameters to the sensor container like Rookout’s token and other ENVs as shown below in order to configure it right.
Also for source fetching, I used Rookout’s Explorer feature that allows me to grab the source code locally, and was very useful for self-built images that I have tested.
After injecting our Rookout agent inside the code, I’ve built it out and switched the container image of the sensor for a new version of the image that includes the agent.
With everything in place, we can now access and debug Kubernetes-native code inside the Rookout Web-IDE. We place breakpoints and launch the debug process. The Rookout Live Debugger uses non-breaking breakpoints, which allows you to debug without stopping your code or relaunching your container.
How to debug Kubernetes-native pipelines: Choosing which instances to debug in Rookout
After a quick look I have found what was the problem. The function ApplyParams in the sensors/triggers/params.go file. This file injects parameters to the JSON using the SJSON package with the SetBytes function. This function was getting an incorrect value – in that *value that contained escape characters – leaving the value as a string. This was breaking the injection in the destination field.
Option 1: We could fix *value so the string will be serialized correctly without the escape characters. Option 2: We can go with the flow and find a way to use this serialized JSON.
Plan A: Fixing the Value
I have followed *value and tracked its creation to the getValueByKey function called by ResolveParamValue. But the problem wasn’t from here.
To make a long story short, the root cause is the serialization of the payload’s data with the CloudEvents SDK-Go V2 library that is used in the convertEvent function in trigger/listener.go. Rookout’s Stack Trace feature made it easy for me to find it fast.
Although fixing the library is very tempting, I am not sure that we should fix it there. Besides, I don’t know what impact there will be on other functions.
Because of all that, I’m going to follow the second approach.
Plan B: Serialized JSON
I will try to use the same backslash string with a different approach. I’ve found that casting it to []byte and using the SetRawBytes function of SJSON works just fine. Therefore, this will be my fix. I have tested it and it works.
sensors/triggers/param.go:
func ApplyParams(jsonObj []byte, params []v1alpha1.TriggerParameter, events map[string]*v1alpha1.Event) ([]byte, error) {
   ...
   // now let's set the value
   tmp, err := sjson.SetRawBytes(jsonObj, param.Dest, []byte(*value))
   if err != nil {
     return nil, err
   }
   jsonObj = tmp
 }
 return jsonObj, nil
}
An issue has been opened on GitHub as well as a PR.
ArgoCD’s ApplicationSet
Let’s consider another approach: leveraging ArgoCD’s ApplicationSet with the generator SCM provider. It can scan all the repos, extract that lean YAML configuration, and then inject it into a generic Argo Workflow. The Workflow is templated using a Helm chart.
Firstly, I have to create a Workflow Helm chart. It should have the branch name, SHA of the commit, and so on. Also, the name has been parameterized to force the ArgoCD application to create a new CRD instead of updating the old one. Here is a modest example of this POC:
Of course, a helper is used to name the Workflow properly.
Next, we’ll create one ApplicationSet CRD to find the lean YAML configuration within the target repos of our organization’s repositories.
Then, we’ll inject them into the Workflow Helm chart as a values file.
A generator provides us a useful parametrization of the generated ArgoCD Application. That generator will inject the commit SHA and branch name into the Helm chart (labels). I also used a filter to skip all the repos that don’t contain a workflow/ci.yaml file:
Now, I only need one last, small modification to the lean YAML formatting. The file should be placed in the /workflow folder in the repo and called ci.yaml. Here is an example of a ci.yaml file:
Great! We now have a multi-branch pipeline solution for our dev teams! There are several problems with this solution, though.
Firstly, there is a delay in pushing a new commit to the building, thanks to a ArgoCD re-consolidations delay. We can solve that by refreshing the application using GitHub actions and the ArgoCD CLI.
Secondly, we lose the ‘build history’ when we overwrite the original CRD. So it’s not the best option, but an ApplicationSet like CRD for Workflows could still be useful.
Conclusion
I have demonstrated how to implement and debug a Kubernetes-native multibranch pipeline using an Argo Events Sensor by injection of a lean YAML configuration from microservice’s repo. Argo didn’t support this implementation, so a we needed to make a short contribution, as well as a debug session using Rookout. Thanks to the Rookout Live Debugger and its non-breaking breakpoints, it was fast and easy to debug the Argo sensor with real-time data.
This is just a sample of how Rookout can debug Kubernetes deployments, including multiple instances at once and identifying problem clusters. Rookout doesn’t require additional configuration for Kubernetes clusters, as Rookout is configured only at build time. For more about Rookout and Kubernetes, try out Rookout for free!
Every developer has experienced the pain of debugging. We know that you know what we’re talking about. Who hasn’t been lost jumping between different windows troubleshooting their code, log-jammed trying to track bugs in a pile of logs, or been caught screaming at a rubber duck that’s blankly staring back at them?
But it shouldn’t be that way. Being able to troubleshoot quickly shouldn’t involve speaking to inanimate objects, pulling out your hair, or drinking gallons of coffee. It should be efficient and painless and give you the ability to dive deep into your code and understand the source of the issue, no matter when and no matter where.
Rookout’s Live Debugger has always endeavored to painlessly detect and highlight bugs more quickly and efficiently than other tools through its Web-IDE.
We at Rookout are thrilled to debut the brand-new Rookout IDE plugins for general availability. This new set of plugins makes available Rookout’s robust capabilities for debugging cloud-native apps, multiple kinds of architecture, and a swath of languages that will now extend into the JetBrains IDE family.
Now, you can give yourself the freedom to work in whichever environment, runtime, or tool you want – including within your IDE – and give developers a seamless debugging experience.
Rookout inside IntelliJ, PyCharm, WebStorm, and more
The SDLC can be broken down into dev, staging, and production/ops. However, truth be told, that regimented division leads to a false impression that certain things just don’t happen in production like they do in development.
In particular, debugging needs to work throughout an app’s lifecycle, including and especially in production.
That’s where Rookout’s Live Debugger comes in, catering you essentials like troubleshooting and debugging your app, but without editing your code, stopping your application, or having to restart it.
The IDE plugins work in the JetBrains IDE family with the following languages: Java and other JVM languages, Node.js (as well as JavaScript and TypeScript), Python, .NET, Ruby, and Go.
With these plugins, Rookout’s Live Debugger meets a developer’s preferences for their fastest, most optimal workflow. You can use it in IntelliJ, PyCharm, WebStorm, GoLand, RubyMine, and Rider.
Here, we’ll show you how to get started with installing and configuring Rookout for live Java debugging in IntelliJ.
The process is similar in the other JetBrains IDEs. You will need to install the plugin as well as log into or sign up for a Rookout account.
Installing the Rookout’s Live Debugging Plugin in JetBrains IntelliJ
First, download Rookout’s live debugging plugin into IntelliJ. You can do that either directly from the IntelliJ marketplace, or access the JetBrains Marketplace by hitting the ⌘ and , keys. Search for Rookout, and it should pop up:
Find the Rookout live debugging plugins inside the JetBrains Marketplace
At this point, your plugin should be active. You’ll see two Rookout logos on your project screen that represent 1) the debugger itself (at the bottom) and your Rookout instances (to the right). Click on either to open their tabs.
Click on one of the tabs to see the Login button options. A browser window will open where you can sign into Rookout. Now you’ll be able to set non-breaking breakpoints.
In the Instances tab, you can choose from any of the environments connected to your Rookout account. You can also choose from all the available repositories. From within that repo, pick the instance you want.
Select from the Instances panel in the Rookout live debugging plugin sidebar in IntelliJ
Once you pick the instance, any previous data for that instance will show up in the Debugger tab at the bottom of the screen.
Rookout’s event logs in the bottom panel inside IntelliJ
Drill down further by clicking on the breakpoint to open the Variables, Process, Stack Trace, and Tracing tabs to the right.
Drill down with the Variables, Process, Stack Trace, and Tracing tabs to the right of the bottom Rookout panel
Configuring Breakpoints
Click the left column to set a breakpoint and hover over the point to see its status.
See the status of your Rookout non-breaking breakpoint in IntelliJ
If you set a breakpoint that for whatever reason isn’t available for the Live Debugger, you’ll see an empty breakpoint symbol with a pending message.
An error status for the Rookout breakpoint
You can also set up conditions and variables by right-clicking on the breakpoint to see a new panel. Customize the log message and set the condition.
More advanced settings are also available with more detailed log messages and conditions, hit limits, and access to collection methods for your data.
Advanced settings for Rookout non-breaking breakpoints for debugging within IntelliJ
Go with the Flow into the Rookout Web-IDE
These Rookout IDE plugins extend the Rookout debugging workflow, creating a continuous debugging session from within your JetBrains IDE to the Rookout Web-IDE.
A debug process can be initiated in your IDE and should in need to debug complex, cloud-native deployments like hybrid cloud and serverless environments.
Or, if you need more visualization options, simply continue in the Rookout Web-IDE:
Tracing Timeline Visualization in the Rookout Web-IDE
The new set of Rookout IDE plugins offers flexibility for anyone preferring to work within a given IDE without reopening your source code, both during a full Rookout session within our native Web IDE, or within multiple IDEs without having to shift to one specifically.
Switching between the Rookout IDE Plugin in IntelliJ, and the Rookout Web-IDE to conduct advanced debugging visualizations and serverless debugging
Pipeline your Debug Data to other Observability Tools
In addition, Rookout’s targeted integrations with other observability tools let you pipeline and analyze that new debug data side by side with deeper, more detailed information.
Rookout advanced live debugging integration with Datadog
An Integrated Live Debugging Environment
At last, Rookout is available within your go-to IDE. You have the option to access Rookout’s advanced live debugging in IntelliJ, PyCharm, WebStorm, and the rest of the JetBrains library. To get a more guided tour or the new Rookout IDE plugins, checkout the video tutorial below.
With Rookout’s comprehensive and integrated coverage, you have quick and easy access to your code. Try Rookout for Free.
It doesn’t matter if you’re just starting to learn code or if you’ve been doing it for a few years – sometimes you feel like you have no idea what you’re doing. This feeling can be made even worse by the wealth of information out there, making the right decision can get stressful. Life is full of those tough choices: Coke vs. Pepsi; Yankees vs. Red Sox; Django vs. Flask. You know, regular questions about soda, baseball, and Python frameworks that almost everyone faces.
Don’t worry, figuring out the best choice is where this article comes in.
While Python is known to be on the easier side to learn, it still has its hurdles. What tool am I going to use? Is this too simple? Is there a better tool for this? Am I learning the wrong Python framework?
Yes.
Sorry.
Just kidding. There’s rarely a wrong answer when it comes to the stack of tools you use for programming. Now, that doesn’t mean there aren’t better answers for certain use cases. When it comes to Python projects, there are a lot of frameworks in the game, but we’ll focus on two right now: Django and Flask.
These are two of the most popular frameworks for Python development. Django is known to be more complicated and advanced than Flask, but that shouldn’t be the only factor in deciding what to use.
Python ∙ Java ∙ Go ∙ .NET ∙ Ruby ∙ Node.js & MORE. Rookout covers it all.
The two have their pros and cons, plus particular use cases that might make one unexpectedly better than the other for professional projects. Let’s cover some of the basics.
Agility vs. Speed
Django is much faster than Flask. It wants to move from concept to draft to app as quickly as possible, so some multifaceted applications can churn out in a matter of hours (well, the bare-bones MVP versions).
Flask is a lightweight framework, so the less it has to manage, the better. So it’s quick for smaller projects. This is an advantage and a disadvantage. True, you can have full control over app creation right down to its architecture. However, you will be doing much more building from scratch.
If you want the agility to go with that speed (especially with a bigger project), you should go for Django.
Security
Django’s security is more robust because of built-in authentication, and it’s adaptable to different markup languages. The project’s maintainers are also better at keeping up with and updating the community about Django security issues or fixes.
Flask isn’t a naive framework by any means. You can download authentication extensions like Flask-Login and Flask-Security. That being said, you will need to do some due diligence on the 3rd-party plugins you choose.
Most importantly, it’s arguably more scalable than Flask because every layer of an application here is independent from the other. But there are great Flask security resources to read.
Apps & Microservices
Django and microservices? It’s possible, but a real pain. Its monolithic nature limits its potential for use in high-scale settings, as cloud development increasingly uses microservices as a default option.
Django’s large codebase and multiple functions also complicate any simple project, so it’s important to understand when your project is too small for Django or too big for Flask.
You can create some functional, bare-bones apps in the more limited framework of Flask. But because that framework is so simple and its support for databases is extremely limited, creating an MVP is going to be difficult (not impossible, only harder). There’s also a smaller Flask community to help maintain and grow the framework’s capabilities.
Python Developer-First Observability
There are many comparisons of the two frameworks. However, few compare Django and Flask on points of observability or debugging. The following sections will try to cover logs, metrics, traces, and debugging in a little more detail than other available comparisons do and from the engineer perspective of troubleshooting and debugging cloud-native apps.
Python Logging
Logging is very similar between the two networks, but has some subtle differences.
Flask logging relies on Python’s built-in logging functionality. Python will default to WARNING if you don’t configure logging. The Python logging module comes with the logger interface, handlers, formatters, and filters for params.
Django has an advantage here, as Django loggingextends Python’s built-in logging power. You can configure this in your settings.py file under LOGGING.
Python doesn’t have robust native metrics. But there are plenty of metrics plugin options for Django and Flask. You want to get the basics: downtime, error handling, response time, CPU usage, and know how to add custom metric categories. The near-standard way of monitoring applications now is with Prometheus, and there are open-source instrumentation available for each framework.
You can use these implementations to visualize the metrics, but many choose to connect Prometheus to Grafana or another third-party app.
Next, configure the following files. These samples are straight from the GitHub repository.
settings.py:
INSTALLED_APPS = [
   ...
   'django_prometheus',
   ...
]

MIDDLEWARE = [
    'django_prometheus.middleware.PrometheusBeforeMiddleware',
    # All your other middlewares go here, including the default
    # middlewares like SessionMiddleware, CommonMiddleware,
    # CsrfViewmiddleware, SecurityMiddleware, etc.
    'django_prometheus.middleware.PrometheusAfterMiddleware',
]
The repository includes instructions for further monitoring targets, like databases, caches, and models.
Computer models.
Not supermodels.
…
Just clarifying.
Flask & Prometheus
Installation works much the same way with this prometheus-flask exporter:
pip install prometheus-flask-exporter
Python Distributed Traces
OpenTelemetry is currently the standard for distributed tracing. OpenTelemetry provides documentation for instrumenting both frameworks. Both have simple implementations and a separate method of instrumentation with SQL commenting.
Built-in Python Debugging Options: There is built-in Flask debugging, based off the Werkzeug dev server. You can see the debug display by default at port 5000. Django might support more complicated projects, but if Flask projects are for individual components like microservices, it might be a boon for someone breaking into cloud development.
That’s an even bigger point of differentiation when you pit Django vs. Flask: when you realize that Django doesn’t have built-in debugging.
For a beginner, this probably should be the deciding point. Flask’s built-in tooling makes learning from your coding mistakes much easier. Plugins and third-party tools, at least on a basic level, aren’t an issue (once you get into deploying these projects, you’ll almost certainly need a remote or live debugging tool).
Even though Django has the advantage of supporting more complex apps, Django’s monolithic approach can itself be a drawback that negates the advantage.
For-Python IDEs: ”External debuggers, such as those provided by IDEs, can offer a more powerful debugging experience than the built-in debugger.” — Flask docs
You also have the option to go through an IDE like PyCharm to debug your Flask server or Django templates (note that template debugging is a paid feature).
Configuring these settings can get complicated though, and might be more difficult if you’re trying to do a remote debug for these deployments (remote PyCharm debugging is less effective in certain situations).
Live Debugging Python: A live debugger mitigates the issues with a remote deployment. Rookout’s Live Debugger, for example, also has uses similar and simple configurations for Django and Flask. Live debugging allows you to continue running your code without stopping it, without rewriting it, and without redeploying it. The big advantage is that a live app can continue running in production and be live debugged at the same time .
# starts the server (default URL: http://localhost:5000)python flask_rookout.py
Conclusion
No matter which you go with, you’ll contend with some limitations while being bestowed with the power to choose. Flask is a dynamic, lightweight framework while Django is incredibly nimble for a full-stack Python framework. Both Flask and Django benefit from third-party observability and live debugging support.
No matter the framework, developer-first observability is critical for getting to the root causes faster. You will want to move as quickly as possible to detect root causes of problems while minimizing inconveniences like restarting or rewriting your application.
Whether you drink Coke vs. Pepsi, follow the Yanks vs. Sox, or use Django vs. Flask, you should get a more detailed look at using Rookout as part of your Flask or Django deployment. The best part is that you can sign up for a free Live Debugger demo.
What a time to be alive! The information age we are currently in has given us more data and choices about, well, everything. But let’s be honest, do any of us actually feel like we’re more informed than we were?
Because all this information comes with more choices. Expanded choice is actually an “explosion of choice” – in other words, if the world were a restaurant, the menu is so long you spend more time choosing your order than actually eating it. It’s the same everywhere. It happens with medical information, with computers, and definitely with what software we choose to work with. A great example of this is would be the extremely large JavaScript and Node.js ecosystem.
Node devs have a variety of implementations and frameworks to choose from, two of the most popular being Express.js and Nest.js. That duo sees a lot of competition on its tail from other networks and libraries that nearly function as networks, but for now, they are the main go-to answers to JS developers’ questions.
For starters, Express.js and Nest.js are among the most popular backend frameworks for Node.js development. Express is by far the most used of all the Node frameworks, but Nest is newer and more robust. Let’s dive into the differences and see which will be the best fit for you.
Popularity
Python ∙ Java ∙ Go ∙ .NET ∙ Ruby ∙ Node.js & MORE. Rookout covers it all.
Express is still the most popular of the two frameworks, as it’s been around longer. But Nest, while more complicated, has been gaining ground consistently. If you grade their popularity based on GitHub stats, Express leads at around 58,000 to 49,000. As for forks, Express leads about 9,800 to 5,800. But Nest.js is in 2nd place for Node.js backend frameworks on both those marks.
Last year’s State of JS survey considered programmers’ favorite frameworks and JS tools, including frameworks according to usage, satisfaction, and even awareness. Express sees much wider use (81%) versus Nest (45%) – after all, Nest is newer. Still, their favorability is neck and neck: 91% love Express; 88% love Nest.
What is the consensus in surveys of users?
Satisfaction: Express 88% vs. Nest 85%
Usage: Express 81% vs, Nest 19%
As you can see, usage isn’t the best indicator of applicability. Both score high on the satisfaction side in the State of JS survey, and they’ve both likewise hovered in that ~90 range for several years. There are plenty of people using both regularly, but when should they use them? And secondly, what sets them apart?
Express Code Samples
Express is relatively straight-forward when it comes to setting up a basic app. After installing, set Express as a constant with the require() function in your main app file.
Nest creates a more complex, but consistent architecture for its apps. It uses three primary files, by default, for every application: 1) main.ts, 2) app.service.ts, and 3) app.module.ts. To get started with Nest, download the npm package.
Install Nest.js:
npm i -g @nestjs/cli
Nest.js Hello World!
The Nest.js docs example implements Hello World in a separate file from main.ts: the app.service.ts file, which also depends on an app.module.ts file.
<strong>main.ts</strong>:
import { NestFactory } from '@nestjs/core';
import { AppModule } from './app.module';
import { AppService } from './app.service';

async function bootstrap() {
  const app = await NestFactory.createApplicationContext(AppModule);
  const appService = app.get(AppService);
  console.log(appService.getHello());
}
bootstrap();
app.service.ts:
import { Injectable } from '@nestjs/common';

@Injectable()
export class AppService {
  getHello(): string {
    return 'Hello world!';
  }
}
app.module.ts:
import { Module } from '@nestjs/common';
import { AppService } from './app.service';

@Module({
  providers: [AppService],
})
export class AppModule {}
Express.js Philosophy: Unopinionated
Express.js is a “fast, unopinionated, minimalist web framework” if you go by its tagline. It’s a thin layer of features on top of Node.js, reflecting a cautious approach to augmenting Node. It also serves as part of the foundation of many other frameworks (not just Nest.js). That list contains FoalTS, Feathers, KeystoneJS, Kraken, Expressive Tea, and a bunch more.
You can use Express.js together with other frameworks like Meteor.js or AngularJS. It’s also extremely accessible – simple and easy to learn.
Express is considered unopinionated while Nest.js is very opinionated. Express reflects the general approach of Node.js. There is more than one way to spin an app. That can give project managers a lot of options when it comes to starting workflows. So in a head-to-head Nest vs. Express bout in the ring, Express might see itself as the seasoned veteran.
Nest’s main concern is that those numerous options can get confusing.
Nest.js Philosophy: Opinionated
Nest.js is itself an extension, or abstraction on top of Express.js, using TypeScript as its main language instead of JavaScript, as well as dependency injection and modularity as part of its opinionated approach to coding (more on that later).
Kamil Myśliwiec, Nest’s creator, saw a gap for scalable server-side development for Node apps, It is also dubbed ‘Angular for the Backend’ by some, given Angular’s inspiration for Nest.js’s structure. On the heels of that approach, Nest.js functions as an abstraction layer on top of other frameworks like Express.js or Fastify (or to look at it another way, treats Express.js more like a library). Nest also defaults to TypeScript as its lingua franca, which itself adds structure to vanilla JS. So in a contest of Nest vs. Express, Nest might see itself as the younger and stronger competitor.
Nest.js’s philosophy builds off a “convention over configuration” approach. It relies on modules to break code into digestible, almost brick-stackable sections, adding a lot of order to chaos. Nest also imposes dependencies, filters, guards, and controllers to create consistent approaches to app architecture. All in all, as with any prescriptive framework, a lot can be prepped out of the box – middleware, logging and error handling, parsing, and more.
Modularity becomes a major factor in comparing how the two networks tackle core tasks. There are a lot of differences to consider, but let’s take a look at just a few: routing, middleware, and observability.
Express.js vs. Nest.js on Routing
Routing is the process by which an app or one of its components responds to a client request at an endpoint. Routing can be done via different methods and can create paths to multiple destinations. Specify a ‘callback function’ (a.k.a., a ‘handler function’) for the app to call when it gets a request. What the function does will depend on 1) which endpoint the request is routed through, and 2) which HTTP method it is using.
Nest.js uses a routing module to accomplish this. Use the RouterModule from the @nestjs/core package to match up the @controller decorator and @method decorator. You can also create a heirarchy of modules through the route/path chosen. Consider this example based on the one provided by the Nest.js docs.
Middleware is at the center of Node.js frameworks and apps. It comes in the middle of the request/response cycle. For Express, by their own admission (via its documentation), Express offers “minimal functionality” and is “essentially
There’s router-level, error-handling, and application-level middleware. It can be built-in or provided by a third party. As of Express 4.0, there are only three purely built-in middleware functions specifically for static assets, URL-encoded data, and JSON. All of them operate as modules.
Nest middleware is equivalent to Express middleware, according to Nest.js documentation. But with the structure Nest offers, its implementation can be slightly different. You can use custom Nest-native middleware in a class though using the special NestMiddleware interface in the @nestjs/common package. You can also do it through a function.
Node Debugging
Debugging Express.js
The Express.js debug augments console.log. You have to configure it to run for any apps you generate in Express. So if you generate an app with the express <app-name> command, configure debugging with:
DEBUG=ExpressjsappImade:* node ./bin/www
The command DEBUG=express* will display all internal logs – routing, middleware, requests, responses, and application mode.
DEBUG=express:* node index.js
There are five debug parameters in Express.js to know:
DEBUG
DEBUG_COLORS – Use color highlighting with the debug output
DEBUG_DEPTH – How deep you go with your debug log information
DEBUG_FD – A description of the file where to write debug output
DEBUG_SHOW_HIDDEN – Get granular and look at hidden properties in the logs
Debugging Nest.js
Debugging Nest.js isn’t as complicated as it might first seem. Nest currently lacks specific docs about debugging, which might be confusing given all the moving parts in the Nest architecture.
For a basic Nest.js app, you can go through VSCode, IntelliJ, or WebStorm via the package.json file to debug. This approach is more classic debugging, where you would edit code under “scripts” in the configuration file:
"start:debug:" "nest start --debug --watch"
Then, in the terminal, run the script:
npm run start:debug
The quicker live debugging approach will debug the running application without having to redeploy or add anything to the code.
Rookout uses non-breaking breakpoints to allow the Nest.js app to continue running without code edits, stopping the app, or reloading it. Download the npm for Rookout, then configure the app as such:
import { NestFactory } from '@nestjs/core';
import { NestExpressApplication } from '@nestjs/platform-express';
import { AppModule } from './app.module';

const rookout = require('rookout'); rookout.start({ token: 'somerandomnumbers123457593903209' })

async function bootstrap() {
const app = await NestFactory.create<NestExpressApplication>(AppModule);
await app.listen(3010);

}
bootstrap();
Conclusion
Express and Nest bring competing philosophies to developing Node applications. Express is a minimal tweaking of what Node offers, while Nest literally builds on Express’s contributions to offer a more complex, but highly guided experience. The more organized the team is, the better to rely strictly on Express. But Nest.js offers more than just the developer’s equivalent of bumpers for bowling lanes. It embraces and offers fuller support for TypeScript, itself becoming more common.
Either way, both add a layer of abstraction to Node.js that can demand more when it comes to observability and debugging. You can trial Rookout’s live debugger in Node.js for free, and come back for more tutorials and news about Node.js.
As you could probably guess, we discuss debugging a lot at Rookout. We tackle many methods and strategies throughout all our blogs and resources. However, it only recently occurred to us that we don’t have a direct face-off of the two major methods of modern debugs: live debugging vs. remote debugging.
At first glance, this might sound like semantics, but the two terms have come to embody specific methods and protocols. Both are powerful, but there is some fine print to look at also.
Challenges to Debugging in the Cloud
Cloud-native apps are more distributed than classic programs or apps using monolithic architectures. This has to do with 1) the fact that by definition cloud-native apps live on other servers, and 2) they are probably based on microservices architectures.
To make a long story short, microservices make monitoring and troubleshooting more difficult because they disperse the individual services of an application across multiple locations: containers, pods, nodes, servers, and possibly multiple cloud-hosting providers.
Remote debugging specifically – and cloud-native observability generally – requires more sophisticated strategies to properly identify and then address errors.
Decentralized apps are harder to debug for a few reasons:
Replicating the conditions that produced a bug is difficult since microservices are distributed so widely within an application architecture.
The additional substructures – containers, instances, pods, nodes, etc. – produce their own logs, metrics, and telemetry data. Taken all together, there is a lot more noise in observability data.
What is Remote Debugging?
Remote debugging describes the troubleshooting or debugging of code that is on a separate machine, usually hosted in the cloud. Cloud servers are ubiquitous in modern development, so the simple definition of remote debugging carries with it some essential connotations innate to present-day cloud development.
Because of the wide net that a remote debugging process must cast, it’s best to focus on using either 1) tools integrated with or part of major cloud providers, or 2) to access your code with IDE to launch a remote debug session.
Remote Debugging with VSCode and Intellij
VSCode remote debugging is built-in for Node.js (including TypeScript and vanilla JavaScript). Remote debugging resources for other languages depend on plugins in the VSCode Marketplace for a given language, but their quality can vary from one to the other.
You can configure Node.js remote debugging with VSCode’s Remote Development extension, or via the Node.js debugger:
You would use the LOADED SCRIPTS feature to select a pre-loaded piece of code or load a new one. You then set breakpoints in a read-only editor. Y
ou can also set the debugger to restart once code edits have been made. You can use the Restart Frame to restart a selection of code where you make any changes.
Intellij remote debugging is more restrictive. Any app you run through Intellij must follow the default compiler setting to work at full capacity.
Additionally, according to JetBrains’ documentation, decompiled code debugging is more complicated with Intellij. You must add additional configurations to run the debugger, namely by selecting the Remote JVM Debug option under Add New Configuration.
Intellij’s emulated method breakpoints are considered superior to other varieties in Intellij, such as line breakpoints.
However, and this can be a major drawback to using Intellij in this situation, JetBrains recommends disabling emulated method breakpoints during remote debugging. Latency is an issue when using this approach, so simpler breakpoints are recommended.
Remote Debugging Cons
As a method, remote debugging falls short in several ways.
1. Admin-Only Access
Firstly, you will need admin access to the relevant server to actually apply the proper remote debugging settings – this limits who can initiate a debug session, a critical weakness should something happen in production.
That admin access issue exists in part because of the next reason: data exposure.
2. Data Exposure
Data exposure is a risk with remote debug sessions. The way traffic goes in and out between the server and your environment, plus the way data is requested, can reveal tokens and passwords to dev teams during the debug.
Add to that that internal application traffic, say between microservices or in a multithreaded environment, will complicate rooting out the cause.
3. Microservice-Based Architecture
Independent services will have different configurations relative to their code, logging practices, where they fit in the structure of the entire application, and more.
Keeping track of each and every single method of debugging is difficult, pressing on dev teams’ own bandwidth.
4. Latency
Latency is a tremendous wildcard. The strength of your connection, unaccountable factors on either side of the connection, and even your location relative to the cloud server can slow down the debug process, even leading to timeouts that further delay solving problems.
In fact, IntelliJ recommends not using ᴍᴇᴛʜᴏᴅ ʙʀᴇᴀᴋᴘᴏɪɴᴛꜱ – of all things – during remote debugs, essentially kneecapping the whole process. Other advanced features will also struggle to reach peak efficiency.
5. Kubernetes
For containers, remote Kubernetes debugging is a nightmare, to put it lightly. Even in production, where it will likely be impossible, you will need to:
Change your Dockerfile,
Rebuild the Docker image
Redeploy that rebuilt image, and finally
Repeat again and again
It’s just not efficient. If you find yourself going through this runaround, it’s definitely a shot to your time and resources. Additionally, since remote debugging can be a premium feature with many IDEs, it’s also a drain financially.
6. Serverless
Serverless setups theoretically should be more optimal for dealing with things like latency and architecture, but practically speaking it leaves something to be desired. Debugging by individual lines is sometimes unavailable.
There can still be too many kinds of microservice configurations to debug consistently, and proper permissions are still a hurdle. Latency is still an issue, and if you have a distributed team, the time to debugging will vary depending on which servers your ‘serverless’ functions actually reside around the world.
What is Live Debugging?
Live debugging has the advantage of having cloud-native needs incorporated by design. It provides logs, metrics, and distributed tracing data as part of a more holistic debugging process that uses more dynamic instrumentation to switch between log lines and to collect snapshots. It uses bytecode manipulation to run with the application so the app doesn’t have to redeploy with every debug.
Related to but more nuanced than remote debugging, live debugging parallels movements like DevOps: the tasks of development and operations overlap and dovetail.
Just like certain tasks can’t be restricted to pre-production, so too debugging must also happen in production, not just staging and development.
Debugging running code raises the need to ensure the correct version of code is being debugged, fetching your running source code to take a snapshot in the correct context with the relevant conditions.
This all takes a balance of caution and agility or speed to hone in on and remedy bugs as soon as possible immediately.
Version Visibility
In order to query the code, a live debugger has to simultaneously have the most up-to-date version of the code while not allowing the debug process to make permanent changes while it runs in production.
Live debuggers should be able to automatically load a copy of your source code’s repo while 1) not reading the source code, 2) not importing your source code, and 3) not accessing private data.
Security
Live debugging inherently must take extra care of source code as a core tenet.
The best example for live debugging comes from Rookout. Rookout loads source code either locally or from a source control management service (e.g. GitHub, Gitlab, Bitbucket, etc.), directly to your browser.
That means with a service like Rookout, your source code 1) never goes through Rookout’s servers, and 2) cannot be changed. Rookout only observes the state of an application and cannot execute code.
Rookout’s live debugger accesses apps through an encrypted TLS connection and with outbound communication, in line with industry best practices. That contrasts with remote debugging, which uses inbound connections that exposes applications to security risks. In addition,
For what data does get collected, Rookout comes with advanced redaction capabilities to further minimize PII exposure. That data is also under strict, access-controlled storage for less than a week, requiring a unique token to access.
Non-Breaking Breakpoints
Live debugging fetches source code, but does not have direct editing access. That is because of Rookout can use its Auto Loader to produce an up-to-date version. This essentially creates a copy of the very latest version of source code, which can be debugged using non-breaking breakpoints.
Non-breaking breakpoints do not require ‘breaking’ running code – devs don’t have to stopping production-live applications. There is no need to edit the code to add more log lines, eliminating the need for restarts or reloads.
In tune, Rookout’s breakpoints are non-breaking breakpoints – they don’t stop running code, or even require that you add more code in order to have more log lines. They also circumvent remote debugging’s restrictions on stronger kinds of breakpoints.
Remote Debugging
Live Debugging
Breakpoints and Latency
Breakpoints are hampered by issues of latency in remote debugging setups. Intellij considers it best practice not to use emulated method breakpoints during remote setups. Even when a remote debug doesn’t time out, the duration of the debug is unpredictable.
Non-breaking breakpoints act on a copy of the latest version of source code, so it has local access to the code sections being debugged. Live debuggers fetch the code, but don’t run it. Latency is eliminated from the equation here, as the debug only begins after fetching the code.
Security
Giving admin permissions to too many team members is just one vulnerability. Direct access by a debugger server to source code further risks exposing personal data
Direct access to source code is impossible with live debugging. Source code is never read by or stored on Rookout servers.
Limited Human Resources
You must have administrator-level access to conduct remote debug sessions. That obviously limits your whole team’s flexibility to get things done. Opening up that level of access is easy, but also a security issue.
Live debugging does not strictly require admin access. Additional security measures also allow the leeway to permit more developers to run live debug sessions themselves.
Version Visibility
There is a lot of room for error here. It’s easy to select the wrong version of source code for your debug.
Auto loading a copy of the current version of source code, without allowing change-capable access, protects the code from unwanted changes. The additional benefit of non-breaking breakpoints also closes off any need to make changes specific to debug sessions, anyway.
Live Debugging vs. Remote Debugging: Connecting the Whole Stack
Your live debugger should be able to link up with your code repositories to import code as well as to export debug data. That’s where a tool like Rookout will come in handy.
First, it syncs with source code in git repos, and allows automatic loading to make sure the correct version is being debugged when a debug session is started.
Remote debugging grew by necessity to meet the unique needs of microservice architectures that organically developed out of new cloud-native services. Live debugging is an evolutionary step for cloud-native debugging, incorporating the practical abilities to debug Kubernetes, serverless deployments, and overcoming concerns about latency and security with microservices in ways that remote debugging cannot.
Debug logs are incredibly valuable for the wealth of information they contain, but generally speaking, companies avoid collecting them in production because they are very expensive in both dollars and performance.
When we talk about production observability, we are likely spending more money for more data, data that itself might be excessive. The highest verbosity-level logs, TRACE and DEBUG, bring with them valuable data points that can help locate that needle in a haystack, but they could just as easily be heaping more hay onto the pile.
These are among the several challenges in production logging.Some of those issues are similar to debugging, but some can be pretty unique to logs.
Common Production Logging Issues & Trade-Offs
LOW-INFO, HIGH-NOISE – Most DevOps teams will limit the types of logs they keep at INFO, WARNING, or ERROR levels. These are the least verbose, and consequently the least informative, logs you can have. Despite what data they do give, they’re not specific enough and can end up just being clutter or noise. If they don’t seem worth checking, then devs might start ignoring all errors, even missing out on relevant logs having relegated them to that clutter. In other words, too many irrelevant logs will get devs to ignore logs entirely.
HIGH STORAGE-HIGH COST – By the same token, these production logs end up being stored somewhere. Even if kept for a limited amount of time, they are draining your coffers because of storage costs and performance impact.
HIGH RISK, LOW REWARD, EVEN HIGHER COSTS – It can be risky implementing these kinds of changes in a live environment, probably outweighing the likely reward of going through the trouble to implement them. And of course, there’s the expense – mo’ data means mo’ money and mo’ problems for your wallet.
SLOWED AND STOPPED APPS – Best practice in this situation would be to fully stop the application and restart it with new log settings, which is a major hit for any organization. Even with that change, controlling the amount of DEBUG and TRACE logs can become a chore in and of itself.
LOTS OF TALK, LITTLE WALK – Even if those four aforementioned forks in the workflow weren’t issues, you now have a deluge of extra log lines to deal with in parsing and storage.
Instead, you need to understand the best practices for live logging. Below are some of the main points in more detail.
Dynamic Log Verbosity
Log verbosity is a double-edged sword. Clearly, more data means more chances to discover something important. But it can just as easily be a lot of noise.
Let’s take the developer-first approach for a second: Is this making your dev team’s job easier? If not, what would? Make it simple to switch between log levels.
Everyone on your team – with a single click and without relying on anyone else’s permissions – should be able to change log levels. They should be able to quickly shift from DEBUG level to TRACE and back again, or adjust it to INFO or ALERT, when the situation calls for it. Notice the need, implement it, and that’s it. There’s no need to bury a reconfiguration into a to-do list. This is a more dynamic, developer-friendly setup for logging.
Observability solutions should take pains to reduce that noise by 1) highlighting certain logs over others and 2) applying context to consider which logs to save and which to get rid of. The option to further filter those results on a conditional basis – e.g., don’t log geolocation on Sundays – goes hand in hand with that.
Contextual Filtering
What makes the biggest difference is applying logic to filter what information you actually need from within your logs. Contextual filtering would create a set of conditions for highlighting certain kinds data and trimming others. From the get-go, this cuts down on a lot of the noise.
Additionally, you should have more granular control over logs. When identifying user data, drill-downs should take you to certain sets of, or specific individual, accounts and users.
All developers can view the logs they want in a controlled environment without teammates having to see them in the main account.
Finally, verbosity should be adjustable by other conditions such as specific services, selected functions, or designated files. Of course, these settings should be dynamic – you won’t know immediately what settings to impose on each function, service, or file throughout your source code, at least not immediately. As issues present themselves, you can adapt those settings and increase logging precision.
Log Aggregation
Integrations might go without saying, but in a crowded marketplace, this is one way to separate the grain from the chaff. Use cases for tools change often, so while you might not be keen to make frequent changes to your tech stacks, you want the flexibility to mix and match different options.
If you have a certain tool designated for individual logging tasks, and yet another for storing those logs, you’ll need maximum flexibility and as many options as possible for exporting those logs.
Enriching Your Data
Live logging should complement your existing tools. An ideal live logger would be flexible enough to produce rich logs for all log levels – DEBUG, TRACE, ALERT, and the rest. These more verbose logs need to be properly used in the correct context and honed in on the relevant data without the torrential downpour of unnecessary information, and then switched off when you don’t need them.
Efficient Live Logging in Production
There are a lot of tools out there for observability, but few can properly juggle all these above considerations. Rookout’s Live Logger does this, built with the same philosophy as our Live Debugger to maximize productivity – with a click of a button you can crank up your log verbosity on verbose logs, get the data that you need, then switch them back off immediately after. TRACE-level and DEBUG-level logs are incredibly valuable weapons in the Dev and DevOps arsenal.
It is a post-modern tragedy when teams can’t use them in production. The Live Logger changes that with contextual filtering and dynamic log verbosity. Finally, you retain your existing logging tools for storage and organization through our integrations with tools like Dynatrace, Datadog, Sumo Logic, and more. Give the Live Logger a spin.
Kubernetes is both revolutionary and “diffusionary.” It is a complete restructuring demanding a whole new slew of companion and support tools to cover and prop up the entire ecosystem. There are literally hundreds of tools – both open-source and proprietary – designed specifically with k8s in mind.
Choosing your Kubernetes tech stack seems arduous – the ecosystem is huge. A comprehensive list of all the tools and their debugging methods is beyond the scope of this particular article. Developer-first observability demands simplifying this cacophony of tools. Getting a complete picture of and debugging your Kubernetes deployment requires an overarching tool and strategy that can be more direct and efficient than working through every single tool in the stack. With that being said, most individual tools provide internal observability. Knowing how to get those can give you an advantage as a developer.
It is impossible to create an exhaustive introduction to every kind of Kubernetes tool, but this list will cover the most fundamental ones of the major essentials and the major players in each of those categories.
Debugging K8S Service Meshes & Ingress Controllers
We already have orchestration and deployment tools, so why do we need something that sounds redundant? This gets to the crux of Kubernetes coordination between microservices. Service meshes and ingress controllers serve as configurable abstraction layers to control the flow of traffic in, and out, and within Kubernetes.
Service meshes coordinate between services within Kubernetes (i.e., east-west traffic).
Ingress controllers coordinate traffic flowing into (ingress) [and possibly out of (egress)] Kubernetes (i.e., north-south traffic). In Kubernetes, you would use the Kubernetes API to configure and deploy them. They:
Accept ingress (incoming) traffic and route it to pods by load balancing
Monitor pods and auto-update load balancing rules
Manage egress (outgoing) traffic communicating with services outside the cluster
It’s debatable if you really need both of these kinds of tools for your Kubernetes stack, so in effect all the tools in the two categories are competing with one another. Additionally, you can also throw API Gateways into the mix here, which like ingress controllers might control ingress traffic and egress traffic.
The three major service meshes are Istio, Linkerd, and Consul. They use a “control plane” managing cluster-level data traffic and a “data plane” to deal directly with functions processing data between services within the mesh.
1. Debugging Istio
You can get a good overview of traffic in your Istio mesh with either of these two commands:
istioctl proxy-status
istioctl proxy-config
You can also go through the debug logs. Note that debug is one of five possible outputs for Istio logs (the others are none, error, warn, and info). Please know that debug will provide the most data, and some devs see Istio as pretty info-heavy when it comes to logs.
The following example defines different scopes to analyze:
The default method for debugging is using a debug container (a debug sidecar). However, Linkerd debugging works differently depending on the kind of application you’re using.
Consul debug commands are extremely simple in Consul. Use -capture to define what you want to analyze, plus add in arguments for intervals, duration, APIs, the Go pprof package, and more.
consul debug -capture agent -capture host -capture logs -capture metrics -capture members -capture pprof -interval=30s -duration=2m -httpaddr=126.0.0.1:8500
4. NGINX Ingress Controller
NGINX is interesting because it’s easy to mix up what it dubs two separate tools: the NGINX Ingress Controller and the NGINX Service Mesh. This section looks at the ingress controller. To get a feel for how NGINX situates the two tools, their architecture diagram helps a lot:
NGINX architecture diagram (ingress controller vs service mesh) (Credit: NGINX documentation)
There are two types of logs you can cover here: for the NGINX ingress controller itself, and/or the more powerful overall NGINX logs.
Debugging with NGINX Ingress Logs
You can change the log level to debug by adding –v=5 to the -args section of your Kubernetes deployment. Please note that an NGINX deployment must be built with –-with-debug to have debug logs later.
When you configure NGINX logging, you have to set up error logs, which are the most important for debugging.
But before you do that, you need to make sure NGINX (if working with the open source version) is compiled with the option to debug in the first place (yeah, this feels unnecessary, but that’s the way things are for now, as NGINX tries to manage how much it commits to storing logging data. Of course, the option could just be off by default, but we don’t live in that alternate reality).
First, download the open-source version of NGINX. Then begin the compiling process.
nginx -V 2>&1 | grep arguments
Add the –with-debug parameter
./configure --with-debug
Compile:
sudo make
Install:
sudo make install
And restart.
Now, phase 2. Double-check that the installation came –with-debug available:
nginx -V 2>&1 | grep -- '--with-debug'
Open the NGINX config file:
sudo vi /etc/nginx/nginx.conf
And set the debug parameter:
error_log /var/log/nginx/error.log debug;
There are more options available in the NGINX docs. As one last thing, I’ll add you can also use Syslog as an alternative, which requires a syslog: prefix, then designating a server (by IP, UNIX socket, or a domain).
The Traefik Kubernetes Ingress controller is another ingress controller option. It manages Kubernetes cluster services; that is to say, it manages access to cluster services by supporting the Ingress specification. Don’t mix it up with the company’s other tools: the Traefik Mesh and Traefik Gateway.
Like NGINX, you can set both/either Traefik Ingress logs and/or general Traefik logs and debugs.
Traefik Debug Logs
You can configure either debug-level Traefik logs or debugging through the Traefix API debugs. Both can be done in one of these three ways: through the Traefik CLI, a .yaml config file, or a .toml configuration file.
Log-wise, it’s a quick three-step process: 1. Set the filepath. 2. Set the format (json or text). 3. Set the level. This example shows how to do it in the Traefik CLI, but you can also use YAML or TOML config files.
DEBUG is one of six log levels in Traefik, but the default is ERROR (the others are PANIC, FATAL, WARN, and INFO).
Traefix API Debugging
In the CLI, set up the API:
--api=true
Then you will have different config options for Kubernetes and other container orchestrators or infrastructure managers (Docker Swarm, Docker, etc.). Of course, let’s show a Kubernetes CRD example (in YAML), based on the one from Traefik docs:
apiVersion: traefik.containo.us/v1alpha1
kind: IngressRoute
metadata:
  name: traefik-dashboard
spec:
  routes:
  - match: Host(`traefik.progress-regress-we-all-scream-4-ingress.com`) <em>#this is clearly an example please do not visit this url and take no responsibility if it is real and unsafe</em>
    kind: Rule
    services:
    - name: api@internal
      kind: TraefikService
    middlewares:
      - name: auth
---
apiVersion: traefik.containo.us/v1alpha1
kind: Middleware
metadata:
  name: auth
spec:
  basicAuth:
    secret: someFancyShmancySecretiveIngressiveSecretNameShorterThanThis
Then set it to debug in the CLI:
--api.debug=true
Debug Kubernetes Tools for Infrastructure Management
Package Managers, Infrastructure-as-Code, configuration managers, automation engines, etc. This is a rather eclectic category because a lot of competing tools take different approaches to the same tasks, sometimes resulting not in direct competition but in complementary tooling.
A non-exhaustive Venn diagram comparing various Kubernetes automation, package, and configuration tools (Gedalyah Reback)
As such, many of these tools might be able to serve a purpose that the other tools on the list can’t. At the same time, while you can usually extend them to complete other kinds of tasks, it might be very difficult compared to one of the alternatives. Because of that overlapping, Kubernetes architecture diagrams can look like Frankenstein apps.
Helm
Ansible
Terraform
Pulumi
Kustomize
Main tool identity
Package Manager
Config managemen
Infrastructure-as-Code
Infrastructure-as-Code
Config management
Config management
Yes
Yes
No
Yes
Yes
Resource provisioning
Yes*
Yes
Yes
Yes
Yes*
Package manager
Yes
No
No
No
Yes
Application Deployment
Yes
Yes
Yes***
Yes
Yes**
* in combination with CrossPlane, Helm and Kustomize can provision cloud resources ** </span><span style="font-weight: 400;">kubectl apply -k</span><span style="font-weight: 400;"> (docs)*** when you provision K8S resources with terraform provider is actually deploy
Still, each use case is different. No matter which or how many of these tools you end up using, you should know where and how to debug them.
With Pulumi, you can write – or define – your infrastructure with fully-fledged programming languages: Go, Python, C#, vanilla JS, and TypeScript. Terraform uses HCL to define infrastructure and then a JSON state file to track it. Ansible though uses YAML to define infrastructure and is inherently stateless. The options expand from there.
Helm has become the de facto Kubernetes package manager for a lot of people. It utilizes complex templates for Kubernetes deployments that it calls Helm Charts. Templating or building out charts for deployment is a process in and of itself. There are a few ways to debug Helm templates.
The –debug Flag
Firstly, check what templates you’ve already installed:
helm get manifest
Then let the server render the templates and return the manifest with it:
helm install --dry-run --debug
Or…
helm template -debug
You can also use the –debug flag with most other other commands as well. It delivers a more verbose log response for whatever you’re doing. You can defer those logs to a specific file as such:
Terraform isn’t natively designed for Kubernetes, but it’s become a prevalent option. Terraform uses a system of support packages it dubs providers, and has constructed its own Kubernetes provider. It uses the HashiCorp Configuration Language (HCL) to deploy and manage Kubernetes resources, clusters, APIs, and more.
Alternatively, you might prefer to work through a provider like hashicorp/helm, which is more powerful than the vanilla Kubernetes option. You can use Terraform logs to one of several log levels, including debug. There are also specific strategies for debugging Terraform providers, or plugin integrations.
Terraform Debug Logs
You can log Terraform itself with TF_LOG or TF_LOG_CORE, or Terraform and all providers with TF_LOG_PROVIDER. You can extend the log setting to only one specific provider with TF_LOG_PROVIDER_<providername>.
TF_LOG_PROVIDER=DEBUG
Optionally, you can use stderr for logging, but you cannot use stdout in Terraform as it’s a dedicated channel already.
You can use the native tflog package for structured logging, then set the log level. Depending on whether you’re using the framework or SDK Terraform plugin, you can set what contexts create debug logs. Consider the following example from the Terraform docs:
You might have guessed from the spelling that this one is Kubernetes-native. Kustomize is a configuration manager, getting its name from customizing config files. Instead of relying on templating like Helm, it prefers to work strictly with YAML files, even using YAML files to configure other YAML files.
Now, for anyone who wants to debug Kustomize itself, independent of kubectl and other elements, it’s more complicated. Sort of like looking for mentions of Hell in the Old Testament, it’s impossible to find any documentation on logging, tracing, and especially debugging for Kustomize itself. There have been demands for logs pertaining strictly to Kustomize for sometime, but there are workarounds.
You can work the log_level as debug within your deployment.yml file inside your app.
       env:
        - name: LOG_LEVEL
          value: "DEBUG"
Afterwards, you would add your kustomization.yml file, delete your original resources and then redeploy the application.
9. Debugging Ansible
You have to enable the debugging setting, which is off by default. Next, you can utilize the debugger keyword, as in this example from the Ansible docs:
- name: Execute a command
  ansible.builtin.command: "false"
  debugger: on_failed
Enable it globally in the ansible.cfg file in the [defaults] section:
[defaults]
enable_task_debugger = True
10. Debugging Pulumi
Pulumi is one of the newer kids on the block, primarily an IaC tool. It works by exposing the Kubernetes API as an SDK to deploy and then manage IaC with containers and Kubernetes clusters among the infrastructures it works for. That being said, Pulumi tries to work with tools already widespread in the ecosystem, so it utilizes TF_LOG and its rules just as in Terraform.
Pulumi also has native log configuration, which can operate in regular programming languages instead of a CLI/domain-specific language. This example covers Java:
Additionally, you can implement the Pulumi Debug API. Pulumi’s docs use this multiple-choice style example with different options listed in the parameters:
Each Kubernetes tool has more than one way to debug its services and implementations. Some have different approaches to debug logs while others include trace collection as options. Developer-first observability would demand you find the options that provide the clearest answers and easiest setup. There is also the probability some competing tools can cooperate within the same Kubernetes stack. Hopefully, this overview gives you a sense of what’s out there, and which tools you’d want to use for Kubernetes debugging.
But getting a true overview of what’s going on throughout your Kubernetes stack requires a truly overarching tool. Rookout prioritizes developer-first observability, easing that Kubernetes debugging and observability adventure. Rookout lets you debug multiple instances simultaneously, identify what clusters need your attention, and visualize your containerized application’s mapping. The Rookout SDK can work with all the major Kubernetes engines at the code level: GKE, AKS, and AWS EKS. Check out our tutorial for debugging Kubernetes on the fly and subscribe to our newsletter for more updates.
Carbonated: Why Google’s Enthusiasm for Go Fizzled as a C++ Successor
Liran Haimovitch | Co-Founder & CTO
July 28, 2022
9 minutes
Table of Contents
“Within C++, there is a much smaller and cleaner language struggling to get out” – Bjarne Stroustrup, creator of C++ in The Design and Evolution of C++
Developers are talking about Google’s latest creation: Carbon, a supposed wunderkind programming language that will save the technoverse from C++ and serve as its successor or replacement. Just like a rehashed Hollywood blockbuster about a supposed messiah, we’ve heard this story before. The 2000s saw more than one language try to fix C++’s minuses. The two big ones were Rust (backed by Mozilla) and Go (a.k.a. Golang, initiated by Google).
We should note that Google had been working on the Carbon programming language for at least two years before announcing it. The oldest pull request in the Carbon git is from April 30, 2020. Google’s team has embedded a lot of work into the repository already, including detailed outlines of the philosophy and goals for portions of and the entirety of the project.
History Threepeating Itself
C++’s creators had their own goals: to build in higher layers of abstraction into C. They took on immense amounts of “technical debt” from C, ensuring C++ could be backward-compatible to compile C code. But over time, accommodating that with feature after feature made C++ overly complicated. Now, building on decades of experimentation and backward compatibility, C++ just literally might be the most convoluted language out there.
That got a lot of developers motivated in the 2000s to fix the new problem.
Google conceived of Go as a replacement for C++, the same motivations behind another major language: Rust. Go’s initial approach was celebrated: something straightforward, easy to learn, and simple to understand. When Go and Rust were both production-ready, Go could tout that simplicity against Rust’s extreme learning curve. Additionally, the performance advantage Rust could claim over Go wasn’t worth the tradeoff to many developers. Rust sacrificed compile time for runtime, for instance.
So are we about to go reiterate this process (tri-iterate? “three-iterate”?)? 1) C → C++, 2) C++ → Go, 3) Go → Carbon?
Well, yes.
Go has failed to replace C++. But WHY? Why did it fail? And why did Google feel that the best way forward was to create another new language to get around it? Here are the major reasons:
1. Go-C++ Interoperability
Anything taking over for C++ has to at least work with C++. While the cgo API is definitely there, using the two together is not that much fun.
For most practical use cases, you will find yourself wrapping your C++ code with a C API (it is called CGO after all!) which can amount to a fair amount of boilerplate code.
Along the way, you are going to lose some type safety, proper destructor support, and have to work around memory management. Add to that the fact you will likely find yourself writing an abstraction layer on the Go side. Before you send it through, you are quite likely to end up with a Frankenstein project, just like this team.
2. Interoperability Paradigm Shifts
Go has a peculiar, but highly efficient, concurrency model focused on goroutines. Using user mode scheduling along with miniature, dynamically growing stacks will get you a level of parallelism you can only dream about in other languages.
Unfortunately, this magic is utterly unavailable for your C++ code, meaning every cgo invocation goes through a move from a mini-stack to a full-blown stack and back again. As you might guess, this is quite heavy on performance, making every invocation a significant burden.
Working around this limitation to keep your interoperability API efficient will likely make it even more complex and cumbersome to use, while winning you some additional boilerplate code to write.
4. Go’s Runtime
Go has a fairly large and complex runtime, which makes it less desirable than C++ in many use cases. While the runtime comes with a lot of magic tricks such as best-in-class garbage collection, it’s not without its baggage. While you can hardly compare it to the Java Virtual Machine languages or .NET runtime, it’s not something you can easily fit into embedded devices, operating system kernel mode, or other similar environments.
5. Pointers are Important
When writing system-level software, raw pointers are a key element in getting the best performance from your hardware and operating system. Whether you are offloading encryption to the CPU, checksum calculations to the network adapter, or memory operations to the DMA controller, you need easy access to the underlying memory.
Go’s approach for pointers and direct memory access is far from its strong suit, which can make writing encryption, networking, or storage software a headache.
What Carbon Will Try to Do
What does Carbon want to do differently to ensure it succeeds as an adequate C++ successor where Go failed? They’re going to tie the two languages together as tightly as possible with as little bridge code as possible as well. And as a caveat, Go did succeed in some things, such as being easy to learn. Carbon’s builders plan to emulate that.
Related goals include minimal bridge code between the two languages, support for basic C interoperability, support for advanced C++ features, and mixing the two languages’ toolchains.
Quick adoption: It’s supposed to be a piece of cake for C++ developers and easy to work with immediately for C++ applications. Replacement for C++ isn’t a snap process, but it can be made relatively quicker.
Bidirectional interoperability with C++: Packages and libraries made for C++ will work for Carbon, and libraries or packages made for Carbon will work for C++. A formal Carbon-C++interoperability layer will access certain C++ APIs from Carbon and vice versa.
Memory Safety: You have more control over memory safety so you don’t have to compromise on things like compilation time like you have to by default in Rust. You can run in three modes: debug, hardened, and performance. C++ enables uninitialized variables which can later cause memory access bugs.
Generics: C++ relies on templates to support parameterized types, but they can be complex. C++ templates also bog down compile time. Generics, in C# for instance, work in runtime. The idea behind Carbon generics is to check function calls independently, send earlier error message when necessary, and speed up builds.
Memory access: Carbon kept the basic concept of pointers’ value while giving up on most of their complexity. Carbon gives you the two most basic operations of derefence and address-of, to make your life easier.
Wait and C
Google first announced Go in 2009, but the language didn’t hit full production readiness until 2012 (at Rookout, we added production grade support in 2021. Thanks for waiting!). Expect a similar amount of time between now and Carbon’s production readiness. And yet, being backed by Google will likely make Carbon a contender in the A-league of software languages, not to be known merely as C++’s substitute. In its early days, developers should still expect to write Carbon code in a text editor and do things the hard way, but if Carbon grows as planned, that might not be necessary for near-to-mid-future classes of devs. But then again, it might end up like D.
Rust and Go in some ways are polar opposites. They are defined by their respective approaches to code. Rust is scrupulous, meticulous, and demands painful attention to detail; Go is laidback by contrast, easygoing, and simple. They both prize efficiency, but one in the means (Go) and the other in the ends (Rust). A true Go vs. Rust battle needs to compare the two languages in more depth.
Golang and Rust owe their births to loathing for other systems languages (and by languages, I mainly mean C++). Mozilla backed employee Graydon Hoare’s side-project for a C++ alternative, which became Rust. Google designed Go to improve productivity and simplify development.
Go vs. Rust: They’re not so different if you pretty much ignore everything about them
But the languages treaded on two very different philosophies to build themselves out. Rust’s creators wanted to improve resource control, security, and concurrency. They achieved this by creating a complex programming language, but one that is indisputably one of the fastest in popular use today. Go went for accessibility, achieving similar goals like high concurrency while gaining a rep for being one of the easiest languages to learn.
The difference in complexity is the main determining factor for a lot of projects – the simpler the code, the simpler the development. But that isn’t the only reason to choose one language over another. This overview will compare and contrast Go vs. Rust with a focus on debugging and observability. We’ll review the most common points of comparison between the two before going into the different options for troubleshooting, debugging, and gaining visibility into apps built with either of the two languages.
Learnability
There’s an absolute contrast here. The languages treaded on two very different philosophies to build themselves out. You can see the difference in how they say “Hello.” Go has only 25 keywords while Rust at the time of writing has 39 keywords (with another 13 reserved for future versions).
Rust’s creators wanted to improve resource control, security, and concurrency. They achieved this by creating a complex programming language, but one that is indisputably one of the fastest in popular use today.
Rust also uses some different names for key concepts. It refers to its packages as crates. It also relies heavily on macros – macros are pre-processed versions of functions, while functions are compiled, so they involve no runtime. Languages like C, Lisp, Scala, Erlang, and Elixir also use them.
On the flip side, Go went for accessibility, achieving similar goals like high concurrency while gaining a rep for being one of the easiest languages to learn.
//Hello World! in Go
package main

import "fmt"

func main() {
    fmt.Println("Hello World!")
}
Go does not support macros, but rather constants. The idea is the same – to call a consistent function or value – but the key difference is here:
Rust’s macros are pre-processed. Go’s constants are compiled by the compiler.
Goroutines vs. OS Threads
Go is also notable for its use of a lightweight kind of thread called Goroutines. Goroutines are the most notable example of something called green threading (or virtual threading). They’re designed to work like multithreaded environments but can operate outside of environments that don’t support native threading. VMs or runtimes handle scheduling in green/virtual threads.
Just the same, Goroutines operates with one runtime. But, there being less system overhead because they are managed efficiently by the user-space Go runtime, because they don’t rely on operating systems, helps Go with fast start-up times and fast clean-up times. Additionally, they’re considered incredibly easy to use by simply calling the given functions with the keyword go.
//Seriously a goroutine is this simple
go functiontocall()
Goroutines are particularly efficient because they also allow coordinating data using channels, which can balance the activity of each Goroutine to clamp down on latency.
Rust takes the more traditional approach. To avoid adding overhead by using a runtime, Rust actually dropped native support for green threads and switched to operating system threads early in its history. By default, Rust uses a 1:1 model – one operating system thread to one language thread. As per usual, there are many crate options for using some other kind of model.
Memory Safety
There’s no rust on Rust’s memory. Poor puns aside, Rust has a tremendous emphasis on memory safety and Rust won’t allow for unsafe use of memory during compilation. The practical reason behind this is because most memory errors occur in production and often lead to vulnerabilities; this preempts that.
All data inputs have to have been initialized before use. Rust also doesn’t permit null pointers or dangling pointers.
Go is also considered a memory-safe language, but not to the extent that Rust is. Go also blocks dangling pointers and limits memory leaks.
On memory space, Go uses garbage collection while Rust uses something called ownership and borrowing (every object is owned by someone, who can then lend it out).
Go’s garbage collector periodically works in the background to free up data once you hit some pre-specified value. This will add to system overhead though.
Compiling Go vs. Rust Compiling
That complexity makes the difference when the code compiles. Go compiles straight to machine code, cutting out “middle men” like virtual runtimes or other mid-level interpreters. Other factors, like how Go dependencies work, definitely help with compilation speed.
Rust has made improvements over the years, but still can’t stand up to Go. Nicholas Nethercote, a former engineer at Mozilla, kept detailed notes on the issue and notes continued improvement on benchmarks year to year. See this example of Rust benchmarks in 2019.
Spider-Man compiling Rust instead of fighting crime
Rust sacrifices on compile time in order to achieve strong performance later. Rust’s memory safety implements certain things during compilation time to protect the code from bugs and vulnerabilities. Rust’s macros are precompiled. Rust’s legacy issues related to single-threaded compilation, build scripts, and periodic code generation for individual crates also contribute to slow compilation according to Brian Anderson’s extensive review of the problem, but they are all part of the plan.
That being said, Rust allows for more control of the build process. That might make compilation a longer process, but what comes out on the other side will be far more efficient when running.
Go doesn’t allow for that kind of control automatically. Go’s build tags give you a little control by specifying tags that will decide which files to include and preclude from the build process, however this doesn’t come close to Rust’s compilation customization abilities. Here’s an example with a build tag at the top of this
Include the file in the Go build process with this command:
go build -tags=helloworldtag
Go vs. Rust Debugging: What Do the Devs Prefer?
Go and Rust can be quite different philosophically, but they have similar options for debugging. That being said, they have several options at that. Both languages see large numbers of users leverage print statements, logging, open-source debuggers, and IDE tools to do the job. Here is a quick rundown of the main ones:
With Rust, you can use print statements [println()], logging at the debug level, or the standard built-in dbg tool to exterminate bugs in your code. Logging carries with it a constant struggle with verbosity (which is the same in other languages): How much data is too much data? Will it make tracking down the problem even harder?
This debug! macro example is partially modified from the one appearing in the Rust docs:
use log::debug;

let pos = Position { x: 3.5, y: -1.5 };

debug!("New position: x: {}, y: {}", pos.x, pos.y);
debug!(target: "location", "New position: x: {}, y: {}", pos.x, pos.y);
There are also several IDEs popular among Rustaceans, but the presumably advanced IDE tooling seems to play second fiddle to the simpler options. In fact, surveys show just that for Rust developers. JetBrains’ own developer surveys showed just that for all segments of IDE users different groups of devs. Some used VSCode, a JetBrains option (IntelliJ IDEA or CLion), and VIM.
Visual Studio Code, CLion, IntelliJ, VIM, and Sublime Text are the most common, with VSCode being the #1 choice for 40% of Rustaceans. Keep in mind though that that number comes from a JetBrains survey of its users, so the numbers for CLion and IntelliJ might be slightly higher than a true average. That being said, CLion and IntelliJ probably do represent a massive chunk of the Rust IDE marketshare.
Go Debugging
Gophers, if you will, actually widely prefer print statements and logs for debugging also, according to a survey by Golang‘s own website. Other features like unit testing and the PANIC output were the next most popular ways to debug Go. About 54% used special debugging tools like Delve or gdb on a local machine. A lot less find Go remote debugging useful, at 16%, indicating that even for simpler syntactic languages, remote debugging can be an issue. While Go is an efficient way to get programs to run smoothly and save time, it’s still bogged down for cloud-native options.
Go uses three kinds of print statements using the fmt package: fmt.Print(), fmt.Println(), and fmt.Printf(). You can also use the first two without the fmt package. When it comes to logging, the issue is the same as with most languages, in that it can lead to information overload.
That being said, Go provides a couple of extra log levels not common to other languages via logrus. Altogether, these are the seven Go logging levels: TRACE, DEBUG, INFO, WARN, ERROR, FATAL, and PANIC.
A common log at the debug level might look like this:
package main

import (
log "github.com/sirupsen/logrus"
)

func main() {
log.SetFormatter(&log.JSONFormatter{})
log.SetLevel(log.DebugLevel)
//To ensure debug logs print with other logging levels, you need the above line of code
//Such a line isn't needed for other logging levels

log.Debug("Debugging message.")

}
In terms of IDEs, there’s a similar selection like Rust for Go users: VSCode, VIM, Emacs, and Atom. JetBrains also has a specialized IDE called GoLand (many surveyed also said they used IntelliJ for Go). It’s not exactly clear what the most popular IDE in the community is.
The two above mentioned surveys are flawed on this question. JetBrains surveyed many of its own users to find 59% preferred GoLand to others; Go found a majority favoring VSCode, but they reached survey takers through a VSCode promo (to be fair, JetBrains and go.dev both admit the issue in their questionnaires). You can see our other post to read more about Go debugging.
Go vs. Rust in Popularity
On a final note, it might be interesting to look at how much developers actually work with (and like to work with) either language. Rust ranks at the top of the list in the annual Stack Overflow survey for most loved language, up there with Clojure, Elixir, TypeScript, Julia, and Python. But Go is high up there also, in 8th place.
On top of that, Rust is the most wanted language by devs who want to work with or learn something else. And Go? Right behind it at 4th place.
Of more than 70,000 devs surveyed, only 11% reported having used Go. But 9% reported using Rust. When you break down those numbers further, you find a very big difference between pro devs and current students. More programmers in training have used Rust (7%) than have used Go (5%)! Could this be a sign of things to come? Are more students skipping the easier languages assuming they can circle back and learn those later? This blog doesn’t have the answers to those questions, but the close numbers between the two in these surveys certainly make comparing them even more interesting.
Conclusion: Go vs. Rust
Go and Rust offer a lot to programmers. They are definitely both products of their time, but reflect that the developer community is itself diverse, seeing divergent paths for going forward. Both languages have their advantages, and both offer some diverse approaches to observability generally and debugging specifically. Both could do though with more advanced options to cope in cloud-native and microservices environments.
If you want to hear the latest from Rookout, sign up for product updates with our monthly newsletter!
There can be confusion out there given the size of the JS ecosystem. The differences seem pretty trivial, as a lot of tools seem to work in both limited and expanded capacities. But knowing the original or primary intent of a tool like React.js (it’s a library), can make it easier to grasp how it works and with which other JS tools. But this is where the distinctions become important – understanding the role of a progressive framework like Nest.js and how we got here.
Nest.js calls itself a progressive Node.js framework (note Vue.js also defines itself that way). Nest combines a number of developments in the world of JavaScript and positions sees itself filling in the role of providing scalable server-side development (versus frontend).
Sketching the Nest.js Architecture: JS, TypeScript, Node & Express
JavaScript vs. TypeScript
JavaScript is the blood of the web. It’s server-side, shaping web pages. TypeScript is an evolved, object-oriented superset of JS. The extra features do heavy lifting for larger JS projects, primarily by being more specific in code (e.g., explicitly id’ing types of JS variables, hence the name).
With use cases like debugging in particular, type-checking speeds up. You can check large-scale code projects more quickly.
Without supersets like TypeScript, JavaScript wouldn’t have survived in the cloud-native and microservices era.
Plain old French Vanilla JavaScript vs. Node.js
There’s no difference between “vanilla” and “French vanilla,” I just needed to add some flavor to this so I spruced up the h3 here.
Node.js is a JavaScript runtime, over a decade old at the time of writing (not to assume a 2022 tutorial’s longevity into the 2030s, but I’m an optimist).
Ryan Dahl created Node.js with the goal of giving JS (or the websites it constituted) push capability: two-way communication instead of everything depending on the client.
Node is lightweight, so is built for speed and agility – it’s got high throughput while allowing a high number of simultaneous two-way connections. You can also read more about debugging Node.js.
Node scales using a single-threaded connection instead of weaving a new thread for every new connection. Node users have a few options for frameworks, but one of the more popular ones is Express.js.
Nest.js = TypeScript + Node.js (+ other stuff)
Eventually we reach Nest, an increasingly popular “progressive” Node.js framework. Its main reason for being: application architecture. It is built with – and has in mind – TypeScript at its core while supporting basic JS. Simultaneously, it serves as an abstraction layer on top of Express.
Nest has “out-of-the-box” or ready app architecture that it says is highly modeled off of Angular. That is supposed to make it easily scalable, maintainable, testable, and “loosely coupled.” The core element of that architecture is the module, which every Nest.js app is broken into by default. The types of modules – marked by the @module() decorator – will be one of these four properties: imports, exports, controllers, or providers.
#Note on Nest Modules
Custom modules, once built, are imported to the root AppModule via the app.module.ts file.
Getting Started: A Simple Nest.js App
The only real prerequisite is Node.js, as TypeScript comes packaged with the Nest installation. So the real first step from there is to install the Nest CLI and to open a new project.
Installing and Configuring Nest.js
npm i -g @nestjs/cli
nest new project-name
You’ll have five .ts files available by default. You’ll see the main project file main.ts:
import { NestFactory } from '@nestjs/core';
import { AppModule } from './app.module';

async function bootstrap() {
 const app = await NestFactory.create(AppModule);
 await app.listen(3000);
}
bootstrap();
Nest is platform-agnostic but comes with two framework options, Express and Fastify, built in. You can customize the main.ts to create an app in either framework with NestExpressApplication or NestFastifyApplication.
import { NestFactory } from '@nestjs/core';
import { AppModule } from './app.module';

async function bootstrap() {
const app = await NestFactory.create
(AppModule);
await app.listen(3002);
}
bootstrap();
Run the following command and you’re up and running:
npm run start
Debugging a Nest.js App
As comprehensive as Nest and its documentation are, the one place where its silence is deafening is a detailed rundown of debugging. Considering how many moving parts the Nest.js framework is composed of (Express, Node, TS, etc.), some clarification would be expected. In spite of all that, debugging Nest.js is definitely possible.
In this case, we’re going to show you how to use Rookout to debug Nest. Rookout’s documentation shows you various Node setups, including for TypeScript. We’ll walk through the Nest case here.
Firstly, install the Rookout Node SDK package either by NPM or Yarn:NPM:
npm i -save rookout
OR Yarn:
yarn add rookout
Then add the SDK to your app. You can do that by adding it into your src/main.ts file.
import { NestFactory } from '@nestjs/core';
import { NestExpressApplication } from '@nestjs/platform-express';
import { AppModule } from './app.module';

const rookout = require('rookout'); rookout.start({ token: ‘somerandomassnumbers123457593903209’ })

async function bootstrap() {
const app = await NestFactory.create<NestExpressApplication>(AppModule);
await app.listen(3010);

}
bootstrap();
Ty–The token here is important for connecting your repo to Rookout. In this case, I put the code in GitHub, but you can easily host your code in another repo like GitLab or Bitbucket.
If you are “transpiling” (syn. ‘decompiling’) or bundling your code, you have to include source maps. TypeScript transpiles into JavaScript, so if you have a TypeScript application as you would with Nest, there are two lines you should add to your tsconfig.json file:
"sourceMap": true,
"inlineSources": true,
Thus, instead of Rookout alerting you to differences between the two versions of the code, Rookout will know to expect a shift from TypeScript to vanilla JavaScript.
These instructions will be similar with other JS-related projects. Check out the Rookout SDK docs for moving forward with other JS and Node variants CoffeeScript, Babel, and Webpack.
Finally, Import to Rookout
Open your project in Rookout and head to your main.ts file. Set breakpoints where you need to and watch the debugging logs flow in.
Set your non-breaking breakpoints in Rookout
Conclusion
The objective here was to introduce you to and show you how to take advantage of Nest. This is hardly an exhaustive tutorial, but it did go over examples of debugging Nest.js with Rookout and with VS Code. We tried to show you how different kinds of tools in the JS ecosystem fit together. Rookout is an extremely durable option, meant to fit in with other apps like open-source IDEs and various sorts of frameworks.
Rookout boasts applicability to Node.js, but that encompasses a lot of services in the world of JS and the orbit of Node. That means Rookout works with React, Vue.js, Webpack, Babel, CoffeeScript, Angular.js, Angular, Nest.js, and more. This also includes additional tools, supersets, runtimes, and libraries in the ecosystems of Python, Java, Ruby, Golang, and C# (.NET).
This is a powerful tool for that can debug apps in production without compromising source code security – Rookout never reads your source code and never hosts it.
Python really needs no introduction, but Google’s search algorithms demand it. Python is essential for its versatility and low barrier of entry for new users. It’s become a vital part of nearly every corner of development, especially in big data and machine learning which may not have progressed to where they are in 2022 without Python’s inception. All the same, debugging Python needs to be efficient. There are a prolific number of development environments and frameworks for Python users, all with their own advantages or particular users in mind. One of those IDEs is PyCharm, part of JetBrain’s arsenal of tools.
As is standard these days, you need to be able to handle remote debugging in whatever environment you choose. More often than not you’re going to have some part of your overall architecture living in the cloud. Just like with its signature IDE IntelliJ, PyCharm offers templates and custom options for configuration, as well as running multiple debugs at a time.
There are two kinds of debugging to speak of: local or standard debugging (which is available in the community edition) and remote debugging (which is a premium-only feature).
Demand for Cloud-Native Debugging
This tutorial will show off PyCharm’s built-in debugging capabilities. To make this clear, we’ll work with local debugging. Local debugs are obviously simpler and doesn’t deal with some of the unspoken challenges inherent to remote debugging. Those challenges make it difficult – if not impossible – to adequately duplicate the conditions of your remote deployment.
Because of the complex architecture of remote microservices deployments, mimicking the conditions of the production deployment are nearly impossible. The demands for accurate debugging here require tools like Rookout that can conduct live debugging while syncing with the source code accurately. Third-party tools can also re-secure information that might otherwise be accessed in a straight-up remote debug.
Python’s main debugging tool is pdb, including breakpoints and source code listing. It’s also extensible where pdb actually constitutes its own class. You can run it automatically whenever you hit an error, or manually call with a command as simple as this:
import pdb

python -m pdb mystuff.py
This tutorial will show off PyCharm’s built-in debugging capabilities. To make this clear, we’ll work with local debugging. Remote debugging deserves its own attention as the demands for accurate debugging include tools like Rookout that can conduct live debugging while properly duplicating all the conditions inherent to your production environment.
Let’s set up a simple app and run it through a debugging session in PyCharm to see how it works.
Setting Up Remote Python Debugging in PyCharm
Prerequisites
Python project
PyCharm community edition
Python 3+
You’re going to want to have the most advanced version of Python possible. Since I only have Python 3.9, I’m going to check on going to update to whatever the latest version of 3.10 is. On a Mac, you’re probably using Homebrew, but make sure to specify brew install python@3.10, otherwise, it will upgrade you to the last version of Python 3. As of this writing, Homebrew offers up to 3.10.4 rather than 3.10.5, but these numbers are certain to change as time moves on. For those of you from the FUTURE, specify python@3.11, python@3.12, etc. to be as up-to-date as possible.
brew install python@3.10

<i><span style="font-weight: 400;">#Note - Those of you reading </span></i><i><span style="font-weight: 400;">from</span></i><i><span style="font-weight: 400;"> the </span></i><i><span style="font-weight: 400;">FUTURE</span></i><i><span style="font-weight: 400;"> year </span></i><i><span style="font-weight: 400;">2369</span></i><i><span style="font-weight: 400;">, you can either use Python </span></i><i><span style="font-weight: 400;">147.12.33.001</span></i> <i><span style="font-weight: 400;">or</span></i> <a href="https://www.rookout.com/blog/why-python-2-will-never-die/"><i><span style="font-weight: 400;">Python 2.7</span></i></a>
Download the PyCharm Community Edition from the JetBrains website. If you’re on a Mac, make sure to specify if you’ve got an Intel chip or an Apple Silicon chip (most will have Intel, but check the little apple in the upper lefthand corner of your screen). Download the .dmg file. The installation is easy from there. Once prompted, move PyCharm to your Applications folder and open it from there.
Step 1: Create a PyCharm Project
Create a project and save it. This is where you will create your own files in Step 2.
Now, create a new virtual environment and choose Virtualenv. Next, choose the venv location and its base interpreter (Python version).
At the bottom of the dialog box, deselect ☐ Create a main.py welcome script (since, you know, you’re going to create your own core .py files for the project in Step 2).
You can rename the main.py file if you’d like to match your project. In any case, that’s where your primary code will live for this simple app.
Step 2: Edit the code
This app will simply count the number of words in a given document. But to make it more interesting, we’ll add a frequency counter to tell us which words come up the most.
To keep this as relevant as possible, I took the text from Wikipedia’s article on debugging and copied it into a file debuggingwiki.txt.
We’ll set two functions to…
Count the total words and
Break that vocab down into a list with the number of occurrences for each word in the doc.
Define the functions’ output, then put in the (relatively) complicated stuff. To get the relevant files for this tutorial, look up its GitHub repo.
def totalcount():
print('Total Words:', len(per_word))

def wordsbynum():
print('Word Frequency:', counts)
file = open("debuggingwiki.txt", "r")
read_data = file.read()
per_word = read_data.split()
file = open("debuggingwiki.txt")
counts = dict()
for line in file:
words = line.split()
for word in words:
if word in counts:
counts[word] += 1
else:
counts[word] = 1
totalcount()
wordsbynum()
Run the code and you get:
Total Words: 2276
Word Frequency: {'Debugging': 7, 'In': 8, 'computer': 8, 'programming': 7, 'and': 52, 'software': 13, 'development,': 1, 'debugging': 25, 'is': 31, 'the': 141, 'process': 8, 'of': 77, 'finding': 1, 'resolving': 1, 'bugs': 5, …

#the list will continue for two more pages if I don't cut it off here, but don't worry, there's more!
It works! You’re a genius. You could beat a real python in a fight! But your code’s kind of discombobulated. Let’s try to improve the app by sorting this list in descending order.
Step 3: Debugging Pycharm Apps
Since you’re a pythonic genius now, let’s try your solution for sorting the word frequency list. Using the built-in function sorted(), you think you’ve got this:
You add in your favorite function: sort(). This will blow everyone away.
Total Words: 2276
Word Frequency: {'Debugging': 7, 'In': 8, 'computer': 8, 'programming': 7, 'and': 52, 'software': 13, 'development,': 1, 'debugging': 25, 'is': 31, 'the': 141, 'process': 8, 'of': 77, 'finding': 1, 'resolving': 1, 'bugs': 5, ...

<span style="text-color: red;">Traceback (most recent call last):
 File "/Users/gedalyahreback/PycharmProjects/demopycharm/practicescratch.py" line 35, in <module> inorder()
 File "/Users/gedalyahreback/PycharmProjects/demopycharm/practicescratch.py" line 32, in inorder
   freqsort = sort.counts()
NameError: name 'sort' is not defined</span>
Oh no, your code sucks now! What are you going to do?
Live shot of your screen before debugging your Python
No worries, that’s what debugging is for.
Either right click or hit the green bug icon in the upper-right-hand corner. If you want to set a breakpoint on any specific line, hit the space between the line number and the code itself.
Two breakpoints are visible on the side for PyCharm debugging
You can and should set the debugger to stop when it hits an issue or a breakpoint. If it finds new issues, it will create and add a new breakpoint, signaling it with a lightning bolt (as seen here without the previously displayed red dots):
An example of breakpoint added after PyCharm noted something in your code during the debugging process
Restart the debug by hitting the resume icon: ⧐
In the debugger, it will mark the errors with more detail.
PyCharm debugger adds more detail to your logs
The sort() function is “not defined” because it’s acting on a dictionary . Unfortunately, sort() only works on lists.
Python Bonus Info: sort() vs. sorted()
Okay, fine, let’s try something else. We’ll go with sorted(), which accepts dictionaries.
The great thing about writing a Python example for a debugging company is that even when you make a mistake, you can just use it in your demo!
What in the wide, wide, world of sports? Where did the numbers go? In this case, a debug won’t help you. But don’t worry, the issue here is you need to order by the values in the dictionary, otherwise it will just return things according to the keys.
You can simplify this by importing an operator called itemgetter. Now, you will be able to quickly specify the items you want:
from operator import itemgetter

def inorder():
    for key, value in sorted(counts.items(), key=itemgetter(1), reverse=True):
        print(key,':', value)
Run and get this:
Your Python code works after using the PyCharm debugger!
You’re a genius again!
With all the debugs and rewrites out of the way, let’s see our app code in all its glory:
from operator import itemgetter

def totalcount():
  print('Total Words:', len(per_word))

def wordsbynum():
  print('Word Frequency:', counts)

def inorder() -> object:
  for key, value in sorted(counts.items(), key=itemgetter(1), reverse=True):
      print(key,':', value)

file = open("debuggingwiki.txt", "r")
read_data = file.read()
per_word = read_data.split()

file = open("debuggingwiki.txt")
counts = dict()
for line in file:
  words = line.split()
  for word in words:
      if word in counts:
          counts[word] += 1
      else:
          counts[word] = 1

totalcount()
wordsbynum()
print('In order:')
inorder()
Standard Debugging vs. Remote Python Debugging in PyCharm
PyCharm really is fantastic. It provides a lot of the tools you need to push along, even for a Python novice like yours truly. PyCharm and other IDEs also offer remote debugging, but it leaves something to be desired. Besides the fact remote debugging is a premium feature on PyCharm, it’s not necessarily an effective way to spend your budget.
There are two ways to do a remote debug in PyCharm: 1) create a deployment config for a remote interpreter, or 2) Create a remote debug server config for local debugging.
There are quite a few drawbacks to remote debugging in general regardless of IDE, even though you’d expect it to be an efficient process by this point in the history of cloud computing and DevOps.
The requirements for remote debugging are extensive. If these aren’t all in perfect alignment, a reliable debug won’t be possible:
No Room for Latency: Poor network connections on either end of the debug will surely slow down the process, but could make it unreliable altogether
No Source Code Sync: It’s nearly impossible to keep source code in sync during debugs, a problem that high latency would intensify. Microservices architecture is difficult to debug in general.
No Breakpoints: On PyCharm or IntelliJ, it’s recommended NOT to use breakpoints during production debugging because of the risk to the application
Admin-only access: This limits the list of people who can manage a debug, hampering team productivity
Information risk: Exposing code here can also increase the exposure of passwords and tokens. Rookout can’t actually read the code when it imports it, keeping secure whatever data the original source code holds.
Remote debugging with Kubernetes is inefficient: There’s no way to stress this enough. You need to change the Dockerfile and redeploy the Docker image every … single … time you need to do remote debugging.
Conclusion
Remote debugging usually requires extra care with version control and mimicking the exact conditions of a cloud – or even multi-cloud – deployment. Your connection must be extremely consistent and strong, which could hamper some efforts at doing timely debugging if you sometimes work from home where the connection could be weaker than your office setup. With all this in mind, Rookout is designed to mitigate these issues with our Live Debugger platform. Take a look and try Live Debugger for free.


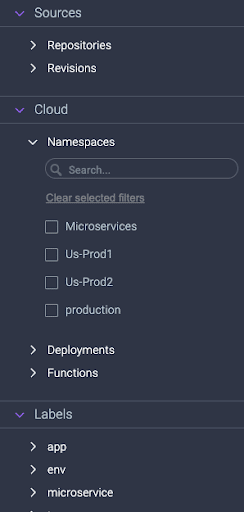
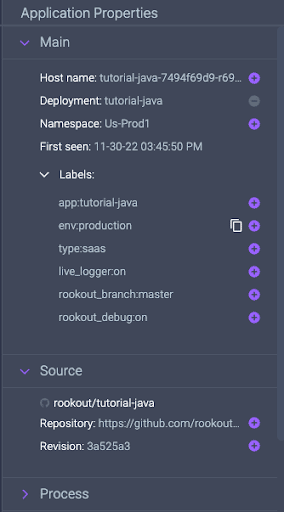
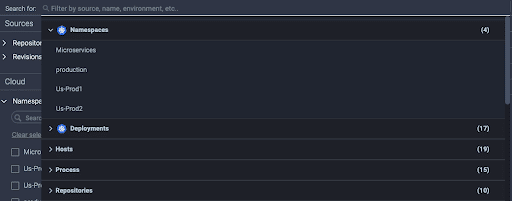


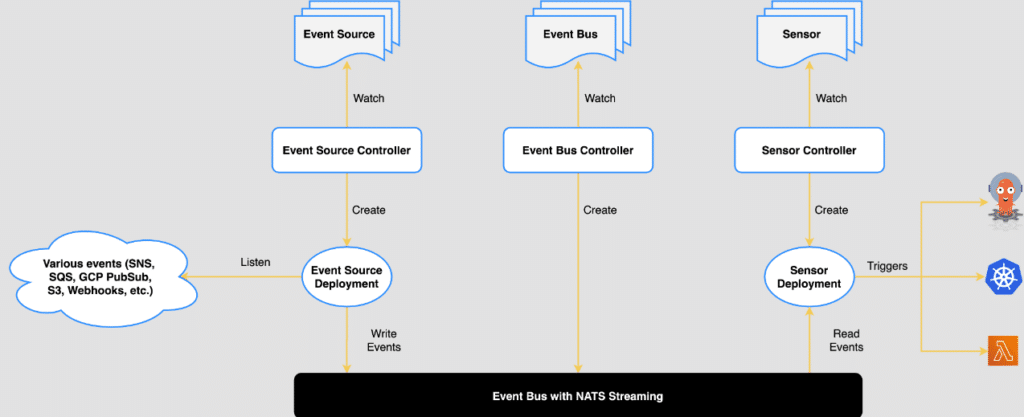
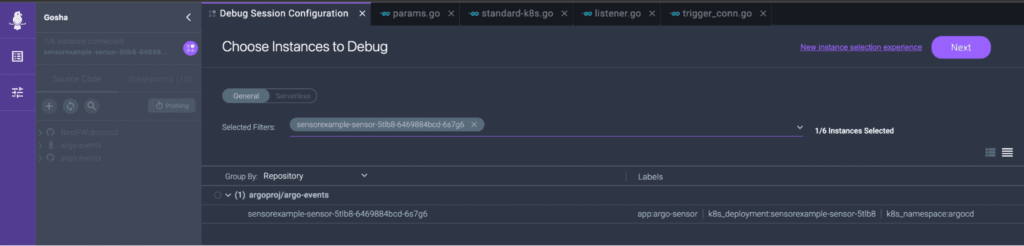
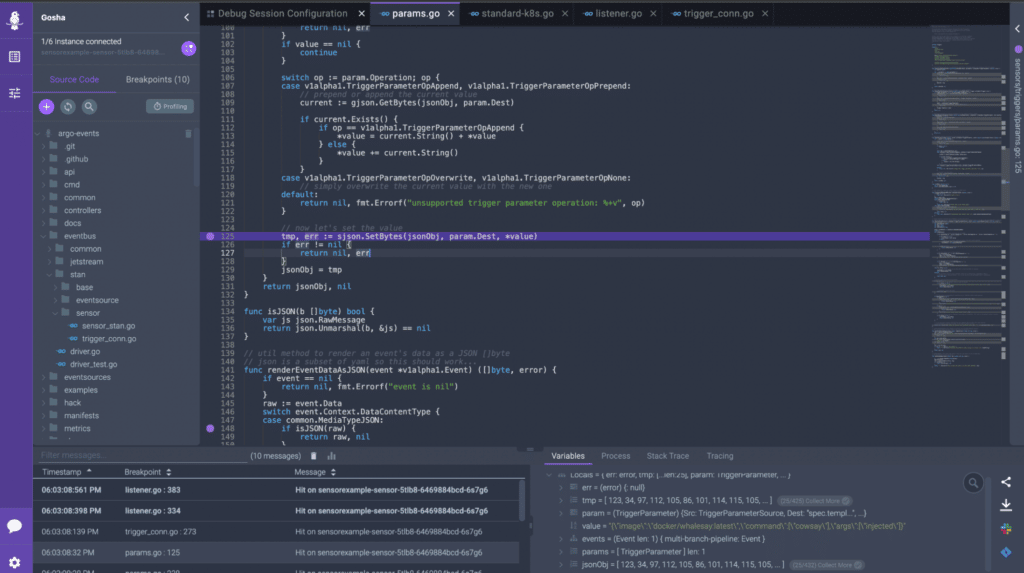
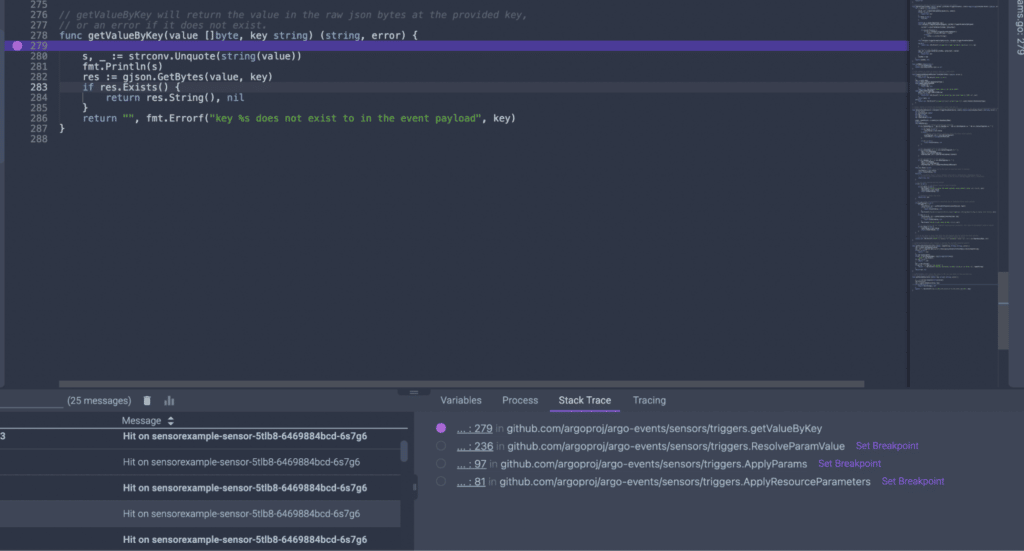
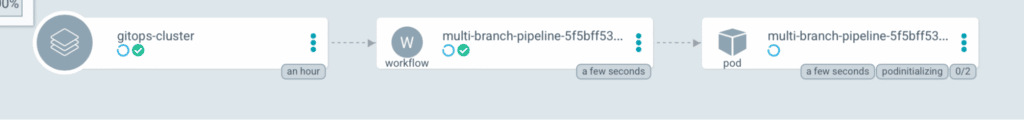


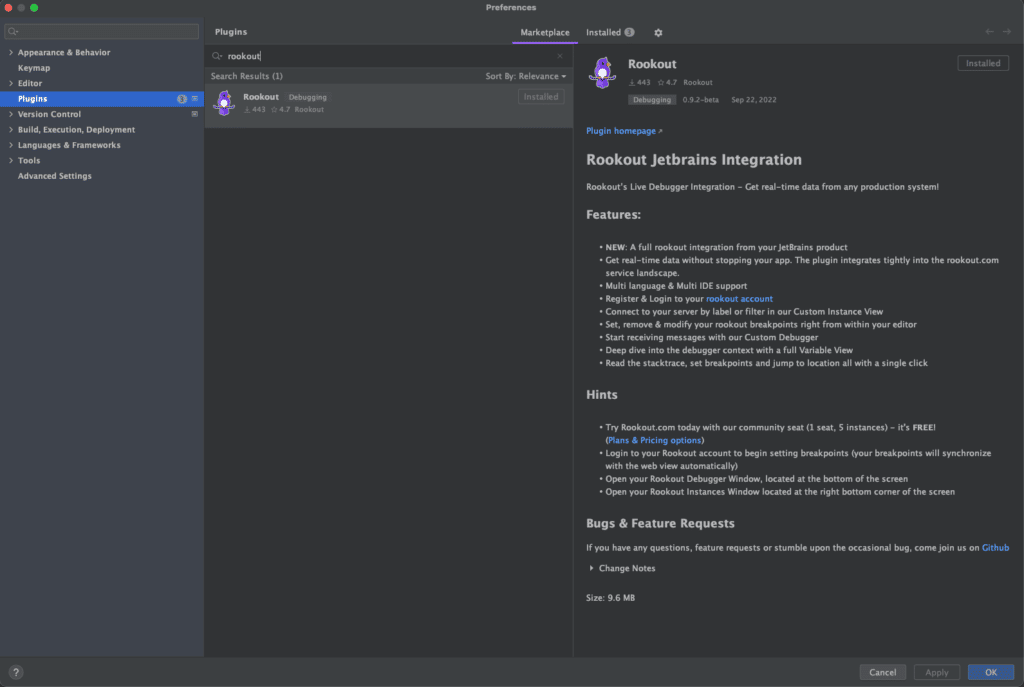
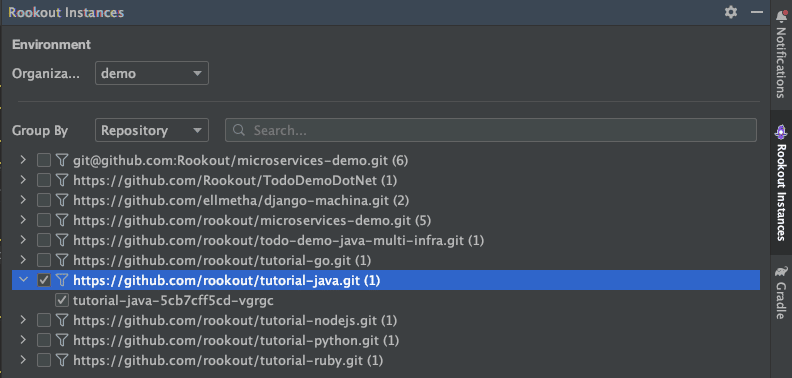
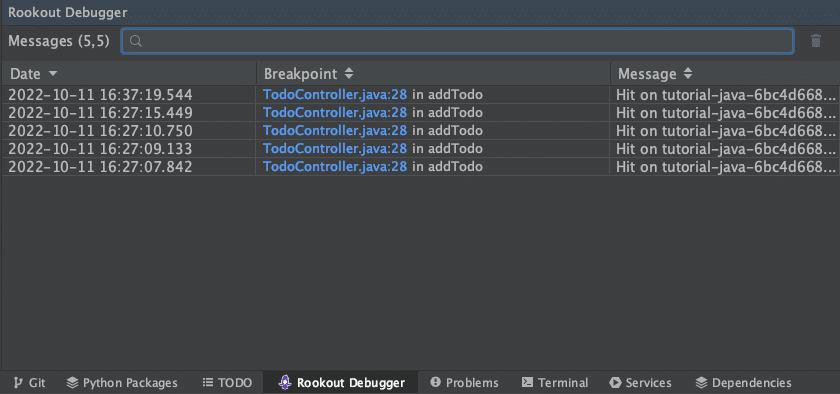
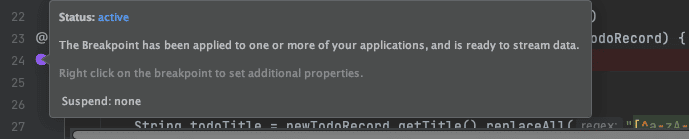
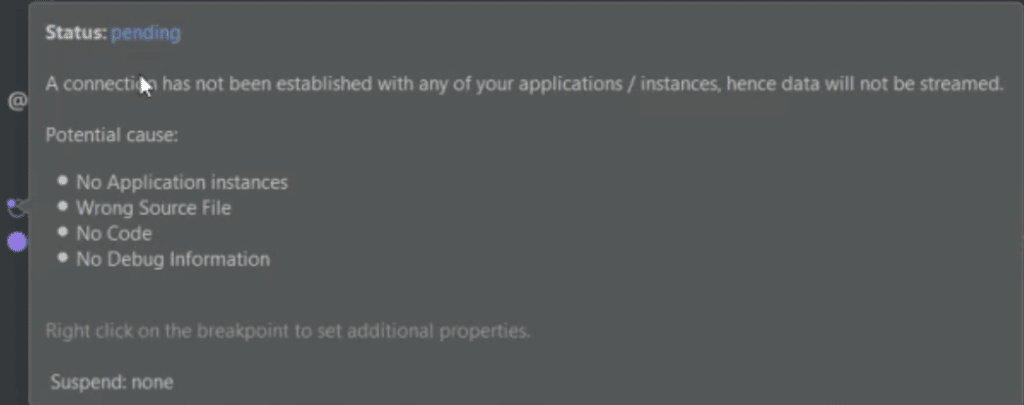
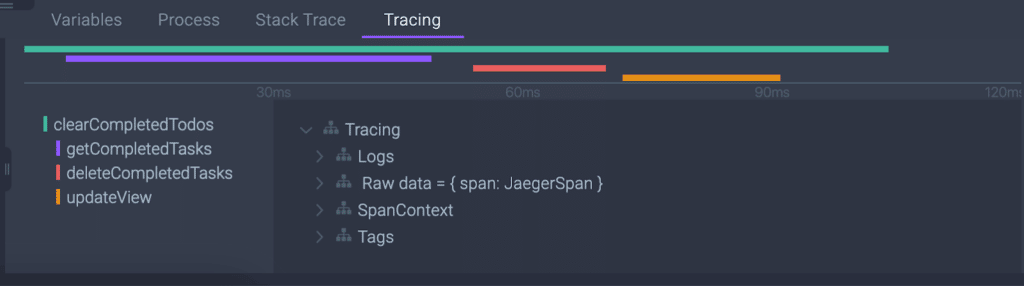
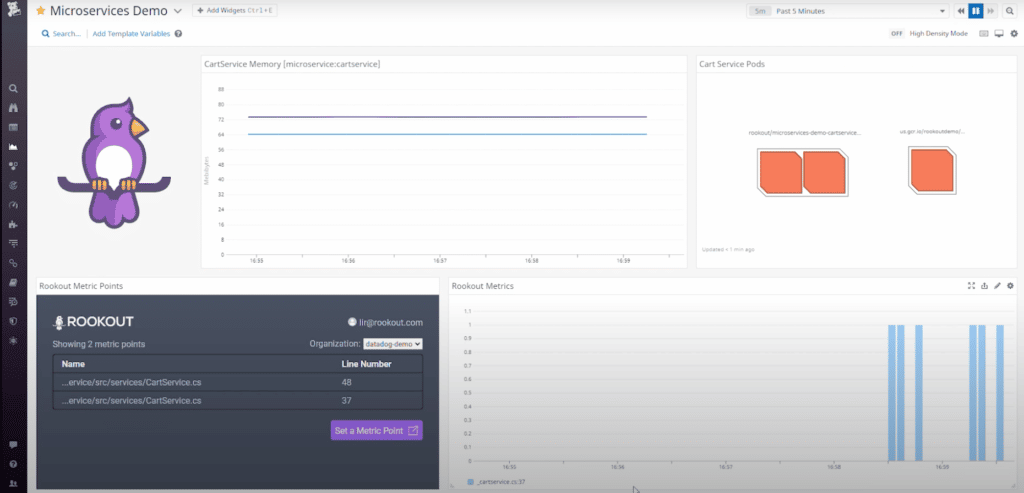


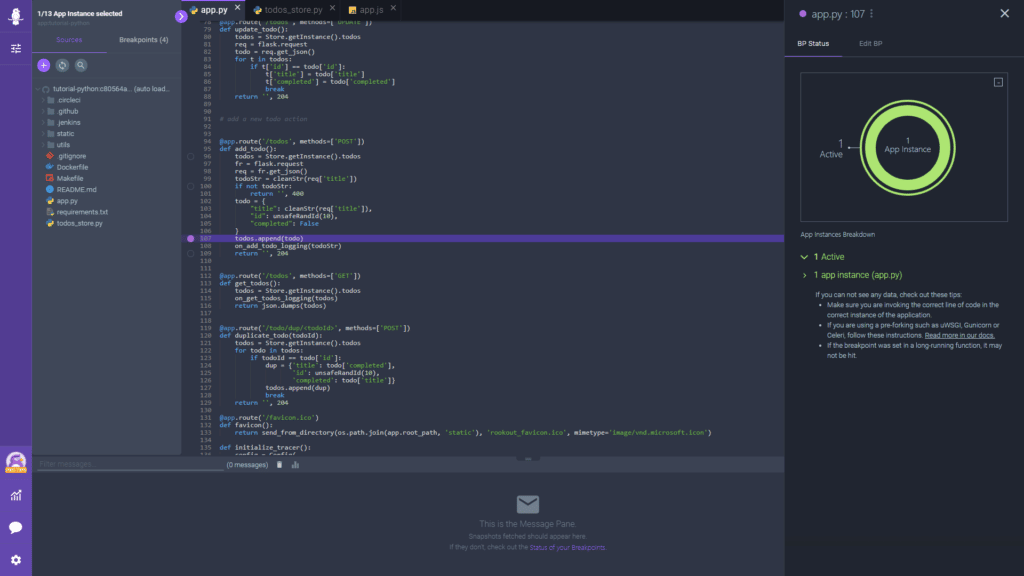


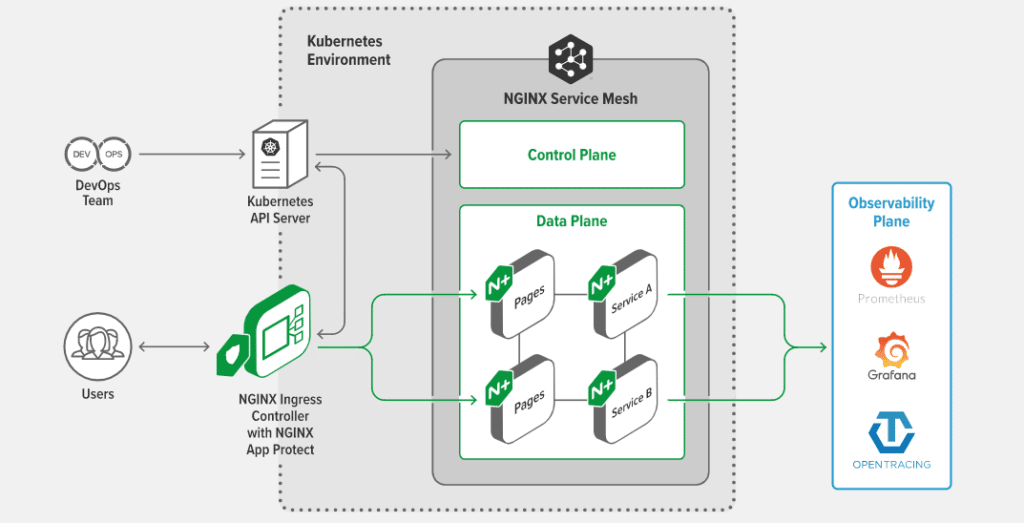
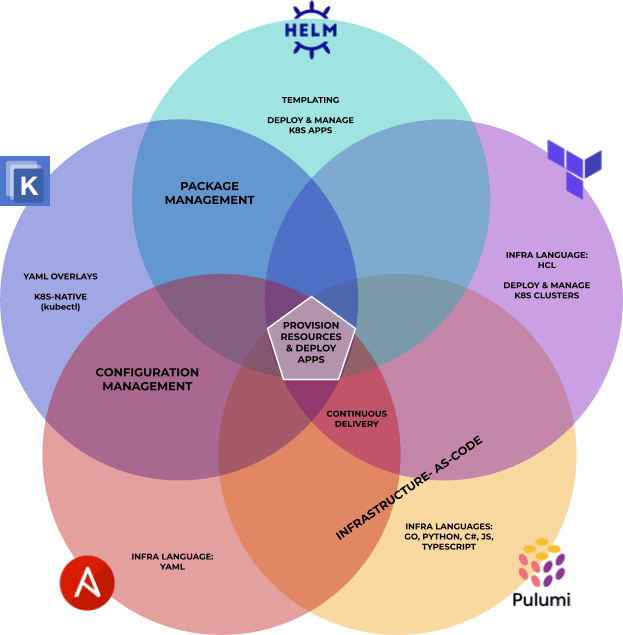


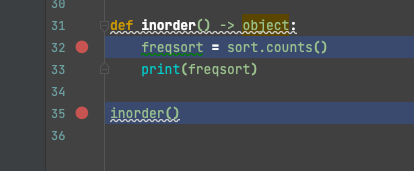
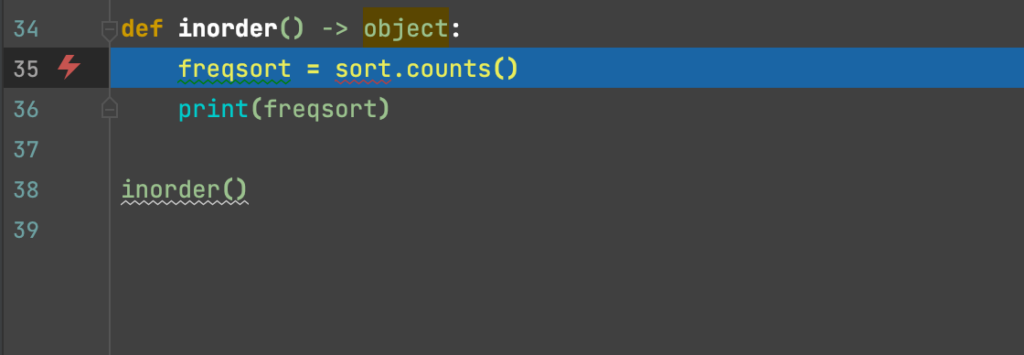
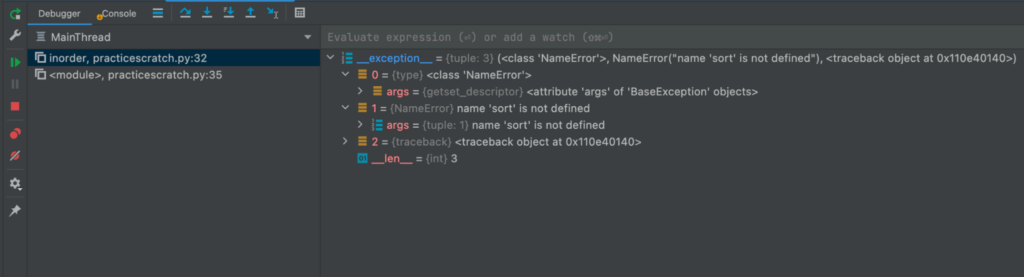

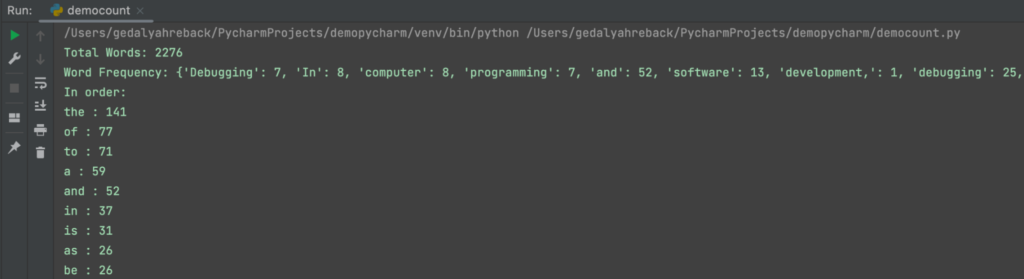