To paraphrase a popular Chinese proverb: “It is better to light a log line than to curse the darkness”. And yet it’s 2021, and many of us are still lost in the dark, struggling to find a match, praying for that one missing log line that would have pointed us in the right direction. How did things get this bad?
Since time immemorial, we have relied on logging as the first trustworthy, intuitive, and straightforward debugging method. A developer writes a tricky line of code, or a snippet that should never be executed, or a function whose run should be trivial and intuitive. And yet, when the application is running, things don’t go as expected. The developer writes another line of code, to be printed before, after, or during the tricky execution, specifying exactly what happened, providing context, and highlighting the severity of the printed line. This is the bread and butter of log-based debugging.
As the application grows and evolves, more developers join the party. A complex logging pipeline is built, and when the application runs in a staging or test environment, each developer is bombarded with the DEBUG logs written by their peers. The DevOps or Infrastructure or Observability team is called into action and significant R&D effort and infrastructure cost are invested in ensuring that the logs are well formatted, that the correct level of severity and detail are used, and that when a problem happens we can find the WARNING or ERROR logs we needed, along with the relevant stack trace, rather then drowning in a sea of nearly identical “@@@ I am here and it is now @@@” debug logs, masquerading as INFO logs.
As the application gets shipped to production, or deployed at a customer environment, the complexity rises again. We now need to consider the performance impact of printing logs, as well as the money we spend on shipping, storing, indexing and extracting logs. When the product is young and growing, and the cost of losing a transaction or failing to fix an issue are too high, we take a cost hit – we log everything. Quite literally, everything.
However, if things worked as planned, we eventually reach a level of maturity and growth that lets us cut down on logging. We invest several development sprints in removing unnecessary log lines or reducing their severity. Application code that was once fresh and unknown and covered with detailed log lines from top to bottom is now mature and familiar, and the only log lines that get printed are the ones that indicate that something, somewhere, went extremely and unexpectedly wrong. And when that happens? We use those logs as a flashlight, pointing at the root cause of the problem and adding color and insight into points of the code that would have otherwise been in black and white or altogether invisible.
And if we were indeed in a children’s story, this is where the story would have ended. We all lived happily ever after, having found the balance between logging too much and too little, like Goldilocks and the three bears. Everything is just right, and we could have our coffee and take a break. But real life software engineering is very rarely a fairytale.
In real life, we sometimes have too many logs, even in a mature and well-maintained application. When a problem occurs, we can’t find the needle in the haystack. Logging costs are still a challenge and each newly added log line has to be optimized for performance, cost, and readability. And in real life, more often than not, we don’t have enough logs. Maybe we confidently print INFO logs, but the extra level of detail we need is hidden in a DEBUG or TRACE level log line. And maybe we decided to print only WARNING or ERROR logs because the application is running at scale, and we can’t even see the hints provided by a well placed INFO log line.
So the pendulum keeps swinging – we add code, change verbosity level for specific lines, restart the app with a different log level. And repeat. When a developer tries to troubleshoot a specific service and only need DEBUG level for a specific service, for a specific account, for a specific deployment – they end up turning DEBUG logs for everyone, lighting up the entire app aflame when a candle would have been enough. When a DevOps engineer worries about increasing cost they reduce logging to ERROR for everyone, leaving everyone blind and afraid, without the light they need to see where they are heading. Cursing the darkness, or cursing the brightness of the sun, without the means to find a dynamic and flexible balance between the two.
We find ourselves reiterating our original question – how did things get this bad? And why didn’t things get better since then? When trying to find the root cause, we have stumbled upon the following sentiments, believed to be true by many of our customers and peers:
Logging still costs too much. Logging everything is not feasible, is too expensive, requires too much engineering effort.
Not logging at all is not an option. When things break down, you need to be able to quickly understand what happened and why, with as much context as possible.
There is no efficient and safe way to switch from “dark mode” to “light mode” and back. Changing log level requires a restart, or changing code, or both. And going “full light” may be even riskier, as it could “break” the app rather than help us fix it.
Even if there was an efficient way to switch to “light mode” – it would just leave us blind and grasping the dark. Rather than setting everything on fire or lighting up a sun, we need something precise – switch on logs in the area that we are looking for, printing logs only for a specific service, account or deployment.
What if instead of setting the whole building on fire, we could point a very effective searchlight at exactly the point of the problem? What if switching logs from WARNING to INFO to DEBUG and back was as easy as switching between Dark Mode and Light Mode on my favorite app? What if we could switch logging on temporarily, in a way that was focused on the service I am trying to debug? What if we could easily and dynamically balance the need for fresh, context-based data with the need to keep performance and log storage cost at the minimum?
Happily, we do have some ideas up our sleeve. And yes, it’ll save you all that frustration, pain, and insane logging costs. Stay tuned to find out next week just what this magical offering is 😉
The rise in digital transformation over the past few years means that more and more companies are adopting cloud native technologies. While these distributed architectures provide scalability and agility, they also increase complexity. As Arnal Dayaratna, research director in software development for IDC, writes, “One of the challenges faced by contemporary developers is the task of understanding applications that they may not have even developed or used [whether it be third-party, open source, or code written by a colleague].”
Traditional debugging methods, such as step-by-step debugging, are practically impossible to use in cloud native environments. There is never a single server to connect to and debug, since the environments are dynamic, and containers, pods and serverless functions spin up and down on the fly.
Developers often fall back to log-based debugging, which brings its own set of challenges in cloud native environments. Logging costs become significant, as does performance impact. And it means having to add a line of logging code, wait for a new release and waste precious development time while delaying issue resolution.
These challenges have given rise to distributed tracing, which has taken over the industry as the de facto method for monitoring and troubleshooting cloud-based applications. Tracing, a complement to logging and monitoring, is now considered one of the foundations of observability. It’s a relatively new industry trend that emphasizes the ability to view the internal state of the application in real time. The most prominent distributed tracing implementation is the OpenTelemetry project, the second most active Cloud Native Computing Foundation (CNCF) project behind only Kubernetes.
OpenTelemetry and the tracing tools that implement it — such as Jaeger, Zipkin and Lightstep — offer developers the ability to see the internal relations between different cloud-based microservices and provides invaluable context when trying to troubleshoot a complex and dynamic environment. The ability to combine tracing information with code-level, context-specific debug data gives developers an even deeper insight into application behavior, taking observability into its next evolutionary step: understandability. This is the ability to not just view the internal state of the application, but also to fully understand its structure and function.
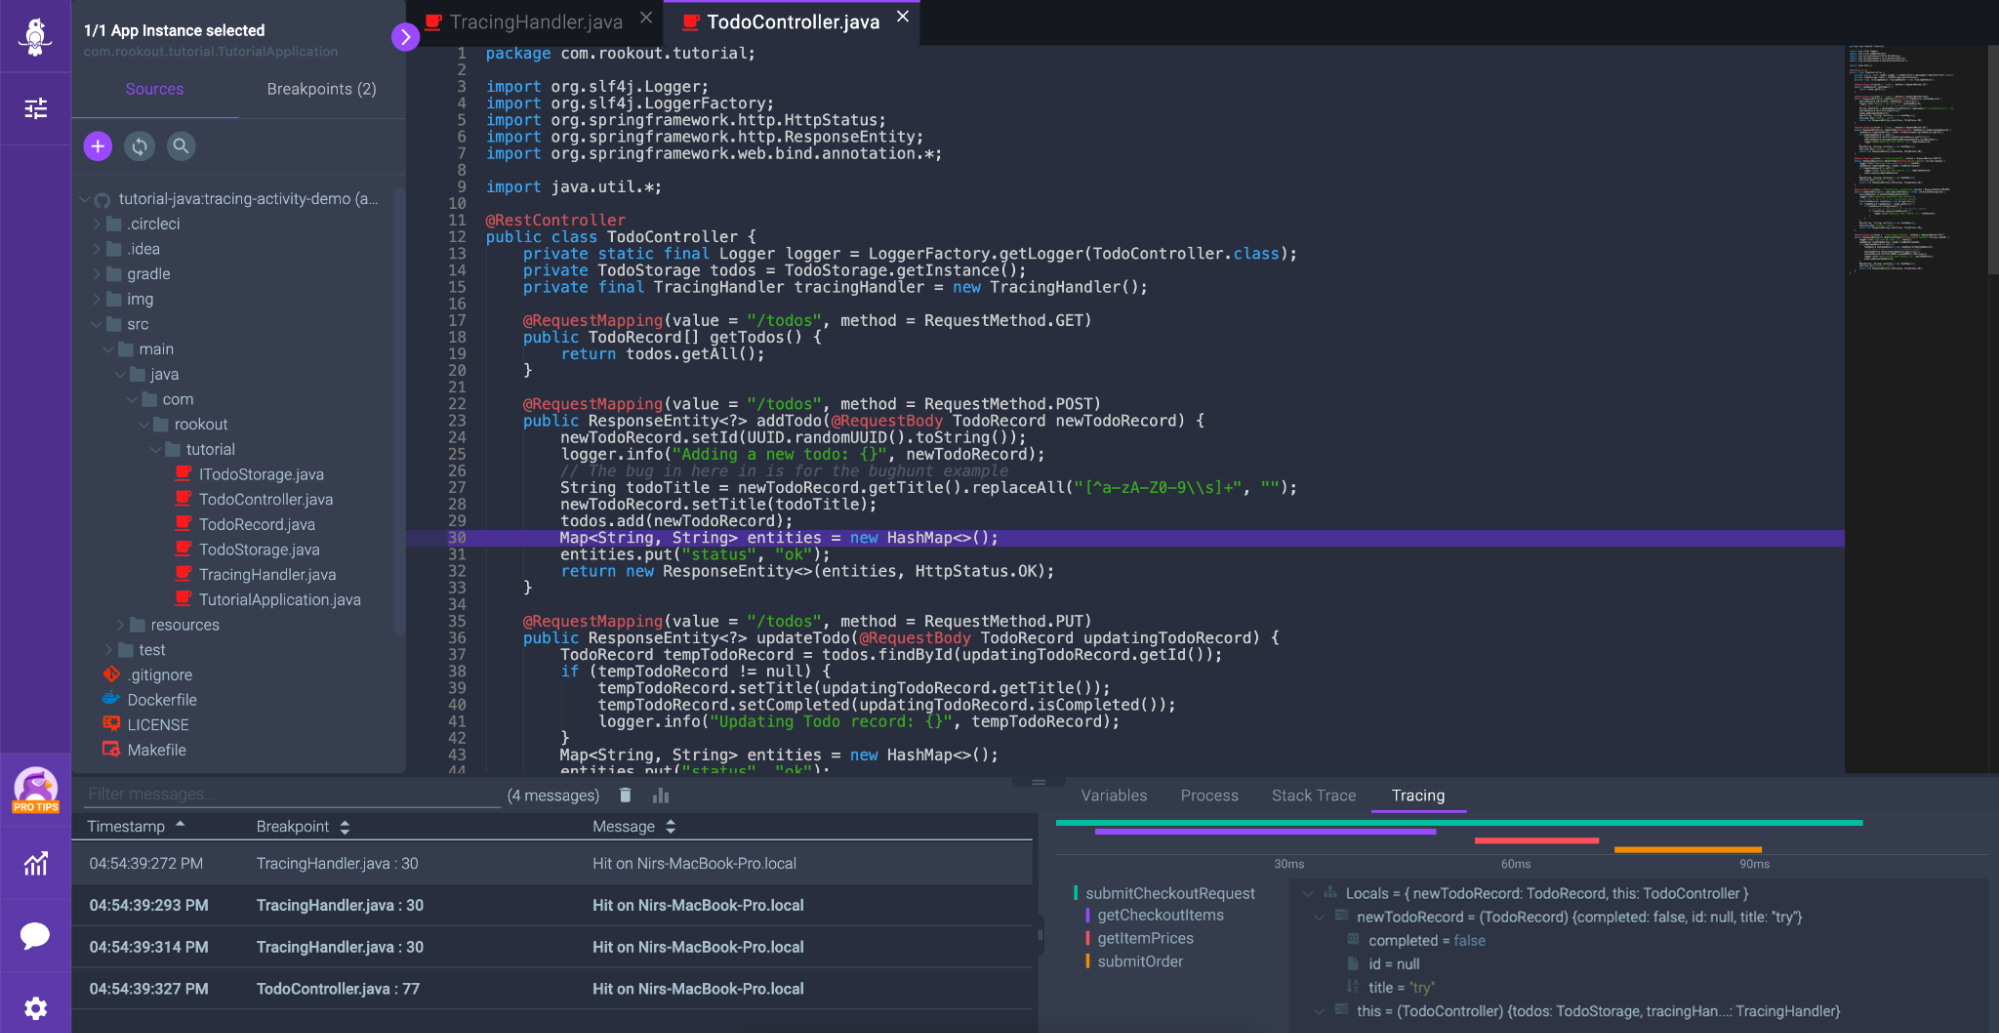
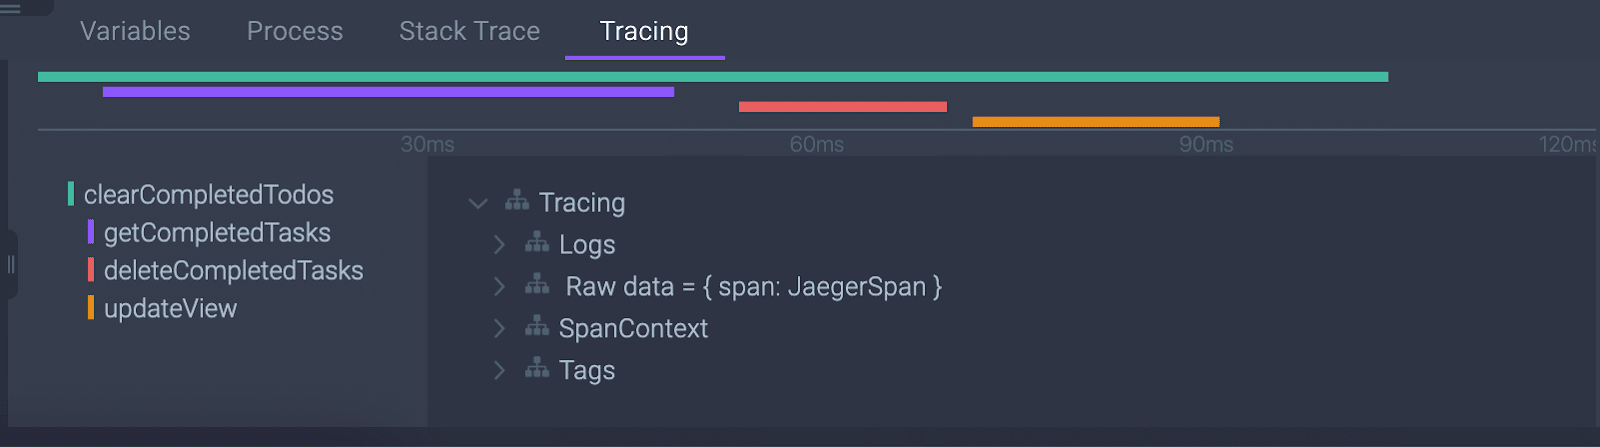
Within modern debuggers, developers can place what are called “non-breaking breakpoints” into an application, to collect data such as local variables and various tags. But the ideal workflow would also collect tracing data at these specific breakpoints, providing rich context for more rapid troubleshooting that include observability data like distributed traces, spans and logs. Here at Rookout, we’ve integrated with OpenTelemetry to create a Tracing Timeline that visualizes these typically disparate data sets side by side:
Paval Fux, a senior director of engineering at GrubHub, writes, “Traces are important telemetry when trying to understand where something went wrong, but it’s also time-consuming to switch contexts back and forth between the observability tool and the debugger. Having the ability to view debug snapshots and tracing data side by side gives me the capability to see the full picture and makes it easier for me to get to the root cause faster.”
The new blend of modern, non-breaking debuggers with distributed tracing must become prevalent if we are to solve the increasing challenges of cloud-native applications like complexity and dependency on third-party code. Log-based debugging and traditional step-by-step debuggers will only take us so far. We look forward to a future where the software industry enhances observability into understandability, giving us a deeper insight into the behavior of our applications in ever-evolving technologies.
This article was originally published on TheNewStack
Imagine that you’re at your company’s all-hands meeting and one of the sellers is proudly ringing the office gong to celebrate closing a big deal with a client who’s on the other side of the world. It’s a big deal because it’s a major project. Their logo is going to look sleek on your website, and you are finally breaking into a new region of the world. But two months after the project kicks off, the situation isn’t looking as rosy. There have been myriad issues, and now the client has been informed of a critical issue with your application, which is preventing them from providing service to their clients. What a mess!
But that’s OK. Everyone knows that you can’t develop code without bugs; it’s simply a part of life. After accepting this fact, you need to learn how to deal with it by building processes that better enable you to handle these issues.
For this reason, your company has a team of talented site reliability engineers(SREs) to create scalable and highly reliable software systems to minimize the impact of bugs. They will handle customer issues, spend time on call and provide assistance with manual intervention. They are your front-line defense system when it comes to battling client bugs.
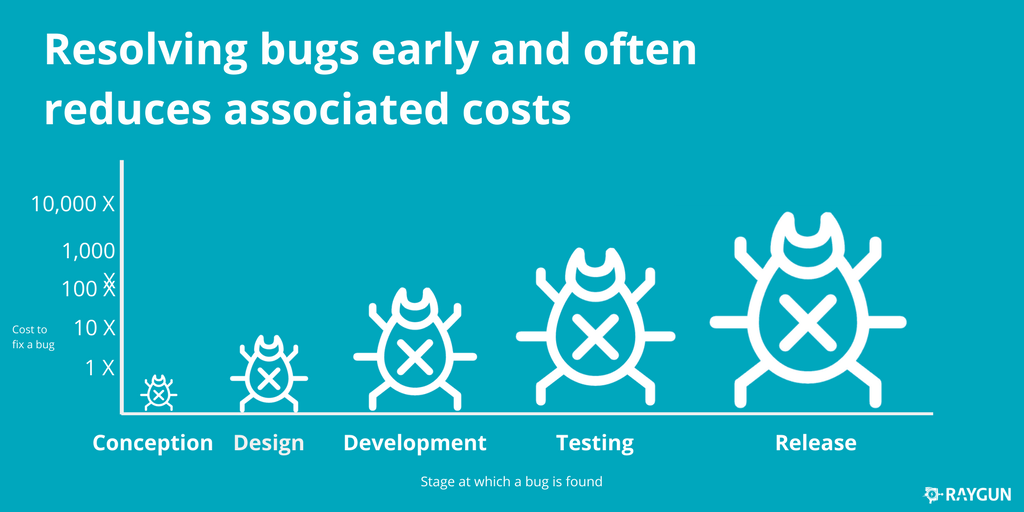
But what’s critical to remember is that no matter how amazing your SREs are, the cost of solving a bug early on in the development process is significantly lower than when it has already been released.One studyreported that the cost to fix a bug found during the implementation stage is approximately six times more expensive than one identified during the design phase, and up to 100 times more expensive if it’s already in the maintenance phase.
For that reason, it is important to understand and accept that resilience — as in, how equipped you are in dealing with issues as they come up — is a research and development (R&D) problem, not just an SRE problem. After all, prevention is a cure.
Cost of resolving bugs during the development processes (Source: Raygun)
So how do you go about creating resilient software? Start with taking a look at your R&D team. They are your core. If SREs are your front-line defense, R&D are the ones who ensure that the product is strong, robust, and durable. They are your immune system. R&D is the team that has to ensure, and continuously verify, that everything has been done that can be dealt with before reaching the client.
To ensure that happens, here are a few things you should focus on:
Identify issues during the development phase, using various tools and techniques such as architecture risk analysis.
Ensure that you set up and follow a structured and rigorous code review process. Having your peers go through your code provides another set of eyes to ensure that nothing is missed.
Before releasing the software, conduct penetration tests to identify any issues and to ensure that bugs that you had previously identified have been resolved.
Set up automated tests and track and monitor the performance of your code to prevent the client from experiencing any issues.
Ensure you have set up the infrastructure needed to enable you to debug your code once it hits production.
All of these will ultimately affect the bottom line. Creating robust code early on in the development process minimizes the number of bugs, and if any bugs are identified, it will be easy and relatively inexpensive to fix them. Robust and resilient code in production ensures that the SREs in your company can focus on working with the clients and fixing client-specific issues instead of going back to R&D to address core issues in the code.
Company-wide resilience is critical to ensure that you can deal with the unexpected. There are many ways in which you can strengthen your resilience (check this article out), but it’s critical to remember that it’s not just something that those who are working directly with your customers have to worry about. The more R&D gets involved in ensuring that there is resilience company-wide, the more you will enjoy being part of a smooth operating machine.
When designing and building software, service reliability is always at the top of the list of critical focus areas for development teams. Every team that builds software typically has, either directly or indirectly,service level agreementswith their customers. These are, essentially, agreed-upon metrics or performance criteria that teams use to measure and ensure the reliability of a software system.
Organizations may measure reliability in different ways, looking at metrics like service availability, mean time to failure or mean time to repair. Regardless of how an organization chooses to measure reliability, you can often assess the health of an organization based on how reliable their applications are. Since we know that reliability issues happen regardless of how well we prepare for them, having tools to solve those issues quickly and efficiently becomes critical to maintaining smooth operations.
The Health of Your Organization
Most software development organizations today have key performance indicators (KPIs) which they measure to understand how well they’re doing and to be able to quickly and easily measure the health of their application development processes. If teams are finding that they are not meeting KPI’s, it’s often a sign that something fundamental needs to change or that new and improved processes need to be put in place. Teams that are constantly measuring what they’re doing well and where they are falling short with a data-driven approach are typically the teams that come out ahead.
In short, a team’s ability to measure and hit KPI’s and service level agreements with their customers directly influences the overall success and health of that team. If an organization isn’t producing applications that are reliable and available when their customers need them, it’s unlikely that company will have customers for very long. When reliability issues do occur, it’s critical that developers can immediately go to the source of the issue in their code to ensure that they can solve those customer issues as quickly and efficiently as possible. One such approach is to give developers the ability to do real-time debugging directly in the environment where those issues occur, without needing to create costly reproduction environments or having to figure out how to reproduce issues locally that are, many times, data dependent.
Reliability is Shifting Left
Historically, software reliability has fallen on the shoulders of operations or production support teams who manage the deployments and runtime of software after it’s been deployed to production (and after developers have thrown the code over the metaphorical wall). Things have changed in the recent years, in that many of today’s development teams are responsible for their applications from development all the way through to running and supporting those applications in production. Because of this, developers have more incentive than ever to ensure that their software has reliability built in, or at least the ability to quickly debug reliability issues when things go wrong.
Real-time debuggers are one such category of tools that development teams are choosing to package with their applications in order to solve those hard-to-address customer issues faster. Real-time debuggers are solutions which allow development teams to gather code-level debugging information such as snapshots of local variables, stack traces, tracing information and profiling data. All of this data (which traditionally relies on developers having the right logs in their code and, if not, deploying new debug builds) becomes instantly available, on-demand whenever an issue arises. This faster approach to identification of issues can drastically improve the reliability of applications by allowing developers to solve issues in a fraction of the time it would normally take.
Teams Focusing on Reliability Move Faster
Many development teams have shifted to an agile approach to delivering software; the goal being to respond quickly to business needs and to get new, valuable features to their customers as quickly as possible. Even though this is a helpful step, unplanned events can and will happen, which need to be planned for as much as possible ahead of time. In a recentForbes articleby Rookout CEO Shahar Fogel, he discusses how businesses should consider these software bugs as mini outages. Any time teams are dealing with software bugs or other unplanned issues, it costs the business revenue and can potentially leave customers frustrated. Focusing on metrics like mean time to repair (and giving developers the tools they need to reduce the mean time to repair) can give teams the ability to better predict how long unplanned issues will take to remediate once they occur.
In the bookAccelerateby Nicole Forsgren, Jez Humble and Gene Kim, the authors discuss the notion that, by giving developers tools to fix problems when they occur, teams create an environment where developers accept responsibility for global outcomes such as quality, stability and reliability. Investments in technology are also an investment in people. So, it’s no wonder that by investing in technologies that can help improve reliability, teams will be able to move faster. This means happier customers, happier employees and a thriving business.
By focusing on service reliability, development teams are not only able to move more quickly, but are also directly contributing to the overall health and success of their organization. We’re seeing the onus of reliability shifted from operations teams to development teams, which adds newfound importance on ensuring development teams are building reliability into their product. Real-time debugging tools are one potential solution to ensuring that developers have the ability to quickly address unplanned customer issues which can directly impact the perceived reliability of an application.
This article was originally published on DevOps.com
Often hailed as a game-changer, Kubernetes has altered the way that organizations deploy and manage their software, making the job of handling larger and more complex workloads easier.
Yet, with its advantages of velocity and scale come new challenges, particularly in how developers approach debugging their code. The highly distributed nature of Kubernetes that makes it so effective for handling cloud-native software means that the traditional approaches to debugging are no longer applicable.
In the hopes of shedding a little light on the challenges faced by developers working with Kubernetes, we explore the factors that make this powerful environment different and offer a number of useful solutions along the way.
Challenges in Debugging a Kubernetes Pod
Even under the most familiar of old school circumstances, debugging can be a frustrating and time-consuming endeavor;
Recreating the bug is often impossible: Long before even attempting to fix a given issue, developers are required to recreate the bug in order to understand what is causing the problem in the first place. This process of running the code in a similar environment is tricky and far from foolproof. There are a wide variety of factors that can impact the code’s behavior and not all of them are possible to truly reproduce. Some of them might even be outside your control.
Customer inconvenience while a bug is fixed: Adding to the stress of attempting to fix the bug, developers are faced with the uncomfortable choice of pushing new builds to gather more information or trying to reproduce the issue in a separate environment. In either case, valuable developer time is spent trying to get to the bottom of the issue while your customers wait for a speedy resolution.
Taking these challenges into consideration, attempting to debug a Kubernetes pod brings with it a whole new kettle of conditions to be contented with. First off, teams must learn how to deploy an application or workload into Kubernetes, which requires understanding how Kubernetes manages your application. The most basic set of Kubernetes resource types to understand includes deployments which describe the desired state of your application, including which pods or ReplicaSets (a set of pods for high availability) to run and which containers should run within those pods. Kubernetes pods are ephemeral, existing for just the period of time that they are needed to do their job. This means that they are often being spun up or spun down, which can make it difficult to pinpoint exactly where an issue may occur.
Whenever possible, developers typically prefer to reproduce issues locally in their own controlled environment. Since running a production replica of your Kubernetes cluster locally is usually not possible, there are a number of approaches that organizations use in order to make debugging easier.
This includes approaches like spinning up local clusters with tools like minikube or even using frameworks like Docker Compose in order to simulate a microservices environment where multiple services are spun up and running at the same time. These approaches are discussed more in depth in this blog post.
Most developers would agree that if issues can be reproduced and fixed by gathering information from the native Kubernetes environment where the issue occurs, it makes life much easier. One potentially improved debugging approach that makes this possible is through a new category of remote debugging tools. These solutions allow developers to collect live data from running applications including local variables and their values, stack traces, profiling data, and even tracing information. To read more about remote debugging see this blog post.
Current Methods for Debugging Kubernetes Pods
Developers currently depend primarily on three categories of methods for how they debug in the Kubernetes environment.
They are:
Mapping k8s resources
Logging
Classic Debugging
Each of these categories could be explored in-depth on their own, but these three provide us with a useful overview of the general framework for thinking about debugging Kubernetes pods.
In the following two posts, we will cover logging and classic debugging. But for now, let’s start off at the beginning with mapping k8s resources using kubectl get pod and kubectl describe pod.
Find and Describe
Everyone knows the feeling of having deployed their pods to only then experiencing that sinking feeling when it fails to run as planned.
The first thing to do is remember to breathe. These things happen and will happen again in the future. The question is how fast can we resolve this issue and get back to running full steam ahead?
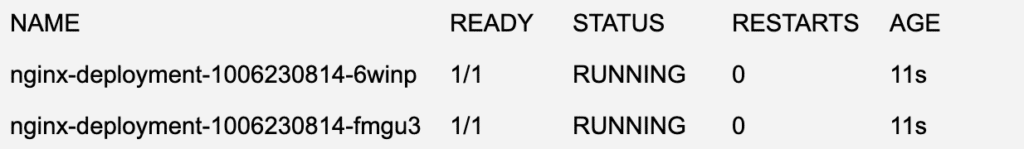
The next step should be to get a situation report on the status of the pods. To do this, we want to use kubectl get pods for our high-level status update.
The above kubectl output will let us know if our pods are running as they should be, taking us one step closer to the cause of our issue. Statuses other than RUNNING could indicate a problem with the pods.
With this information in hand, our next step is to dig a little bit deeper into the details with kubectl describe pods.
Name: nginx-deployment-1006230814-6winp
Namespace: default
Node: kubernetes-node-wul5/10.240.0.9
Start Time: Thu, 24 Mar 2016 01:39:49 +0000
Labels: app=nginx,pod-template-hash=1006230814
Annotations:    kubernetes.io/created-by={"kind":"SerializedReference","apiVersion":"v1","reference":{"kind":"ReplicaSet","namespace":"default","name":"nginx-deployment-1956810328","uid":"14e607e7-8ba1-11e7-b5cb-fa16" ...
Status: Running
IP: 10.244.0.6
Controllers: ReplicaSet/nginx-deployment-1006230814
Containers:
  nginx:
    Container ID: docker://90315cc9f513c724e9957a4788d3e625a078de84750f244a40f97ae355eb1149
    Image: nginx
    Image ID: docker://6f62f48c4e55d700cf3eb1b5e33fa051802986b77b874cc351cce539e5163707
    Port: 80/TCP
    QoS Tier:
      cpu: Guaranteed
      memory: Guaranteed
    Limits:
      cpu: 500m
      memory: 128Mi
    Requests:
      memory: 128Mi
      cpu: 500m
    State: Running
      Started: Thu, 24 Mar 2016 01:39:51 +0000
    Ready: True
    Restart Count: 0
    Environment:        <none>
    Mounts:
      /var/run/secrets/kubernetes.io/serviceaccount from default-token-5kdvl (ro)
Conditions:
  Type          Status
  Initialized   True
  Ready         True
  PodScheduled  True
Volumes:
  default-token-4bcbi:
    Type: Secret (a volume populated by a Secret)
    SecretName: default-token-4bcbi
    Optional:   false
QoS Class:      Guaranteed
Node-Selectors: <none>
Tolerations:    <none>
Events:
  FirstSeen LastSeen Count From SubobjectPath Type Reason Message
  --------- -------- ----- ---- ------------- -------- ------ -------
  54s 54s 1 {default-scheduler } Normal Scheduled Successfully assigned nginx-deployment-1006230814-6winp to kubernetes-node-wul5
  54s 54s 1 {kubelet kubernetes-node-wul5} spec.containers{nginx} Normal Pulling pulling image "nginx"
  53s 53s 1 {kubelet kubernetes-node-wul5} spec.containers{nginx} Normal Pulled Successfully pulled image "nginx"
  53s 53s 1 {kubelet kubernetes-node-wul5} spec.containers{nginx} Normal Created Created container with docker id 90315cc9f513
  53s 53s 1 {kubelet kubernetes-node-wul5} spec.containers{nginx} Normal Started Started container with docker id 90315cc9f513
This should give us the full rundown of the state of the pod when the describe command was run. The top sections tell us meta data-related information about the pod including when it was started, labels, and annotation. Below that, we start to see information on the status of the running containers as well as memory, CPU limits, and requested amounts.
Finally, at the bottom is where we can see relevant events that took place within this pod. This could include any potential issues with pulling the container from the container repository as well as issues with starting or scheduling the container to be run in the cluster. You may see statuses such as Waiting, Terminated, or even CrashLoopBackOff which can point you in the right direction as to why Kubernetes could not run your containers.
Logging
Once you are comfortable that your pods are up and running successfully in your cluster, Kubernetes will handle all of the dirty work of scaling and managing the state of your containers based on your deployment files. Kubernetes is an amazing platform for orchestrating your containers and running at scale, but what happens when something goes wrong within your application code and you need to dive in to debug the issue? Although logs don’t always have all the information required to fix a bug, the first place developers typically start is diving into the application logs to find more information about the root cause of the issue. To do this, we can use the kubectl logs command to get more information from our container logs. Running kubectl logs <your-pod-name> will dump the pod logs to the command line.
In real world scenarios, components are often installed across different namespaces as a way to isolate clusters into logically separated spaces within a single cluster. For example, let’s say you had installed nginx within your cluster within the ‘nginx’ namespace. You could access it’s logs with the ‘-n’ flag as follows:
Since pods can run multiple containers, you may want to explicitly mention the container that you want the logs for by using kubectl logs <your-pod-name> -c <my-container>.
When viewing logs while debugging an application, it can be helpful to stream logs to the command line in real-time similar to how the “tail” command works in linux. To stream logs you can add the “-f” flag to your log command:
It can also be helpful to take advantage of Kubernetes labels in order to dump log output from pods with a specific label, such as kubectl logs -f -l name=myLabel –all-containers
Another nice logging utility that can aid developers in gathering log information simultaneously across multiple pods is a tool called Stern. Stern allows you to tail multiple pods running on Kubernetes and multiple containers within that pod. The output and results are nicely color coded to make it easier to identify which logs come from which pods and containers. This is a nice improvement on the standard Kuberentes logging capabilities since in the world of microservices, more often than not you will want to gather logging information across multiple services at the same time. When wanting to tail logs from multiple pods and containers at the same time, Stern’s regular expression syntax for it’s queries makes life much easier.
Classic Debugging
As we’ve seen so far, kubectl allows us to interact with our Kubernetes cluster in various ways from getting information about our deployments and running pods to gathering log data. When diving deeper into debugging a running container, it can be helpful to gather more information by interacting with the running container in your cluster. The kubectl exec command can help with that by allowing you to remotely run any arbitrary command inside your running container in your pod.
As an example, let’s say you wanted to validate that you can reach a specific server or website from inside your running container. It might look something like this:
Or even better, when debugging it can be helpful to get an interactive command-line to your running container so that you can run any sequence of commands to help in debugging your issue:
In cases where you don’t have a shell to exec into, or in cases where a process in a running pod crashed which won’t allow you to exec into it, Kubernetes created a tool called kubectl debug which was introduced in Kubernetes v.1.18. With kubectl debug, Kubernetes injects a container called an EphemeralContainer into a running Pod which allows you to troubleshoot potential issues. In order to use kubectl debug there is some setup and configuration that needs to be done first. Martin Heinz did a great job describing all the setup required to use the debug tool in this blog post.
One additional tool that can be helpful in debugging remote systems locally is the kubectl port-forward command. This could be especially useful when debugging databases, for example. Just as the name suggests, kubectl port-forward allows you to tunnel traffic from your running Kubernetes cluster to your local system where you have access to a wider array of debugging tools.
$ kubectl port-forward nginx-deployment-1006230814-6winp 27017:27001
Forwarding from 127.0.0.1:27017 -> 27001
Once port forwarding is set up from your cluster to your local system, you can start your debugging tool of choice listening on the forwarded port in order to start debugging with the traffic received from your cluster. While this can be a handy tool to use in dev or test environments, this debugging solution isn’t typically practical for debugging production environments due to security risks.
Keeping Your Options Open for Kubernetes Debugging
In this post we have sought to explain some of the out-of-the-box Kubernetes application debugging and logging capabilities that you can take advantage of today. While definitely useful, some of these tools come with their own set of challenges and don’t always give you all of the flexibility you would typically have when debugging and application locally.
When debugging Kubernetes applications, it can often make sense to invest in off-the-shelf solutions that can give more powerful debugging capabilities that can help you get to the bottom of issues faster. Remote debugging solutions like Rookout allow you to instantly collect debug data from applications running in your cluster without having to compromise on security or spend excessive amounts of time in setup of debugging environments.
You might want to read more in our existing resources on how Rookout can help you debug Kubernetes applications.
You know the phrase “good enough”? As in, “it’s good enough right now, we can worry about fixing it in the future”? Well, when it comes to software development, I really hate that phrase. Let me explain why.
Simply, it’s because the concept of ‘good enough’ isn’t true. It’s the best type of paradox. Something is either good or it’s holding you back. There’s no in-between, especially when it comes to the state of your technology and your R&D team. Therefore, saying that your team – or your product – is ‘good enough’? That means that they aren’t. Because either they’re good or you can do something to make them better.
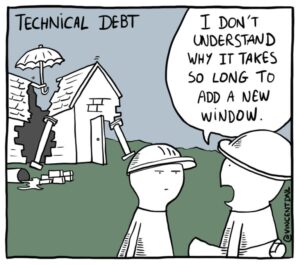
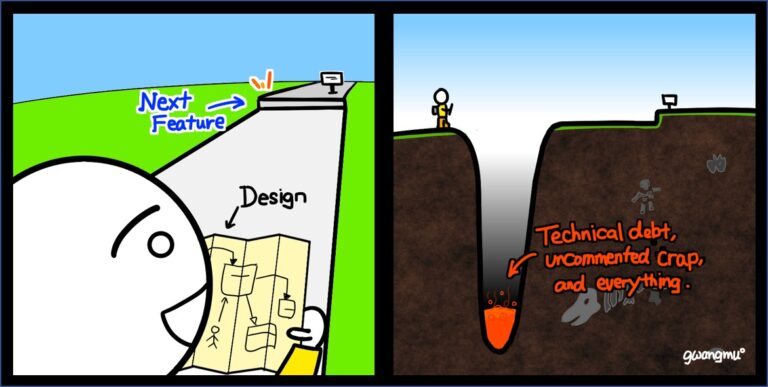
What does tech debt have to do with it?
Before we delve into the specifics of how to achieve the ‘better’, let’s take a quick look at what tech debt is and what it means in a tech company. According to Andrew Smith, “Technical debt or code debt is a metaphor that refers to all consequences that arise due to poorly written code and compromises in the development. This concept, in particular, includes the extra effort that has to be done to improve the software or to add additional functionality.”
Let’s be honest with ourselves. We’ve all looked at our teams and thought “hey, things are fine as they are – why fix what isn’t broken?”. And yet, if you really think about it, they’re all taking time, effort, and resources. And if something isn’t broken, it still doesn’t mean that it’s working as it should. And even more so, it doesn’t mean that it’s not affecting performance, velocity, and productivity. Quite the opposite- it most likely is.
Technical debt takes time. It pushes off other tasks, features, or whatever else that you wanted to do. And the worst part? You can work on it for weeks – or even months – and at the end of the day still have nothing to show for it. So if you don’t really need to do it – and you can get by perfectly well (at least you think so) by not doing it- well, why fix it? The customer almost never sees it. Almost no one but the R&D team knows about it. Who will ever know?
Ultimately, you and everyone else will. It can look like a waste of time to have to spend energy on taking care of, but I assure you that it’s not. If by resolving it you take five minutes off of every workday for your developers, it looks like nothing. But if you look at it over a greater period of time, that’s a significant amount of time saved (not to mention the resources invested in that time). And it’s not just the time saving, but also speeding up processes, smoothing out workflows, and saving significant resources.
Be ‘good’ and not just ‘enough’
As a tech company, the goal is always growth: a better product, more (and cooler) features, more customers, better revenue, and on and on. However, growth often comes with a price. And that price is maintaining a state of being ‘good enough’.
The more you grow, the more that being ‘good enough’ takes out of your team’s efforts, their tasks, and ultimately their motivation. Let’s say for instance that you’re a company of one developer. With tech debt, it will take that single developer a bit more time to accomplish what he needs to. But what if you were a team of 20 developers with tech debt? It means that everyone will have to work around it to accomplish what they need to, which will eventually end up costing you days – at the very minimum – from your R&D plan. Bottom line: the more you continue to work around your existing tech debt, the more tech debt you’re going to generate, and so on and so forth, until you’re drowning in tech debt and can’t find your way out.
Going beyond the good
Dealing with your tech debt – and propelling yourself beyond the lame excuse of ‘we’re really good enough now’ – shouldn’t be an overwhelming endeavor. Begin by:
Looking into what takes the most time in your team. You need to filter whatever isn’t tech debt and what is holding you back.
Understand what needs to be solved first and what has dependencies. Prioritize accordingly.
Find the time to actually do it.
That third step is the hardest. We’ve all been there- features need to be made, customers have demands, and the list goes on. Finding the time to take care of it and optimize and fix it will be difficult. But it’s not impossible. Define a percentage of the work in your roadmap for tech debt (like we do here at Rookout) or try adding the tech debt into roadmap tasks. If those don’t work for you- here are a few ideas on how to minimize waste in your R&D.
Striving for greatness
If you find yourself using the statement ‘we’re good enough as we are’, it’s time to take a second look and reassess.
Are the tools and processes that you have in place really helping your team? Or are they holding them back? Adding tools and processes into your devs’ workflows should be done to make their lives easier and more efficient, not to create more things that they are unable to maintain. One way of doing that is with a live debugging tool that enables them to collect any type of data on the fly with no extra coding, redeployments, or restarts. So yes, you could claim that your developers are good enough without a live debugging tool. They could step-by-step debug, write endless log lines, or wade through the murky waters of lacking the necessary data to understand their code. But why have them be ‘good enough’ when they can be great?
So go ahead. Fix it. Reassess the rest of the tech debt. Then repeat the process. It’s never enough- but doing the most you can to optimize everything you can will elevate you and your team from ‘good enough’ to great. And isn’t that where we all want to be?
When working with Rookout customers, one of the most commonly heard requests we hear is a plea for “context”. When trying to debug complex applications, setting a Non-Breaking Breakpoint and fetching a full view of local variables and stack trace is a necessary first step. But in a dynamic, distributed environment, this first step is not always enough.
“Give me the ability to see those debug snapshots on a timeline” is one request we hear frequently. “Help me identify specific transactions, users, or accounts when setting a breakpoint” is another. Bringing those requests together led us to dig deeper into Distributed Tracing and to try and bring Distributed Tracing into our cloud-native, production-grade debugger. Here is what we learned along the way.
Debugging is hard. Cloud debugging is harder.
Debugging cloud-native applications is no easy task. Traditional debugging methods such as step-by-step debugging are almost impossible to use in cloud-native environments since there is never a single server to connect to and debug, as the environments are dynamic and containers, pods, and serverless functions spin up and down on the fly. We often fall back to log based debugging, which brings its own set of challenges in cloud-native environments. Logging costs become significant, as does performance impact. And log based debugging means having to add a line of logging code, waiting for a new release, and wasting more precious development time while delaying issue resolution.
Making things worse, debugging cloud-native applications takes away one of the most reliable debugging methods: Debugging Up The Stack Trace. In traditional debugging, when an exception is thrown, we can usually use the stack trace to learn which function invocation led us to the problematic situation. But in a distributed, complex, and dynamic environment, there is no single process, no single app. No single stack trace. And this is where Distributed Tracing comes in.
Distributed Tracing and OpenTracing
Distributed Tracing is a method used to profile and monitor distributed microservices-based applications. By enriching requests and function calls with context data, we make it possible to connect the dots, giving us a complete picture of the behavior of our application.
OpenTracing and OpenTelemetry, the most commonly used frameworks for implementing Distributed Tracing, give developers API specifications that let us define how said context is passed and is later read by Tracing tools such as Jaeger, Zipkin, Lightstep, and many other observability and APM tools used today.
The result of implementing the OpenTracing or OpenTelemetry API in an application is the ability to see a detailed timeline view that shows a breakdown of requests and function calls across distributed microservices. This gives a developer the ability to understand what is going on in a distributed application, where services are running in parallel and function dependencies are impossible to analyze otherwise.
This gives us almost everything we need to troubleshoot a cloud-native application… Everything, that is, other than the local state of the application this context and timeline relates to. In other words – where are my local variables?
Show me the Data
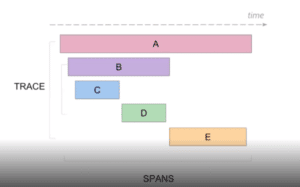
By looking at the Tracing Timeline, you can get a quicker and deeper understanding of your code flow, such as which call happened when, which transaction happened by which process, and what our application state was at the time. It is presented throughout a Time Dimension graph that adds an insightful enrichment layer to your session. Essentially, it’s a map that tells you the story of a piece of code at a specific moment and context. It empowers developers to easily and quickly troubleshoot complex issues, get to the root causes, and ultimately become far more effective.
The ability to look at our new Tracing Timeline inside the debug session has opened a unique and powerful layout. Developer teams can create a clean view of every request coming in and out. Using Spans, a named, timed operation representing a piece of the workflow, they can get a timeline view of every transaction that happens, including information that accompanies transactions including when it passes between different services.
Rookout now combines tracing information with code-level, context-specific debug data, both of them side by side and gives developers even deeper insight into application behavior, taking Observability into its next evolutionary step: Understandability (the ability to not just view the internal state of the application, but also to fully understand its structure and function).
Level up your tracing
The next time your team finds themselves in a customer-related troubleshooting session, they can make their lives – and yours – easier in one simple way. By using Rookout’s live debugger and viewing debug data complemented by the new Tracing view. This holistic view ensures a seamless and powerful cloud debugging experience
To be as effective as you can get, you must conclude the debug session and level up with other compliment visualization updates from Rookout such as ourLive Debugging Heatmap and Agile Flame Graphs.
When you talk to an enterprise development team these days, there is a good chance they are in the midst of either migrating applications to the cloud or building a Cloud Native greenfield application. While there are many approaches to running those applications in the cloud, Kubernetes often comes to the forefront as the platform of choice. It provides a powerful container orchestration platform, which provides plenty of room for growth as your application evolves.
Of course, with all the power and amazing new abilities that Kubernetes brings, it can often be difficult to navigate for the inexperienced user (and sometimes even the experienced user). Most would agree that managing, deploying, and troubleshooting applications running in Kubernetes has a learning curve. The rest of this article is dedicated to some tips on improving the ease of use and understandability of Kubernetes when getting started.
1. Use Helm to Manage Packages
I’ve talked about Helm from a technical perspective in aprior article, but it’s worth discussing how it can add value to not only your process but also to how your customers consume your software. By packaging up your Kubernetes applications using Helm charts, it allows your customers to quickly and easily consume those applications or services, without having deep insight into the inner workings of those services. Simply execute a few commands from the CLI and your application is up and running.
This is also invaluable when your customer-facing team goes out to deploy your software with your customers. Applications with long and arduous setup processes add additional burden on both your customer and your internal team responsible for deploying them. The long-term maintenance costs of managing those deployed applications can add up as technical debt over time, slowing down your development and engineering — as developers are often required to jump in to help when things go wrong. Now Helm is by no means a magic bullet to solving all of these issues, but it does help to reduce complexity and improves the understandability of the deployment process of your applications in Kubernetes.
2. Use a Remote Debugger for Debugging
Application debugging is tough enough as it is without adding the complexity of Kubernetes as your run-time environment. When you discover a bug in your production or pre-production environments, sometimes you just want to jump right in and start debugging your code right where it’s running. It’s not always a simple task to connect a debugger; and sometimes, it is not even possible due to security and compliance reasons. In those cases, it’s back to the typical approach of adding logging code and running through the build, deploy and release process until you find the data that helps you pinpoint the defect.
Remote debuggers are the perfect solution to be able to better understand your code right where it’s running, without all the overhead of adding logging or creating defect reproduction environments. Remote debuggers typically run alongside your application as an agent or an SDK and allow you to have a traditional “local debugger” experience, but with a remotely deployed application. These can be an invaluable part of a modern development workflow and cut defect resolution times dramatically.
3. Manage Kubernetes Resources with Namespaces
Using Kubernetes namespaces can help to logically partition deployed services, so that your cluster can be more easily understandable and usable by multiple teams or users. By default, Kubernetes instantiates a default namespace when a cluster is provisioned and it’s up to the administrator to create additional namespaces. These namespaces provide a nice way to attach multiple authorization strategies or policies to these logical partitions of the cluster. This means that multiple services, teams, or projects can use the same cluster for different purposes or with different levels of security, without the need to create separate clusters for each use case. Teams could even utilize one cluster to simulate multiple deployment environments such as dev, staging, or UAT. This partitioning of environments ensures that naming conventions of deployed components can be maintained without conflicts across each environment.
4. Try a Terminal or Browser-Based UI
In working with many customers who have dove headfirst into microservices development on Kubernetes, I have seen many of them adopt interactive terminals or graphical UI tools for managing and interacting with their cluster. This can make navigation of the cluster components (pods, services, deployments) much faster and even reduce the learning curve in finding your way around. They’re often quite easy to install and can bring efficiency improvements to day-to-day workflows.
There are many different options out there. One that is free and easy to use isK9s. K9s provides a simple and efficient cluster viewer directly in your command line terminal. Rather than having to rely heavily onkubectlcommands, you can simply navigate your cluster using simple keyboard shortcuts. Another open source option (but this time browser-based) for better understanding your cluster isOctant, which allows you to navigate and interact with your cluster directly from your browser. Whether you’re using one of the above or perhaps the cluster management capabilities directly in your cloud provider, having visual tools with shortcuts can help speed up your workflow and reduce complexity.
5. Consider a Service Mesh
A service mesh is a tool that is used to manage and simplify high volume communication between microservices running inside your Kubernetes cluster. They attempt to abstract and make easier tasks that are consistently required regardless of the type of application being built — such as inter-microservice communication, discovery, security, tracing, and monitoring. By using a service mesh, you can separate networking, security and observability logic from your application-specific business logic, effectively eliminating the need to maintain your own code for these specific capabilities.
Some of the main players in this space areIstio,Linkerd,andConsul. These solutions typically run on top of your existing infrastructure as a sidecar to your pods. When it comes to the understandability and maintainability of your application, the more of these core application runtime capabilities you can offload from your development team, the better.
Conclusion
Diving headfirst into Kubernetes can be a daunting task, but there are technologies out there that can make life easier. Whether you’re just getting started down the path of Kubernetes adoption or are well on your way, it never hurts to consider adopting new technologies or processes that can improve the understandability of your Kubernetes environment.
This article was originally published on The New Stack
There’s no doubt about it: data is the new gold. The last decade has created a revolution in everything related to data, whether it’s the creation of huge amounts of data or anything related to consumption, collection, processing, analysis, and decision making.
In my previous experience as a data scientist, I can say that algorithms; whether a simple algorithm or an extremely complex neural networks model; as good as they may be, cannot beat bad data. You can spend hours working on tweaking your model’s hyperparameters, but once you get the right data and enough of it, everything suddenly just…makes sense. Quality data is a game changer, especially when the ability to produce it is simple and comes at a low cost.
When it comes to software development, data is a key part of your success. Visibility into any part of your product is crucial, and without it, you are walking blind. These days, the ability to get data isn’t enough. Speed and simplicity are also critical for operating in such a dynamic world. That’s why I’m going to explore some data basics and how data can be utilized to not only reduce debugging time and effort but also increase software development efficiency. So let’s get started!
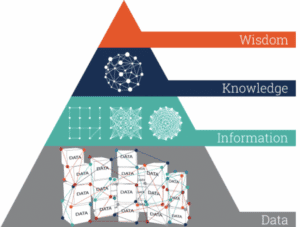
Data != Information != Knowledge
Many make the mistake of thinking that the existence of data makes it possible to draw direct conclusions. But that couldn’t be further from the truth. Look at the pyramid of DIKW (data, info, knowledge, wisdom), for instance. We immediately see that data is at the bottom of the pyramid. There are several steps and processes that have to occur until conclusions can be drawn and actions are taken.
To begin with, several pieces of data need to be collected together in order to generate information. Think about a log line. Each log line is constructed of several data pieces: the timestamp, file and line number, the developer’s log string, printed variables, and more. And each one of them is meaningless until combined together. Together this log line has a meaning – we’ll call it ‘information’ (event/insight) – and is more than just a couple of data pieces.
Yet, information isn’t enough. Let’s be honest with ourselves, simply sending logs somewhere doesn’t just solve the issue, right? When you have an issue that needs to be resolved or a decision to make, you’ll probably look for information in that specific context. For example, when driving, you won’t pay attention to every red light. You will however pay attention to the ones that specifically affect the lane you’re driving in. The same rule applies to debugging. Not all of the collected information interests you. Only the information that’s in the right context of what you are trying to resolve does.
When you combine context and information, you create knowledge. When you gain enough knowledge and understanding of your code patterns, you can decide what should be done. This is the last part of the pyramid (wisdom).
Data is the new gold, and gold is expensive
I previously stated that the more data you have, the more informed you’ll be, and thus the faster you’ll be able to make decisions or resolve issues. But I didn’t say it was free. It’s not just a matter of quantity, but a matter of quality.
You definitely can’t – and wouldn’t want to – store all the necessary data as it will cost you a fortune (in terms of financials and performance). There needs to be a balance between what must be maintained and stored on a regular basis and the ability to produce more data on demand, instantly, independently, and effortlessly, in the most comprehensive way, with minimal impact on the day-to-day work. No matter what you are trying to achieve, if you have the right tools to extract the data you need with no delay and with minimal effort, it will reduce the urge to constantly collect data.
Different layers of information
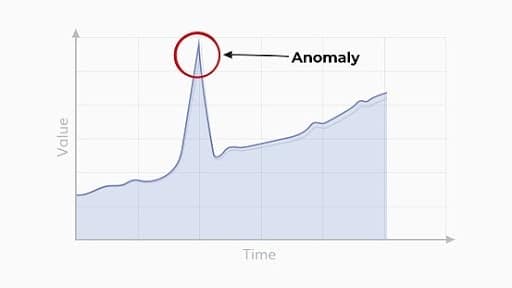
Information can be treated like insights. Several insights can be aggregated together and create another level of insights at a higher level. This means that data processing techniques can be used, such as aggregations, data visualization, statistics, or the like to create another representation that affects our understanding. Higher levels of insight can help to reach decisions easier and faster.
For example, see how easy it is to detect the anomaly point when you visualize the data points. Checking each data sample could take time, but looking at this graph, it took less than a second.
Debugging with a local debugger requires you to chase the issue by stepping in, stepping out, and stepping over code/a function. This pursuit is completely eliminated when you let the data flow and analyze it separately using the power of data processing.
One of the biggest challenges in the quest for the right data is that the world is ever-changing. That means that even if we take a snapshot of any piece of data today we will still see new use cases tomorrow.
If in comparison, we refer to software development, we are able to see that in many cases a bug that’s discovered in the production environment wasn’t caught by the tests, but instead went under the radar when tested with synthetic data in staging. Therefore, it might not be reproduced in an environment other than the real and live environment. For that reason, you always want to use up-to-date information and track what’s happening in real-world cases.
A single sample isn’t always enough for decision making
Try to imagine the last time you clicked many times on “Step Over” when you were trying to debug a for loop. Wasn’t it simply easier to collect all the iterations and analyze them afterward?
A single sample is useful where a problem is deterministic and always recurring, such as in a local environment, in production, or in any experience. But there are cases where certain issues are environment-dependent (because lower environments don’t always perfectly mimic prod), or depend on the state and collection of actions of a specific user. The other types of issues are harder to reproduce and one sample is not always enough to determine where the issue is.
You probably know which code is related to the issue, but you want to collect as many samples as you can so that you can analyze when it happens and why. Seeing many samples gives a broader context and can help to pinpoint a root cause that is not easy to detect.
The intersection between software development and debugging
If you have survived this far, congrats! You understand how much power data has and how it can transform your analysis capabilities. And that’s exactly why using a data-driven debugger is so essential.
The use of a data-driven debugger enables your software developers to reduce the time needed for collecting debug data from remote environments. With it, they’ll be able to get the relevant data they need in seconds from any environment, at any point in time, from any part of their code, which will reduce the time needed to resolve customer issues. Additionally, from a performance perspective, a data-driven debugger is a data-centric tool and, as such, has a minimal footprint on your application, as it provides developers the flexibility to collect and analyze data on demand, and only when needed. And we know that you know how beneficial being able to do that is.
So what are you waiting for? Hit that data flow. We recommend doing it with Rookout (did anyone say minimal footprint, any environment, and faster MTTR?). But really, whichever tool you choose, just do it (not to steal Nike’s motto or anything). The bottom line? Data makes you smarter and the future of debugging is data-driven debuggers 🙂
Whether you wholeheartedly agree or vehemently disagree with that statement, I think we can all agree that debugging, at the very least, has room for improvement. In fact, the way software developers debug their code hasn’t changed much. Of course, there are now a wide array of observability and monitoring tools available to make a developer’s life easier, but when we look at the process developers typically follow when debugging code, it’s stayed relatively unchanged over the years.
Having the right tools available definitely improved the overall debugging process, but they’re not the only factor. Internal organizational processes are equally as important and should be adapted to make developers’ lives as smooth and stress-free as possible while still maintaining the proper levels of organizational security and compliance. Inefficient or highly restrictive processes, while great for the compliance team, can adversely affect the velocity of getting to the bottom of issues quickly. The right solution is typically a combination of adapting those processes to fit the company culture, along with a combination of tools that allow for compliance with industry standards and best practices.
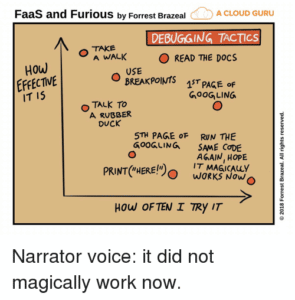
How Developers Debug Code
When you talk to developers today about how they debug their applications, the process is typically not all that different than it was many years ago. The standard approach to debugging is still through the use of logging frameworks. Of course, teams are taking advantage of things like application performance management (APM) tools and other tools in the monitoring and observability space, but when you look at the primary method of debugging issues that require developers to dive into the code, logging is typically the main approach.
The process typically looks something like this:
When a defect is found, developers will first go to the log files on the production or pre-production servers in the environment where they are debugging. If they can’t find information in the logs to help them get to the root cause of the issue, they go back to their code and add additional log lines, finally sending their code through the process shown above. For highly advanced organizations, the process can take minutes or hours, but more often than not, this process drags on for days – or even weeks. It becomes especially time-consuming when the defect developers are trying to find and remediate is in production. In these cases, the cost to the business can be staggering; there’s got to be a better and more efficient approach to debugging.
Where Tools Can Help
While new and shiny tools don’t always solve all debugging problems, they can often ease some of the pain developers face and, in the process, make their lives a little bit easier. Debugging, observability and monitoring tools can get developers the data they need to solve problems faster than the more traditional method of digging through logs and using trial and error.
The place many organizations start when considering diagnostic tools is with APM. These types of tools focus specifically on monitoring and management of the application availability, and can help to collect metrics and other relevant application information that can aid in pinpointing infrastructure issues. Most often, these tools are not actually used by developers themselves, but rather operations or production support teams to ensure availability and performance thresholds of applications.
Another critical category of telemetry are tracing tools, which can help developers better understand how requests flow through multiple tiers of applications and even help identify error rates and latency. There are many vendors selling this category of tools, but there are also open source options which allow developers to integrate tracing into their applications via a vendor-neutral approach.
After diagnosing an issue with an APM solution, there is often a handoff to development to remediate the issue. When developers need to debug, they often use their local IDEs or, even better, a remote debugging solution. Remote debuggers are used directly by developers to simplify debugging of applications in remote environments. These tools help developers get to the bottom of customer issues faster by giving them direct access to the underlying application data in a safe and secure way while the application is running without stopping it or having to redeploy it. A major benefit of remote debuggers is that they can give developers the data they need from production environments without compromising security or requiring developers to have direct access to sensitive environments. While remote debuggers and other debugging tools are not a silver bullet, they can be a critical component that empowers developers to better address critical issues.
Fixing Organizational Problems
If solving customer issues is taking longer than expected or is potentially hurting your brand, it’s critical to sit down with your development team and use a data-driven approach to identify where the problems lie. Do a deep dive into your issue tracking or ITSM system to identify trends or recurring issues within particular application components. Development teams can often become so overwhelmed tackling issues and building out new features that valuable information in these internal systems can go untapped. Customer issues and defects should be reviewed periodically to assess things like business impact, cost to fix and alignment with the product roadmap. There is valuable information that can help focus the team’s effort on time-saving activities as well as improving the product, making for happier customers.
Another area to look at is your software delivery process. Are there bottlenecks in your delivery pipeline that could be made easier or more efficient but have been overlooked? The speed and efficiency of your software delivery pipeline has a direct impact on developers’ ability to debug effectively and can contribute to a broken or slow debugging process. Developers should have the ability to push code into new environments as quickly as possible to remove slowdowns from too much context switching. This means automating as much of the delivery pipeline as possible, removing unnecessary manual deployment approvals and shifting left as many activities as possible.
When it comes to empowering developers and fixing broken debugging processes, organizations should focus on fixing organizational bottlenecks as well as equipping developers with tools that can save them time and improve their daily workflows. Focusing on these areas can increase development team velocity and eliminate costly day-to-day slowdowns which add up over time and negatively impact productivity. With a few key changes, debugging can be a much more manageable and predictable process.
This article was originally published on DevOps.com
If this past year has shown us anything, it’s the importance of resilience. Businesses of all sorts have had to find creative ways to get through a very tough time. And one of those ways is through technology. Companies that never planned to be technology-driven are now having meetings on Zoom, managing a remote workforce, and adopting new software.
As the CEO of a software company, I understand the importance of delivering value to these businesses. One problem every company wants to avoid is major outages. We see the headlines every day: Robinhood enacted trading restrictions because $GME stock was soaring and its platform wasn’t prepared; Slack crashed on the Monday when everyone seemed to be getting back to work in the new year.
And these are expensive problems. According to Gartner, the average cost of IT downtime is $5,600 per minute. Of course, every business is different, and a business such as Amazon may lose millions in an hour, while a small startup’s outage may go totally unnoticed.
But I want to push back on the idea that these outages affect larger companies more than smaller ones. Yes, the big outages are the ones that get bad press. And yes, large companies may lose more money in terms of raw dollars. But what about if we look in terms of percentage of revenue lost due to an outage? For many startups, their lifeline is a couple of big, happy customers. If even one of them churns, that could drastically impact the startup’s ability to survive to the next quarter.
I also want to push back on the notion that resilience is just about whether a system is up or down. In the modern world of DevOps, it’s the job of software developers to ship reliable code just as much as it is the responsibility of SREs to care about system health. Because the fact of the matter is, even if a system is technically up, a bug in that system will undoubtedly cause friction for the customer it is affecting. That bug is preventing them from purchasing an item, clicking on a button, or whatever other task they are trying to accomplish.
Businesses should think of these software bugs as mini outages, and the costs add up. A recent study published by the Cambridge Judge Business School found that developers waste 620 million hours a year debugging software failures, which ends up costing companies approximately $61 billion annually. The report also revealed that software engineers spend on average 13 hours to repair a single software failure.
So it’s not just about the revenue you are losing when your website isn’t functioning; it’s also the revenue you lose when frustrated customers visit competitor websites and the amount of engineering resources spent finding and fixing bugs. POCs are failing, NPS is declining and these problems are only getting more expensive and complex with the rise of cloud and microservices architectures.
According to a recent whitepaper from analyst firm IDC that our company sponsored, “Distributed architecture provides scalability and simplified development with the use of microservices, containers and the like. However, the very benefit for which this architecture was designed is the one which denotes an inherent struggle to understand and troubleshoot it — as code continuously spreads and shifts over multiple repositories.”
To ensure that businesses don’t find themselves in such a situation — and to prevent themselves from ever getting there — here are a few key ideas to implement:
• Place modern methodologies and processes in your R&D team’s workflow. By relying on new resources and taking a logical approach to confronting coding problems, developers will be able to improve their understanding of debugging — and their software as a whole.
• Maintain awareness when using third-party code. Applications are often comprised of a significant amount of third-party code, which introduces an inherent risk factor. Even packages that have been downloaded millions of times can be buggy, and even if they’re not buggy, their API’s documentation can be outdated and your developers will end up using it wrong.
• Implement modern production debuggers. By adopting next-generation debugging tools that can get live data from code, developers will be able to resolve issues faster and more efficiently. Outages and downtime will be reduced significantly, leading to much happier customers.
The rise of DevOps means that reliability is no longer solely the responsibility of ITOps and SREs. The ones writing the code today — the software developers — are just as responsible for providing robust services and great customer experiences. To address software bugs, organizations need to shift resilience left and adopt modern tooling to ensure rapid debugging and optimal performance.
As the world of technology continues to progress, so are the technologies that developers work with on the daily. Whether it’s cloud native, Kubernetes, serverless, or distributed architectures, every developer team has encountered the difficulties of working with them. Even more so, they’ve felt the challenges associated with trying to find the solutions to those same difficulties. But what if it was as easy as opening a book? Well, a virtual book, to be exact (or blog, or article, or even a youtube video, but I digress).
In our experience, it is. Gone are the days of having to understand the dewey decimal system to find one answer. Oftentimes when you’re creating a new feature, or fixing a bug, or simply trying to figure out what the heck is happening in your code…well, you just need answers, and you need to be able to get to them as quickly as possible.
To make your life easier, we’ve put together some of our top online authors, websites, and reads for that exact reason. Dive into the world of Kubernetes, cloud native, and serverless as we recommend our top digital places to go when you just need to know. So grab a coffee, settle in, because we’re going on a reading adventure.
Kevin Sookocheff, Distributed Systems
If you’re looking for information on anything from different architectures, distributed systems, to systems engineering, this is the best place to start. Peruse your way through the different topics. But if you’d like to know our favorite article? It’s the ‘A Guide to the Kubernetes Working Model’.
Dustin Specker, Kubernetes Insights
Dustin Specker is an independent blogger who likes sharing what he learns about Kubernetes with his readers. He began his journey back in 2013, with web technologies such as Ember.js, AngularJS and Node.js, and has recently transitioned to Kubernetes and Golang. When looking for Kubernetes updates, he’s one of the authors we always love to read.
While she may not be blog-specific, she’s still a wealth of information. Anais, a CNCF and #100daysofkubernetes ambassador, is an inspiring and educational voice in the digital world of Kubernetes learning (and, of course, tech in general). With awesome and educational posts on Twitter and detailed Youtube tutorials, she’s definitely a space to go and check out.
Learnk8s, Kubernetes Training
Learnk8s is a company that offers Kubernetes training for engineers. While they’re great at what they do, they also have a running blog that teaches their wide audience on a variety of topics, such as troubleshooting Kubernetes deployments, developing and deploying Spring Boot microservices on Kubernetes, and so much more. Head over to read, because there’s a wealth of information there that’s relatively untapped.
DevOpsIsh, Tech News
DevOpsIsh is one of our favorite funnels of Kubernetes-focused information. Chris Short, a CNCF Ambassador and the curator of KubeWeekly, makes sure to update it on a weekly basis with all of the latest tech-related news, trends, and DevOps must-reads. If you’re not sure where to begin, we recommend checking out his weekly post and then doing a youtube-style deep dive from there. You never know where you’ll end up, but isn’t that the fun of it?
Liz Rice, Best Kubernetes Reads
Liz Rice does it all. She’s a one-stop-reading-shop for all Kubernetes and tech-related content. Not only is she the author of a few Kubernetes-focused books, she also runs a blog, joins podcasts, and gives some pretty awesome talks at various conferences. So whether you’re looking for something Kubernetes specific, or just some general tech-related content, she’s an awesome source of information.
Read On
Not to sound like I time travelled from the stone age, but the magic of the internet is that there is a perpetual wealth of information waiting just a few clicks away. So take advantage of it. We know we do. And for more Kubernetes, cloud-native, and serverless information, feel free to check out some of our following blogs we wrote too 😉