Rookout is now a part of the Dynatrace family!

Table of Contents
Get the latest news

Eating Our Own Dog Food: Debugging in Production

Dan Sela | Director of Engineering

5 minutes

Table of Contents

Rookout’s Live Debugger is a product that’s created for developers, by developers. As such, our R&D team knows firsthand the actual challenges that developers face daily when debugging in production. It is a constant struggle to gain an understanding of what’s happening in their complex environments without accidentally breaking something, waiting for another deployment, or having to write additional lines of code.


But Rookout developers have a leg up on these challenges, as they have Rookout. With the introduction of the Golang SDK, our developers were able to dive even deeper into understanding issues that arose and were able to resolve them quickly. This was (and is) especially useful – and time and cost-effective – when helping customers troubleshoot in their own environments.


Dan Sela, Rookout R&D Team Lead, shared with us a behind-the-scenes look at just how useful the Rookout Live Debugger is to Rookout’s own team.

When It Only Happens In Production


There’s no better time to use a live debugging tool than for an instance in which a client is experiencing an issue that only occurs in production.


Specifically, this happened when helping a Rookout client add a user to a specific org. Each time the client attempted to do so on their own it kept failing. 


Yet, when Rookout developers did so in the staging environment, it worked. They were able to add other combinations of users. The only user they were facing an issue with was this specific user. They understood that the issue they were facing was only happening in production – and they weren’t able to reproduce it.


Luckily, that day, the Rookout Go SDK had been pushed to staging. Understanding that it was their only hope in helping the customer resolve the issue, the team immediately pushed it to production. 


Rookout’s developers were able to find the bug by placing a non-breaking breakpoint, adding the user that caused the issue, and seeing where the code stopped running. They then were able to go deeper inside and find the line that was giving the error. Finally, they were able to fix the bug, deploy to production, and – success! – they were able to add the user into its normal function. “We were able to find the root cause and deploy the fix in less than half an hour”, mentioned Dan. 


Shooting In The Dark


That wasn’t the only time that the Live Debugger has been useful for our developers. Rather, they know that they have an extremely useful tool at their fingertips to employ when helping customers troubleshoot issues and debug in production.


“One of the best features of Rookout is that we allow you to send your data to different targets, creating an easy and seamless experience for using multiple tools to really understand and troubleshoot your code”, said Dan.


However, for one specific user, this wasn’t the reality. They approached our customer success team and told them about their inability to use the Datadog target through Rookout in their production environment.


Dan and his team immediately set a live session with the user to understand what was happening and resolve it quickly. After setting non-breaking breakpoints in the Datadog target code they saw that they were getting an error 403- an unauthorized error. 


The developers then connected to their production controllers and placed a non-breaking breakpoint in the code that sends data to Datadog. They began by creating a different token. Seeing all the permissions, the user was able to use a token of our demo Datadog environment, and his token still didn’t work. However, it was working with Rookout’s demo environment. So the team dug deeper.


The pressure was building for the user while waiting for the Rookout developers to find and fix the issue. There was nothing in the logs and there was no indicative error. That’s when they turned to Rookout. Using Rookout, they found the source of the problem in just a few minutes: they understood that Rookout and the user hadn’t been sending the data to the right place. The team quickly added the option to choose a specific data center for users to send their data to so that the issue never occurred again for any user. “It was great”, said Dan, “Using Rookout felt like we were turning on a light. We were finally able to see things that we wouldn’t have been able to otherwise. Through our use of Rookout, we were able to quickly find the source of the issue.”


Results


In both situations, the bug that each one was experiencing couldn’t be reproduced. Our developers were able to help our customers get to the root cause of the issue quickly. In both cases, Rookout proved to be a great and efficient tool in helping navigate legacy code and issues that arose that couldn’t be reproduced. 


“I always forget on the day-to-day, when taking care of other things, how incredible using Rookout in production is, and every time I sit down to help a customer or fix one of our own bugs, well, I really can’t imagine going back to any of the classic debugging methods that were previously used”, said Dan.  


“We are able to resolve issues for our clients much faster, because we are now able to gain insight into issues that otherwise we wouldn’t have been able to reproduce”, continued Dan. “By using Rookout ourselves, we are better able to understand the pain of developers who work without it. It better equips us to build better features that we know and feel the need for.”

Rookout Sandbox

No registration needed

Play Now

Table of Contents
Get the latest news

Golang Debugging Tutorial

Subha Chanda | Guest Author

10 minutes

Table of Contents

Golang (or just Go) is a well-established programming language ground built for speed and efficiency. Robert Griesemer, Rob Pike, and Ken Thompson designed the language at Google. It was first announced to the public in 2009 and it was made open source in 2012.

Go is the preferred choice among developers, but its simplicity can also leave it vulnerable to bugs and other programming issues.

In this article, you will learn about common bugs in Golang programs, as well as some of the traditional approaches used to debug them. You’ll also learn about emerging tools like live debuggers available for Go debugging, which are similar to classic debuggers but can help you get instant debug data and troubleshoot easily and quickly without adding new code or waiting for a new deployment.

Why Choose Golang?

There are several reasons to use Go. Here are some of the biggest benefits:

  • Learning Curve – Golang is one of the simplest programming languages available, so it’s easy to work with.
  • Excellent Documentation – The documentation is straightforward and informative.
  • Great Community – The Golang community is supportive, and you can get help through Slack, Discord, and even Twitter.
  • Build Anything – Golang can be used to build anything from standalone desktop apps to cloud apps. Go also has concurrency, which means it can run multiple tasks simultaneously.
  • Goroutines – The introduction of  goroutines, or activities that execute concurrently, has made Go a great choice for programmers as well as for DevOps engineers. Goroutines are cheaper than using threads, and the stack size of a goroutine can shrink or grow according to the need of the application. Another benefit of goroutines is that they communicate using channels, which prevent race conditions from happening when accessing shared memory.

Despite its useful features, debugging in Golang can sometimes be frustrating. The print statement is often used to debug small programs, but this can complicate the process when working with a large program. Typical debuggers offer limited features even though they work with Golang. Some features of Golang can confuse debuggers and cause incorrect outputs. Because of such issues, it is important to know which tool to use when debugging Golang.

Common Bugs in Go

One of the common bugs to watch out for is infinite recursive calls. If you do not add an exit condition inside a recursive function, the function will run until the system runs out of memory.

Another common mistake by beginners in Go is assigning entry in nil map. Assigning a value using the below syntax will create a panic error:

var m map[string]float64

m["pi"] = 3.1416

This is because the map must be initialized with the make method.

m := make(map[string]float64)

m["pi"] = 3.1416

There are other mistakes that developers should be aware of as well. Check this article to learn more about them.

Debugging in Go

Golang is still a relatively new language, and some of its nuances aren’t commonly known yet. This can lead to problems when writing code.

As noted, one standard option for debugging is to use the print statement. Another is the open-source debugger GDB. But GDB wasn’t explicitly built for many newer features of the language, such as Goroutines. The Delve debugger was designed to address this need.

Another option is using the Log package to create custom logs for your code.

Following are details on the various options.

Go Print Statements

The most common way of debugging code in any programming language is using print statements. This is the first approach most developers take because it’s easy to get started by importing the fmt package into the code. You don’t need to install a third-party tool. However, this approach is not as comprehensive as others.

The fmt package in Golang provides three ways to print anything to the console:

  1. printf, which allows you to format the numbers, variables, and strings;
  2. print, which only prints the string passed as an argument; and
  3. println, which does the same thing as Print, then adds a new line character (\n) at the end of the string passed to it.

Logging

Logging is another method of debugging code in any programming language. But systematic logging can also be done too broadly without considering the use case, leading to spam logs and further problems.

For basic logging, importing the default log package is enough. Here’s an example snippet:

package main
import (
    “log”
)
func main() {
    var a int = 10
log.Print(“logging the value of a. a =”, a)
}

Running this code will give you a log and the date and time.

You can also take it a step further and integrate with the OS package to write the logs into a new file. This is the standard approach when using logging as a debugging method.

With a proper logging method and format implemented, you can catch errors more quickly. You can also automate logging notifications so that you’re notified whenever something goes wrong. Even if you use a different method to debug your code, it is always a good idea to implement a proper logging system.

The default log package works well, but third-party logging frameworks are also available. Two common choices are glog and logrus.

Delve

One of the most popular options, Delve offers an easy-to-use, full-featured Go debugging tool.

To get started with Delve, install it on your machine using the following line:

go install github.com/go-delve/delve/cmd/dlv@latest

For macOS, you also need to install the developer tools. Check the official documentation for instructions.

You can check if Delve is installed on your computer by typing the dlv command into the terminal. You should see an output similar to the below image if you were successful:

You can also check the version by typing dlv version in the terminal:

See what Delve has to offer by using the dlv help command in the terminal. To debug a program, execute the dlv debug command. Attach the filename at the end of this command, and debugging will start. For example, if you want to debug the main.go file, run the command dlv debug main.go. It is also known as “delve server” because this is a running process waiting for instructions.

After entering the repl provided by Delve, check the available commands using the help command. You can also check the (nearly) full list of Delve commands.

Breakpoints

Breakpoints are at the heart of debugging. They help to stop and inspect the variables and other expressions. You can use the break command to add breakpoints in your code.

For example, if you want to add a breakpoint at line 5, run:

break ./main.go:5

Once your breakpoints are added, use the breakpoints command to view them. Running the command clearall will clear all breakpoints.

When you use the continue command, the debugger will run the code and stop at the next breakpoint you have set up. If there is no breakpoint, it will execute until the program terminates. For more details on the commands, check the Delve documentation.
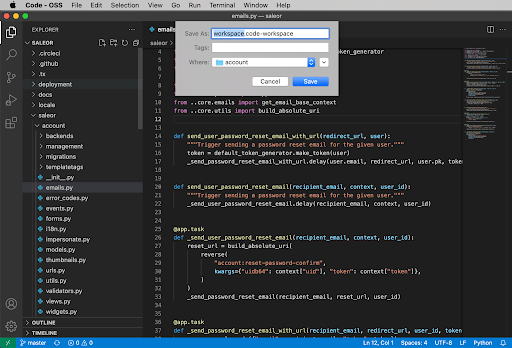
VS Code

Visual Studio Code is an integrated development environment (IDE). It is perceived to be the most popular IDE among developers, according to Stack Overflow 2021. It was initially built by Microsoft in 2015, which later on released it as an open-source project.

It allows you to build, edit, and debug programs. If you use VS Code to run your Go code and have the official Go extension installed on the editor, you can debug your code by pressing F5 or Run and Debug on your computer. For that, you’ll have to install Delve as a prerequisite.

To install Delve on VS Code, run the combination Ctrl+Shift+P or Cmd+Shift+P on Windows or Mac, choose Go: Install/Update tools, search “dlv,” and install it.

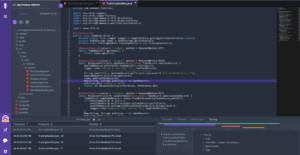
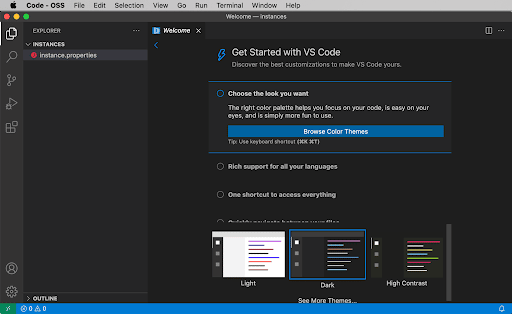
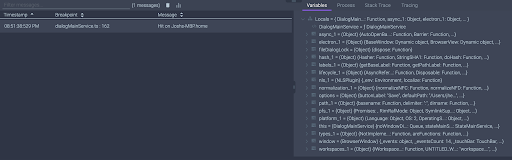
Running F5 or choosing Run and Debug can help you get started with debugging. Clicking on the area beside the line numbers will let you add breakpoints in your code.

Golang debugging in VS Code, courtesy of GitHub

Running this debugger the first time will ask you to install the dlv-dap, which you need to make the debugger work. The debugger will give you a graphical user interface to see what’s happening in your code. This approach is much better for beginners than handling the CLI.

Running the debugger will create a new file launch.json in your working directory inside a new folder called .vscode. You can configure the debugger here. By default, a <span style="font-weight: launch.json file looks like this:

{
// Use IntelliSense to learn about possible attributes.
// Hover to view descriptions of existing attributes.
// For more information, visit: https://go.microsoft.com/fwlink/?linkid=830387
    “version”: “0.2.0”,
    “configurations”: [
        {
            “name”: “Launch Package”,
            “type”: “go”,
            “request”: “launch”,
            “mode”: “auto”,
            “program”: “${fileDirname}”
        }
    ]
}

You can specify environment variables in this file using the "env": {"KEY": "xxxxxxx"} attribute. You can also specify the .env file location to look for when debugging, which can be defined with "envFile": "${workspaceFolder}/.env". The workspaceFolder is a variable that refers to the path of the open directory. You can check the list for all the reference variables.

Debugging with VS Code is discussed in detail in the documentation.

GoLand

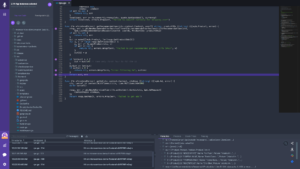
The JetBrains-powered GoLand is another powerful IDE used for Golang development. GoLand provides a GUI for debugging and works with Delve.

To start the debugger, you can either click on the green triangle and choose to debug, or right-click on the folder and select Debug. JetBrains offers more details about debugging with GoLand on its blog.

If you prefer a GUI to CLI, debugging with VS Code or GoLand is a great option. They offer the same functionality as Delve and a graphical interface.

goimports & gofmt

The goimports package in Go isn’t a debugger, but it can help you reduce bugs by removing mistakes from the codebase. goimports adds missing imports, sorts them, and groups them into native Go and third-party modules. Check the documentation for more details.

Similarly, the gofmt tool is used to check the code formatting, which is important because Go code is formatting sensitive. Here is an example of how to use gofmt:

package main
import (
    “fmt”
    “log”
)
func main() {
    var a int =             10
fmt.Println(“a =”, a)
log.Print(“logging the value of a. a =”, a)
}

Running the gofmt command switches to the below format:

package main
import (
    “fmt”
    “log”
)
func main() {
    var a int = 10
fmt.Println(“a =”, a)
log.Print(“logging the value of a. a =”, a) //implementing logging
}

In VS Code, the gofmt command runs every time you save your file.

These tools can help you avoid bugs by catching minor mistakes that you might miss.
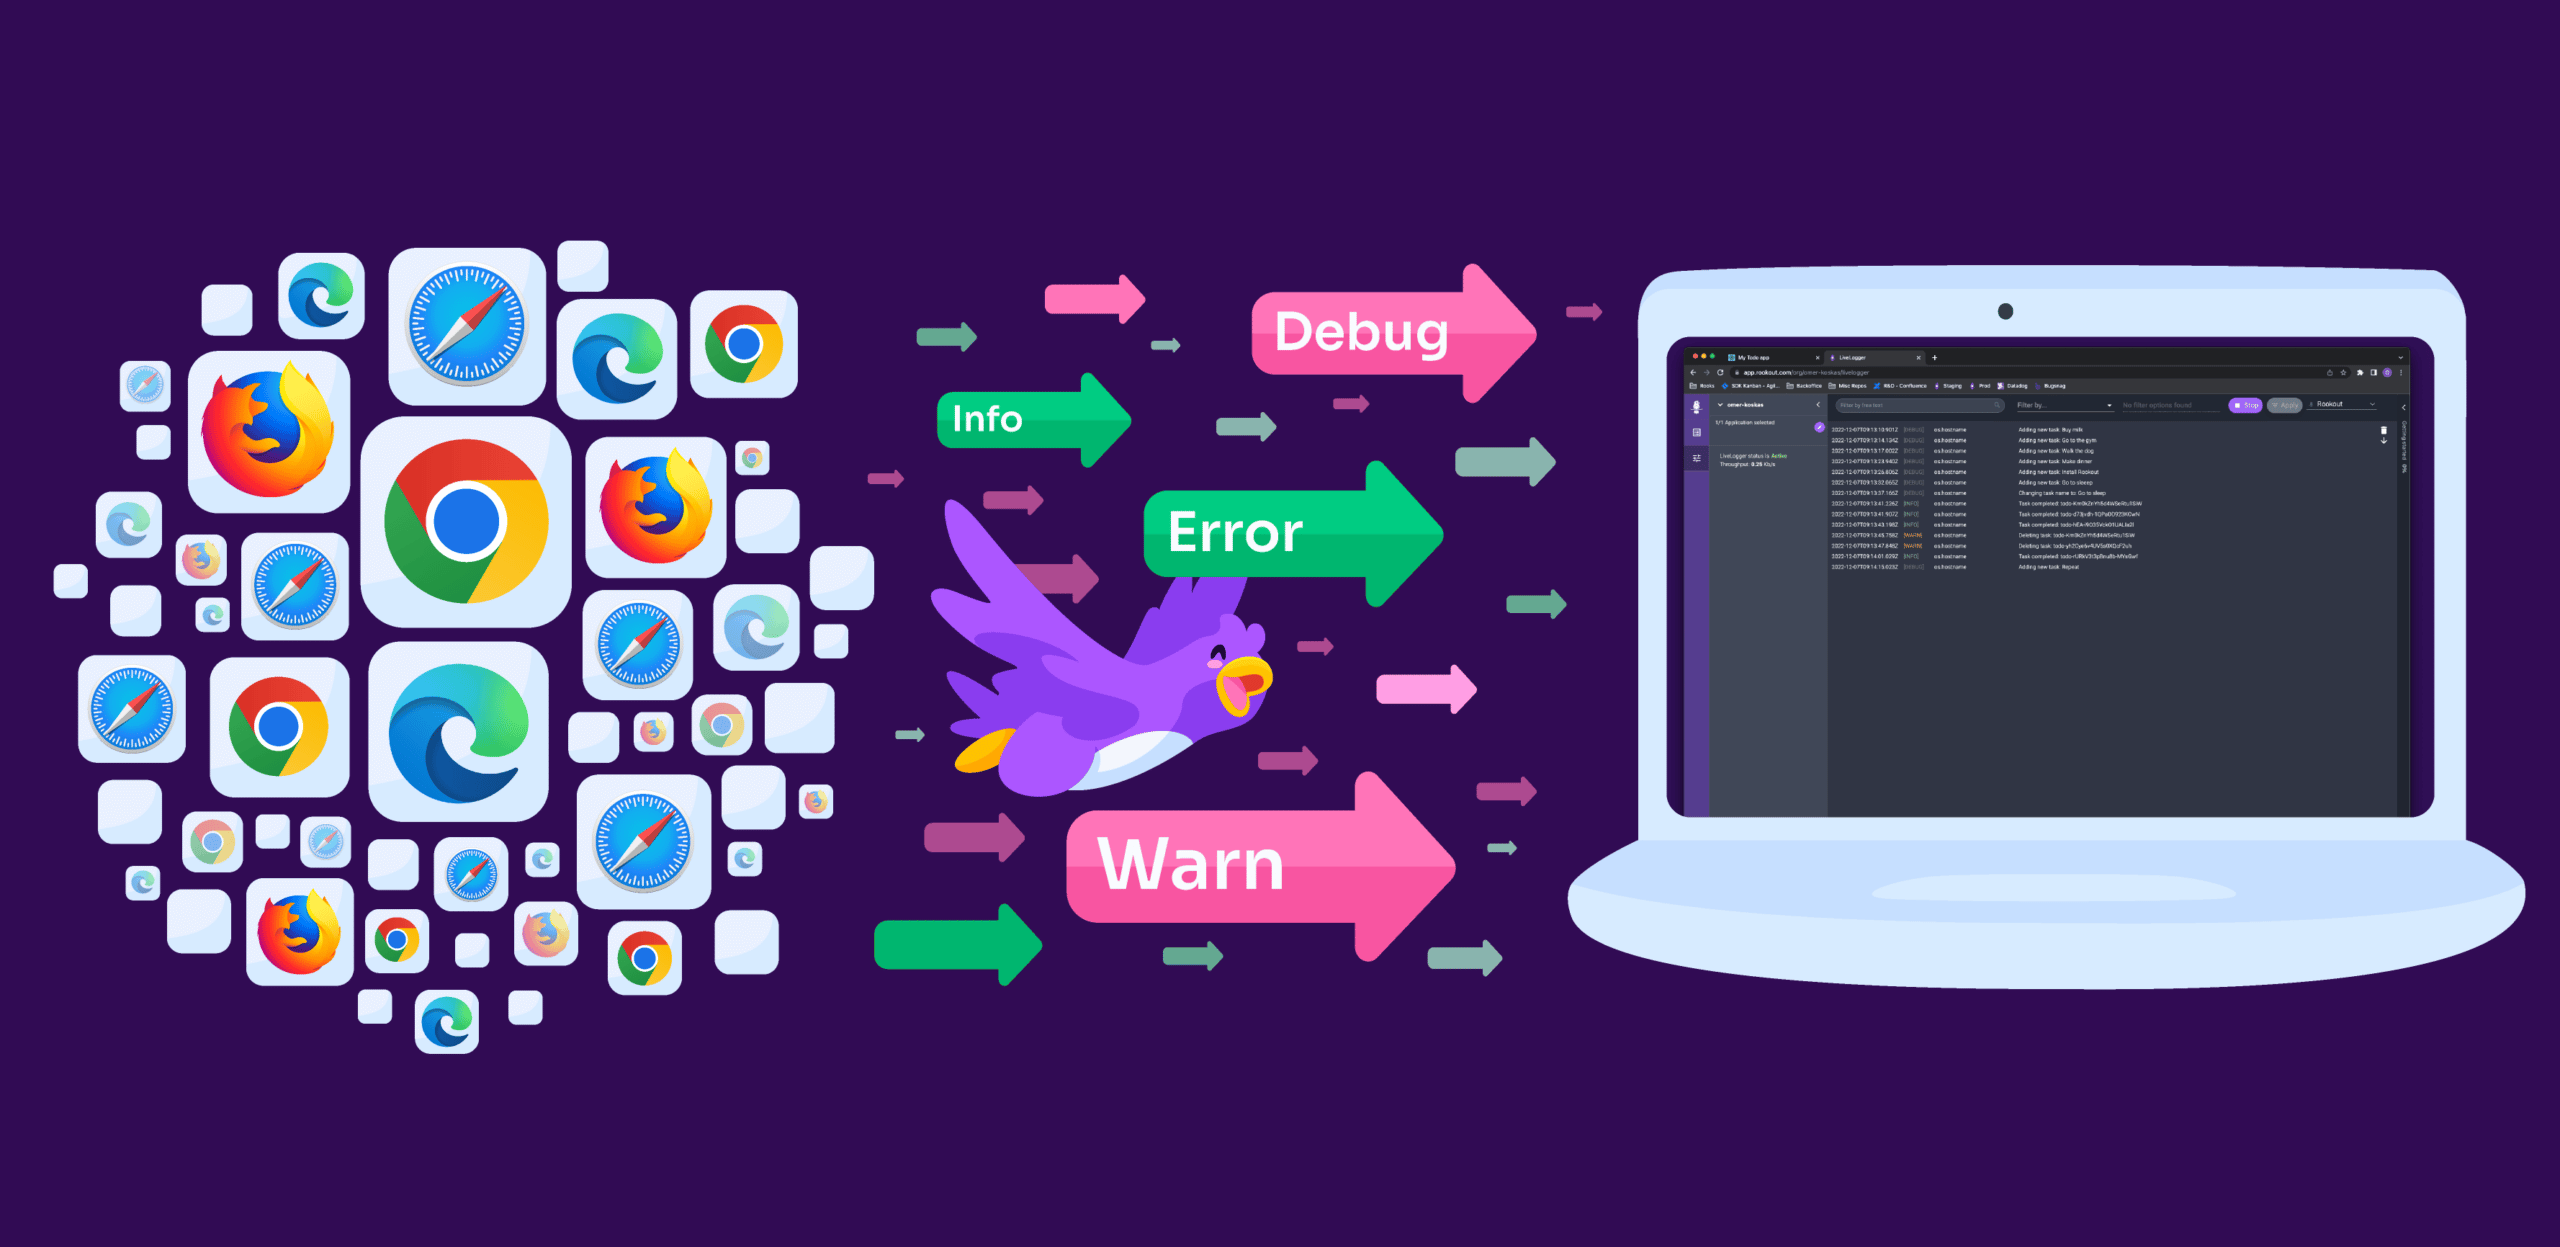
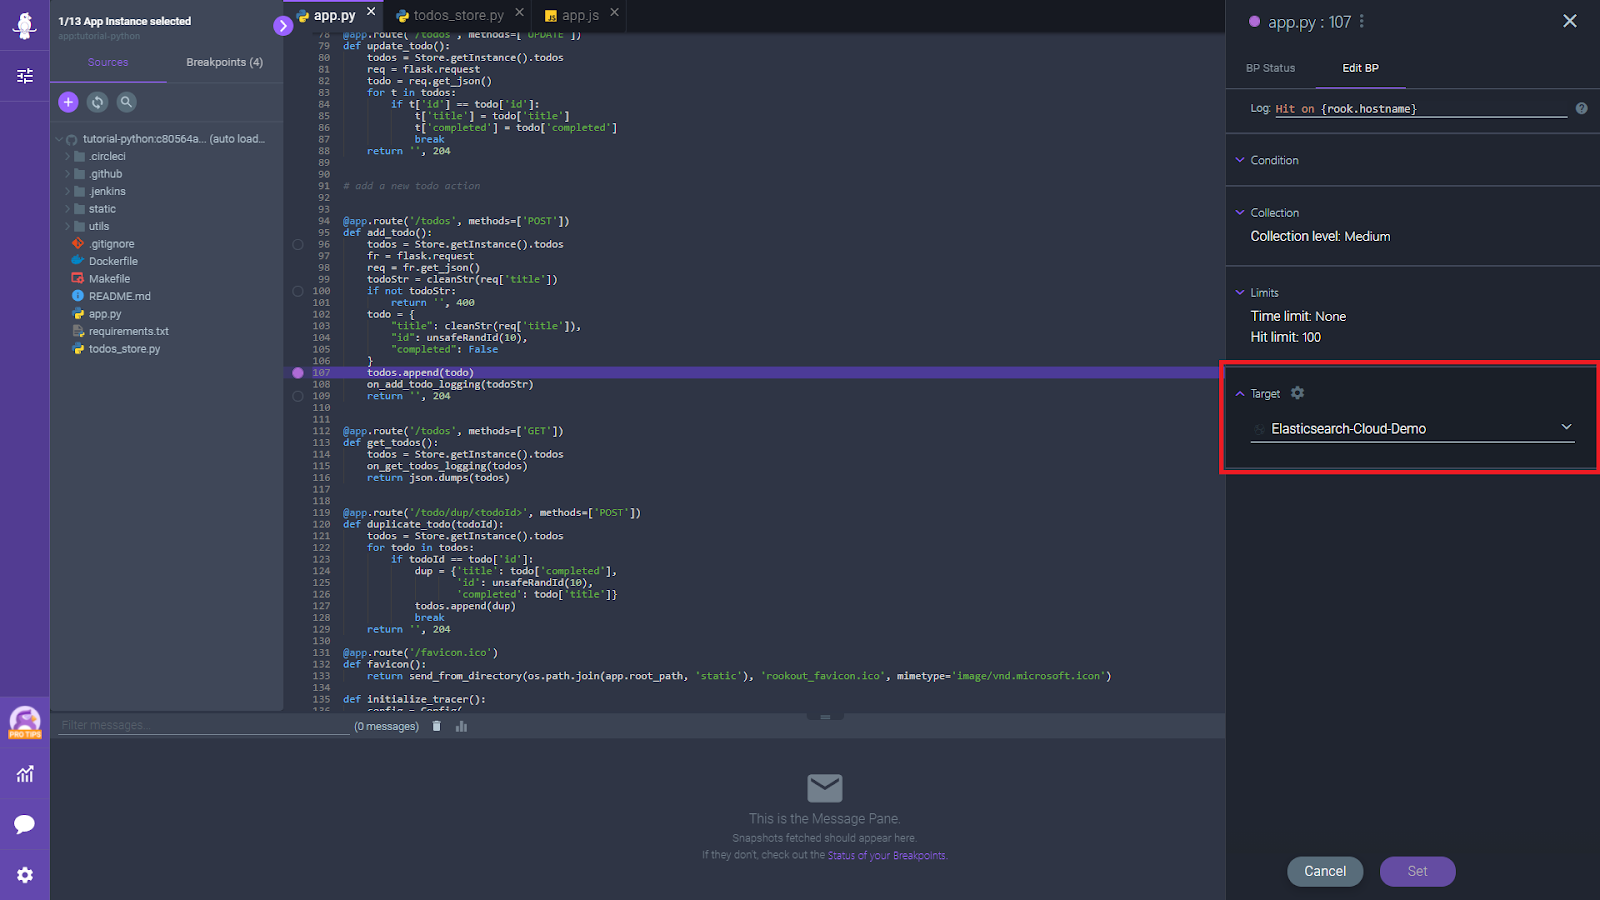
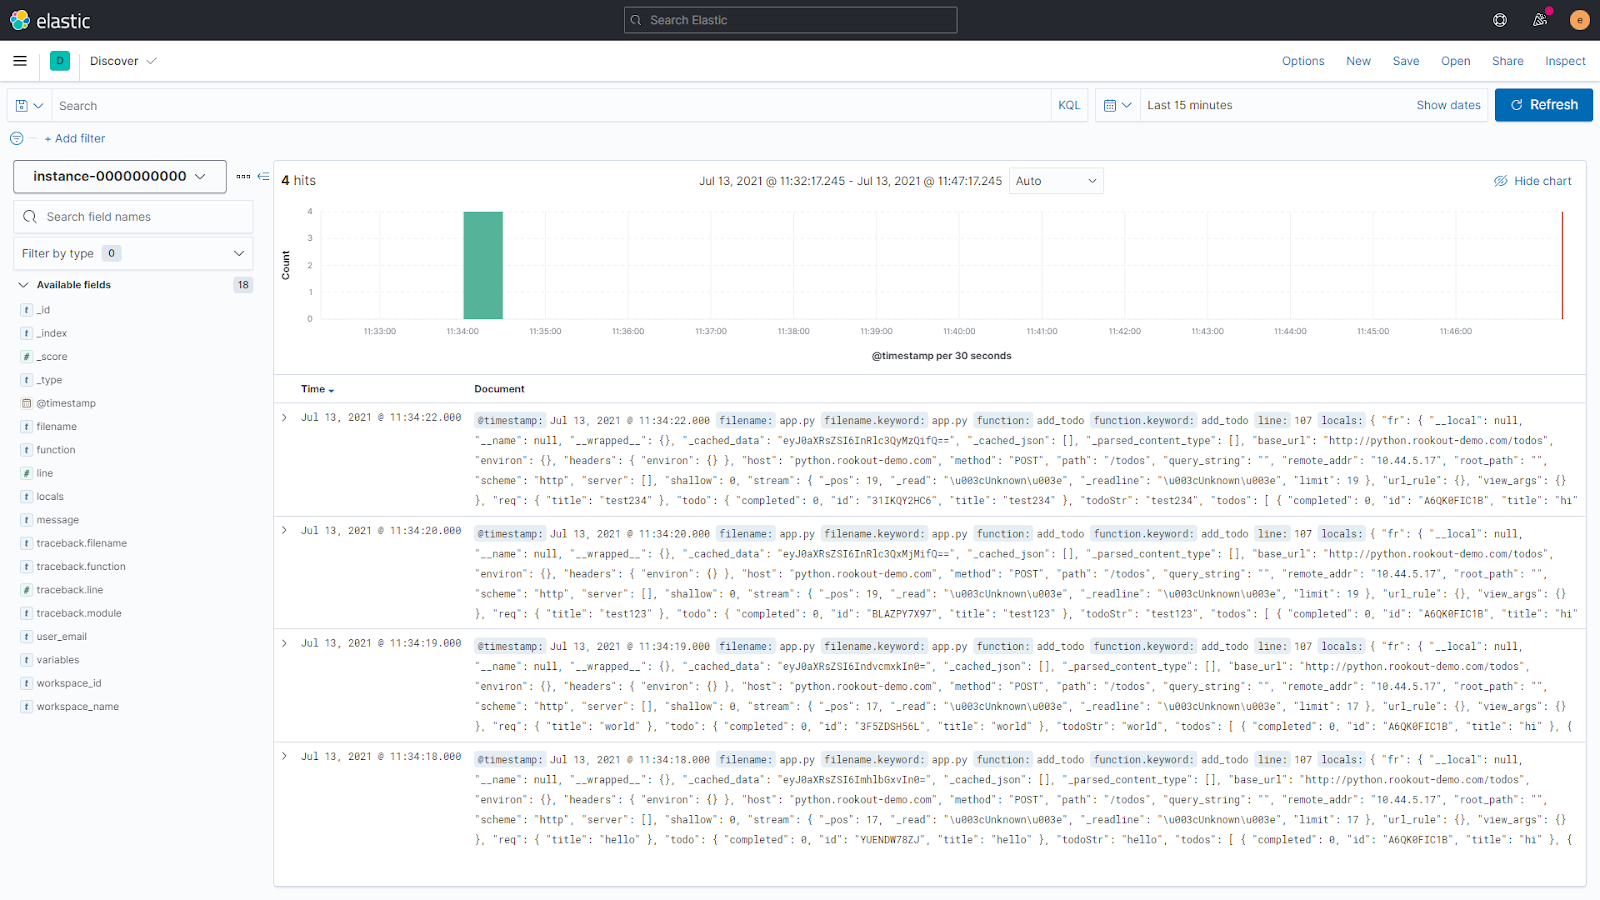
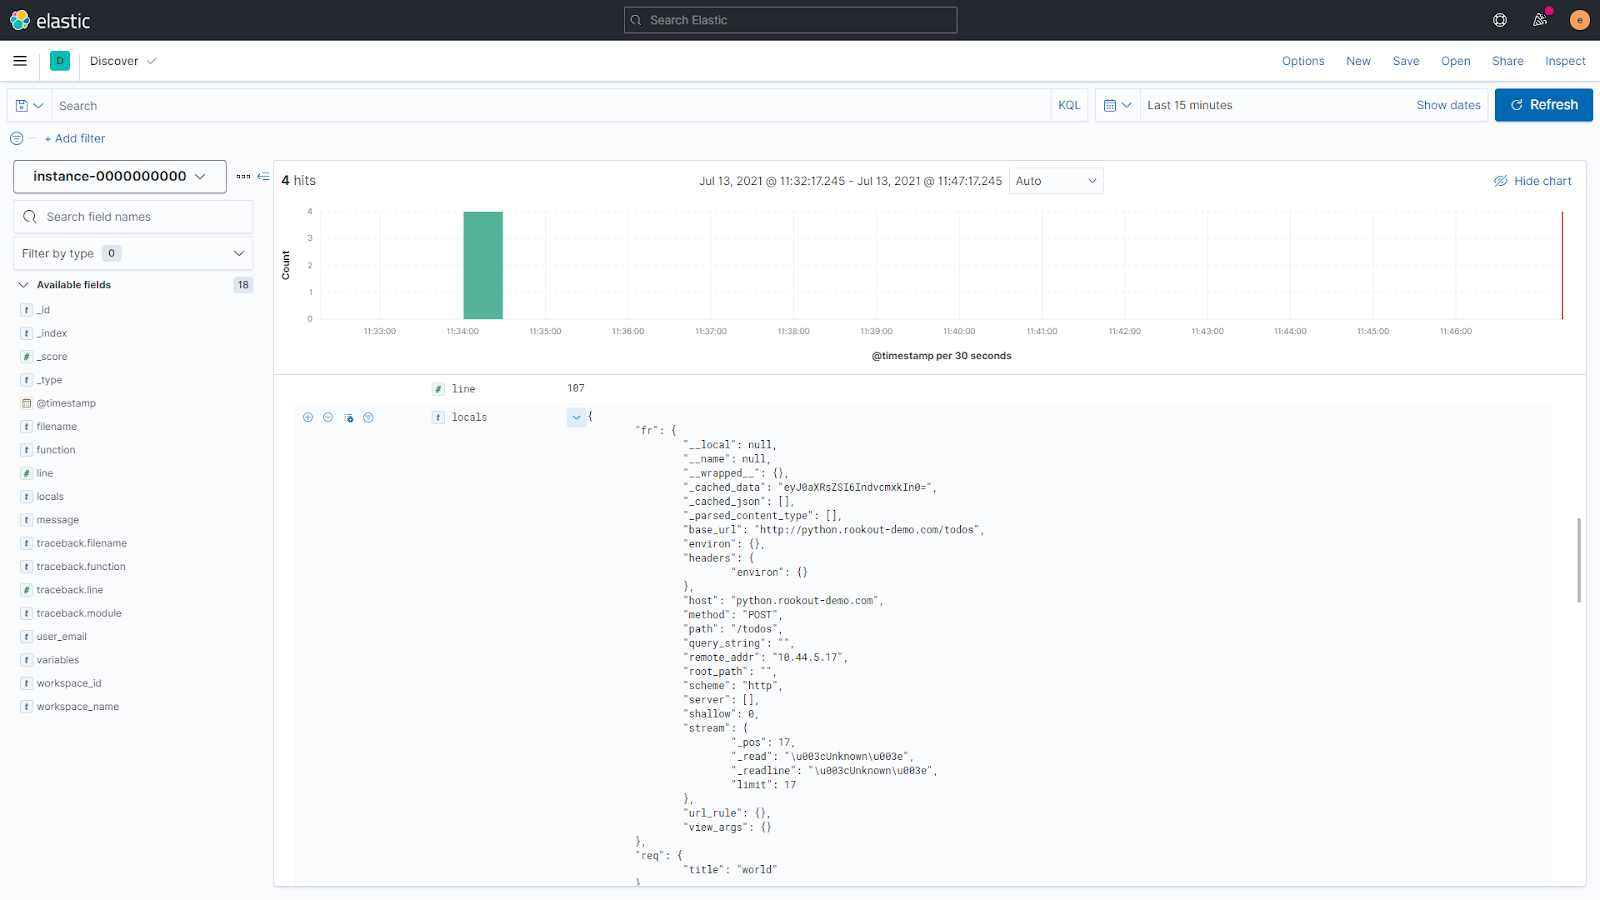
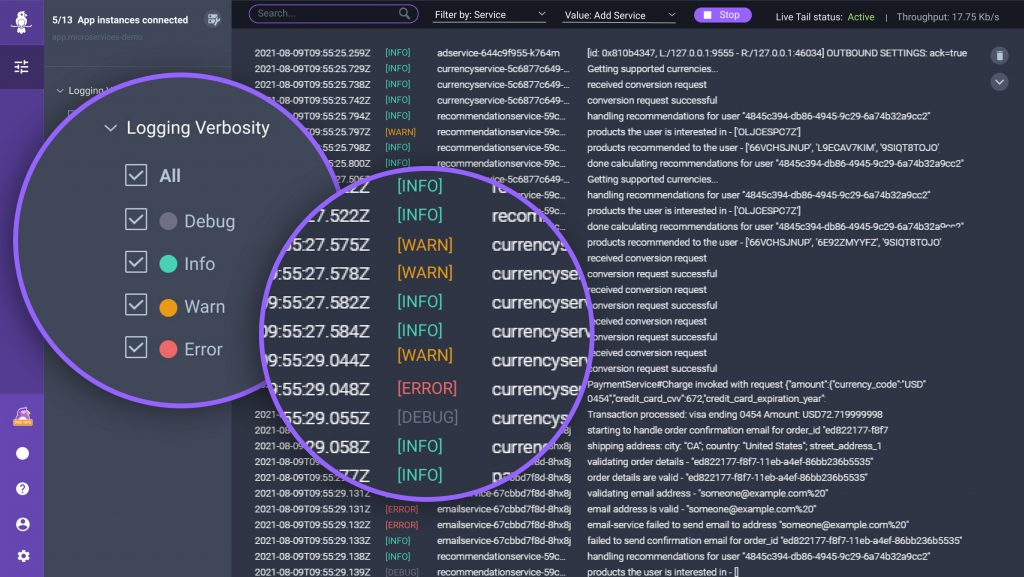
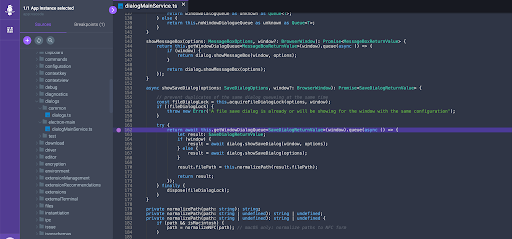
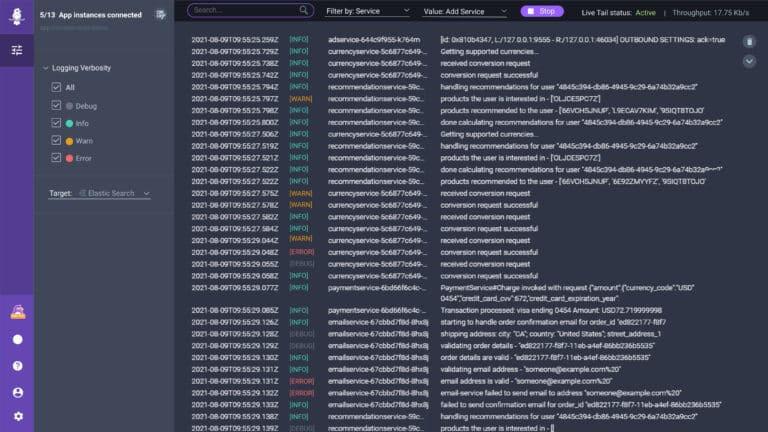
Live Go Debugging

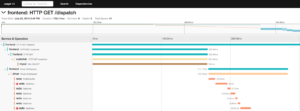
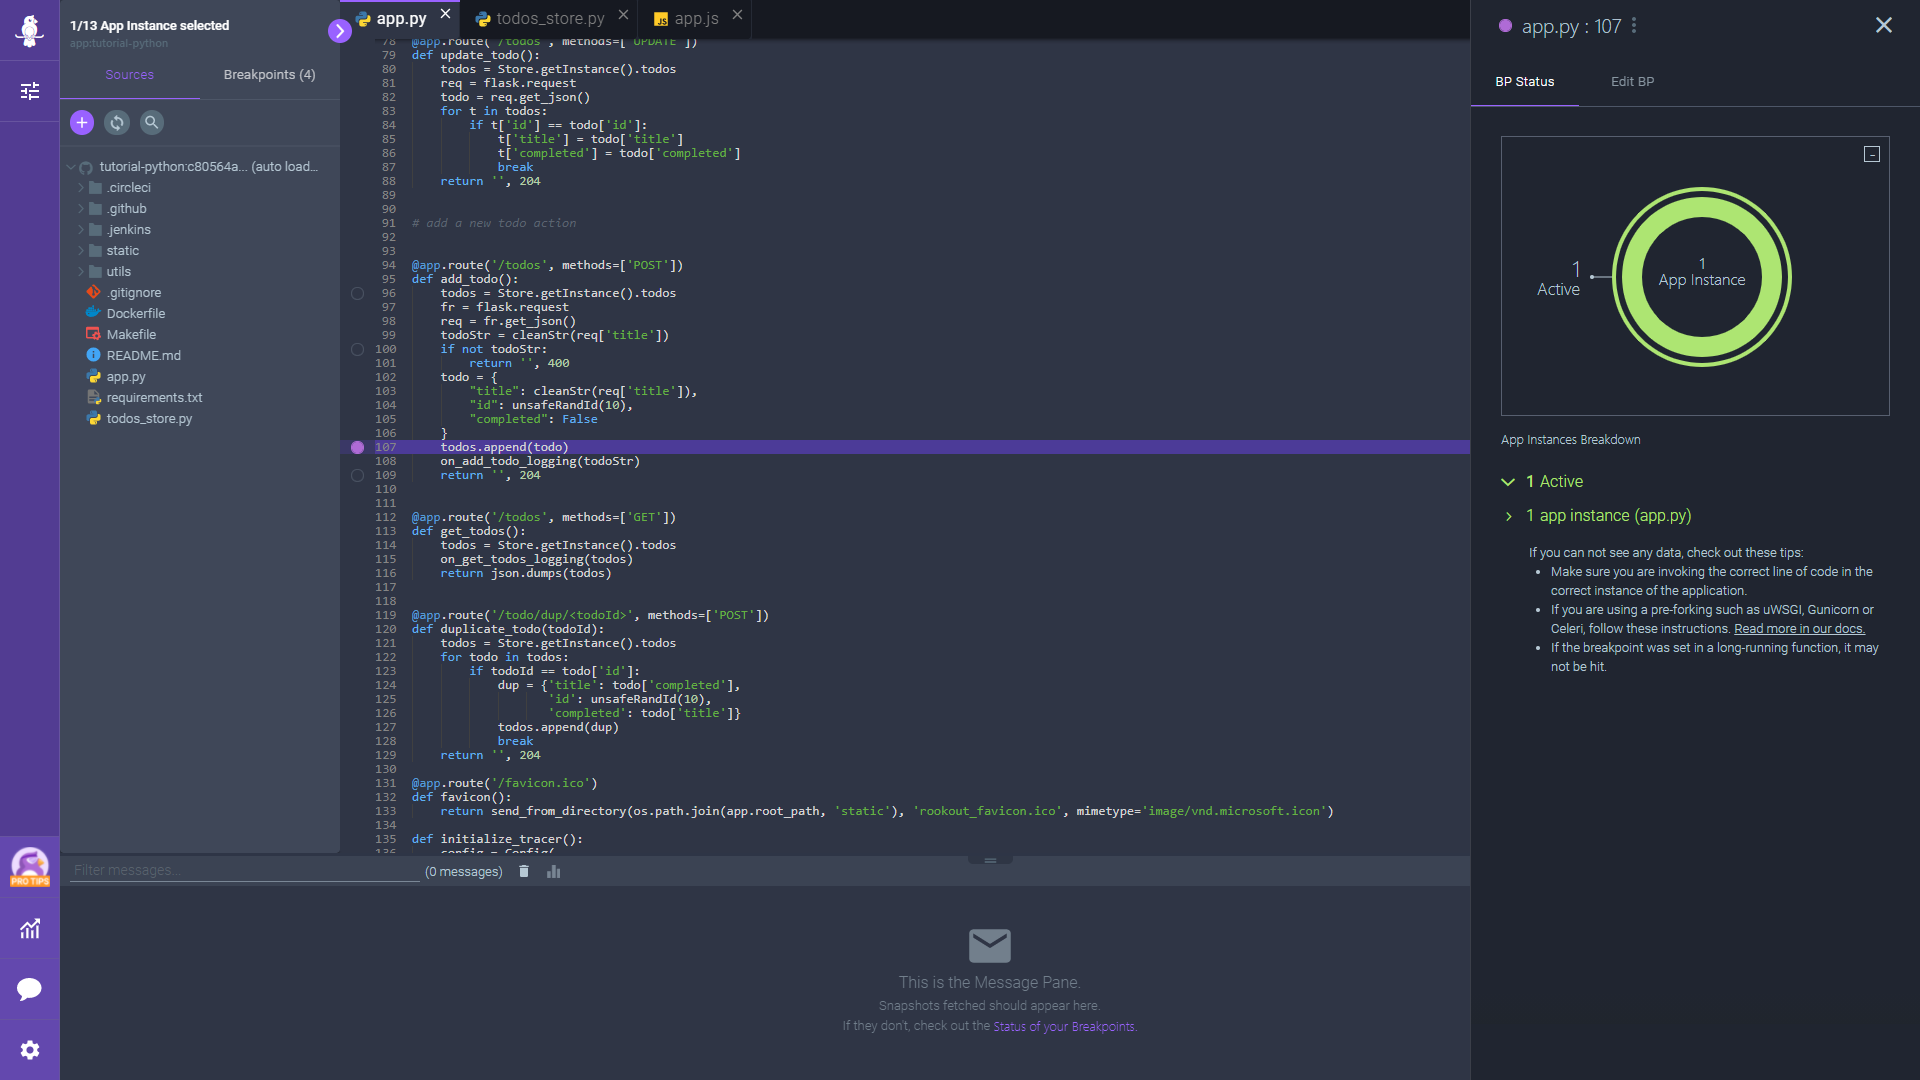
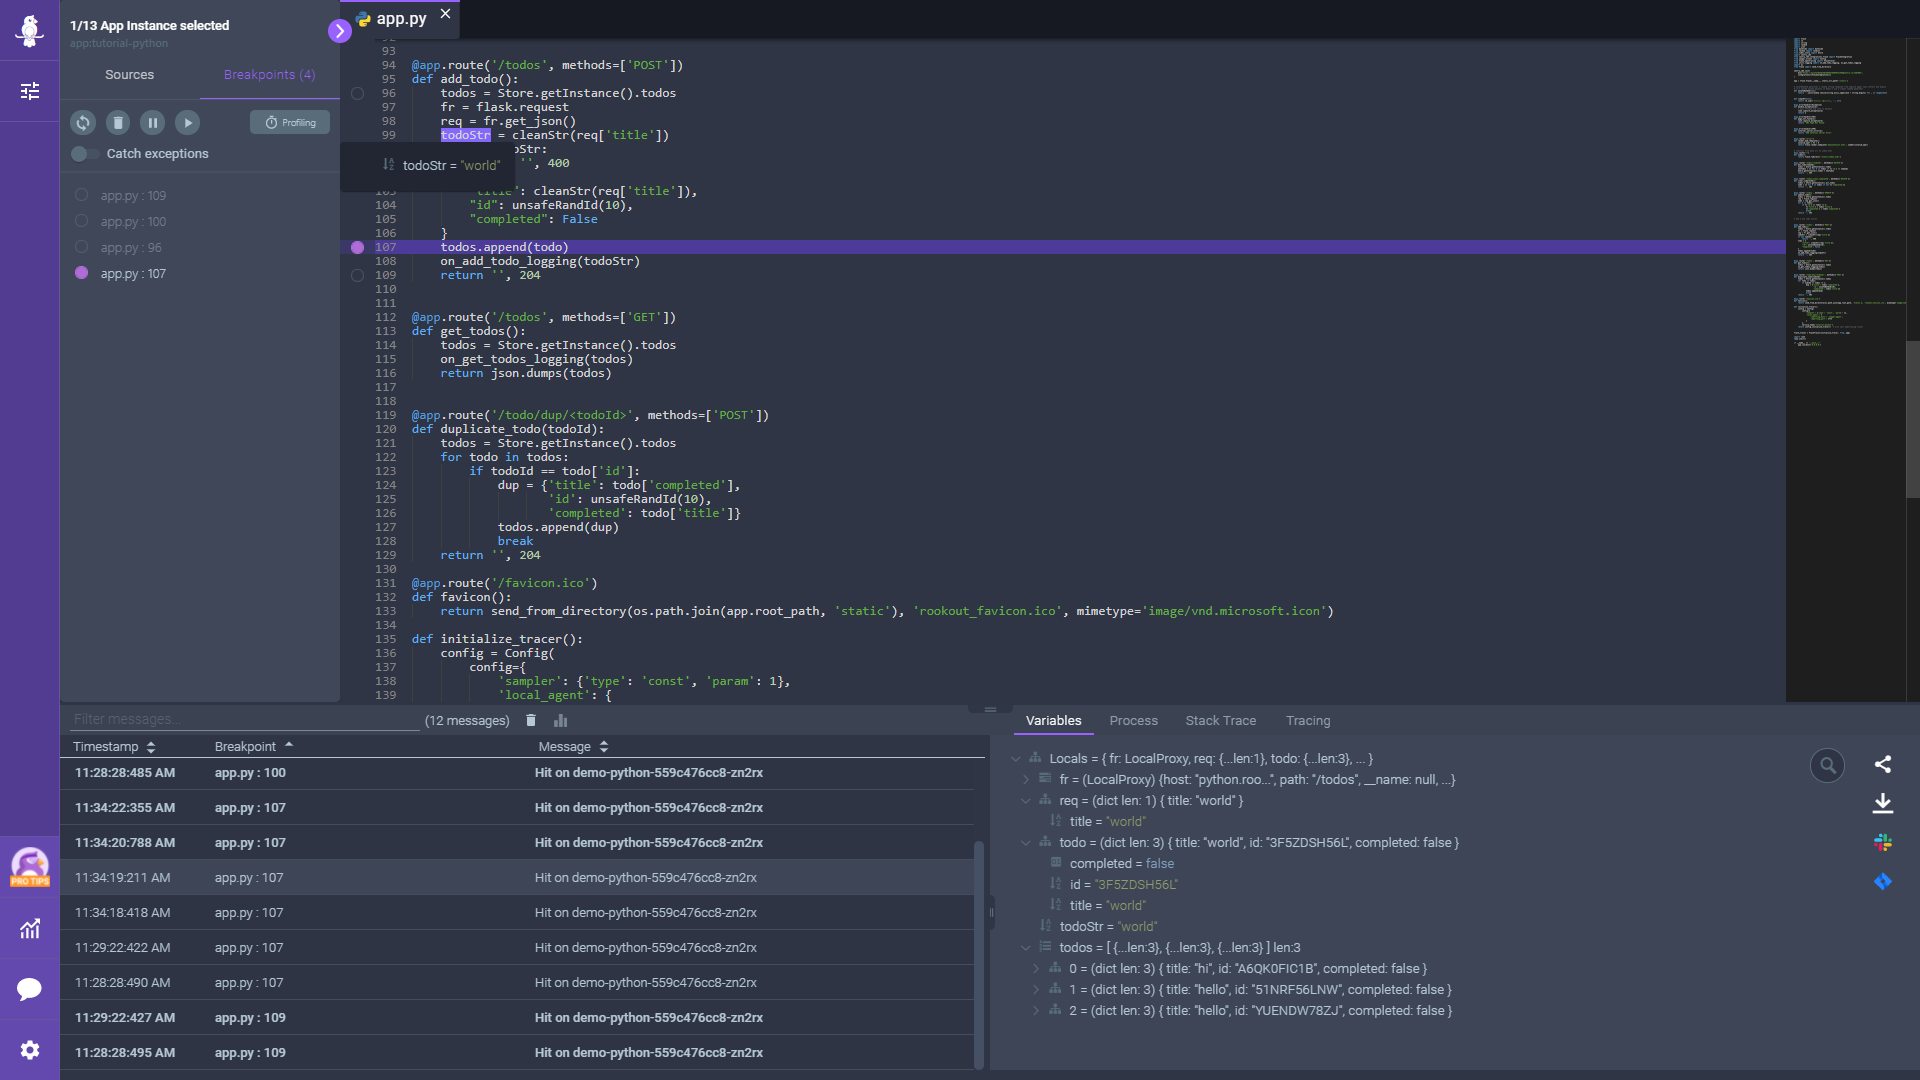
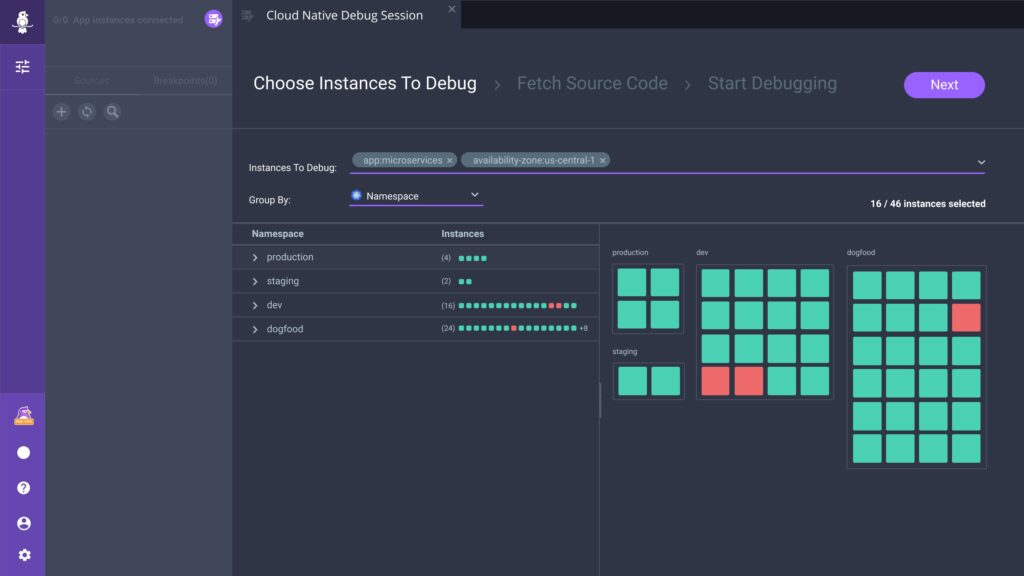
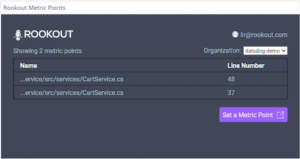
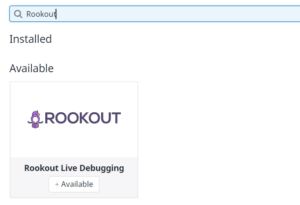
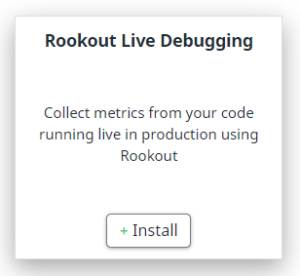
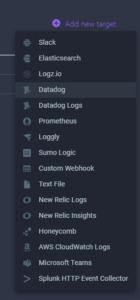
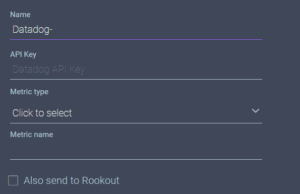
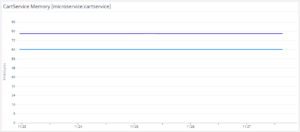
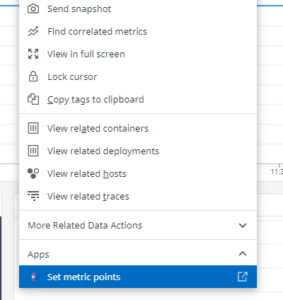
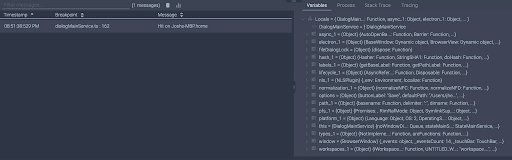
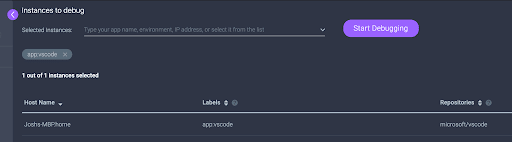
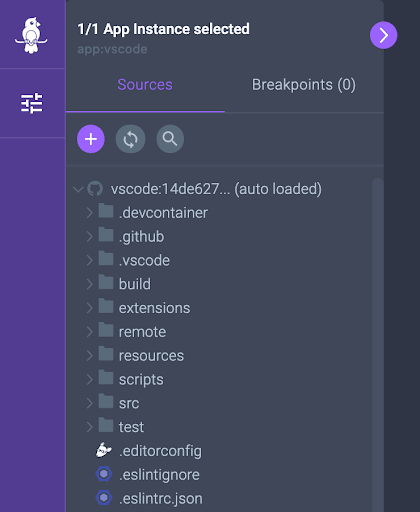
Another option for debugging is a live debugging tool. Such tools are dedicated services powered by dynamic instrumentation, such as Rookout. Rookout supports debugging Go applications, as well as other languages, and provides real-time access to your code across all environments. It also allows you to generate and check metrics like execution time.

When using Rookout, you don’t have to use an SSH key to get data from your dynamically deployed application. Its unique capability is the real-time access to your code-level data with no need to add code or wait for new deployment, which dramatically reduces the amount of time spent on modern app debugging.

Conclusion

Golang debugging is a must-have skill for developers. Using a debugging tool or an IDE with your Go programs is an easy way to ensure a healthy and functioning code. Making sure you use the quickest route to your root-cause will save countless hours and resources on fixing errors, so you can achieve a quicker workflow and a better-quality product. 

We have a fully compatible Go SDK for you to try out. To give Rookout a try, you can sign up for a free trial or check out its sandbox.

Rookout Sandbox

No registration needed

Play Now

Table of Contents
Get the latest news

Pinpoint Application Failures with Distributed Tracing

Josh Hendrick | Senior Solutions Engineer

6 minutes

Table of Contents

When building modern software architectures there can be many moving parts that while adding to the flexibility of software, can also make them more complex than ever before. With software now being built in smaller, more discrete components, issues can occur at many different layers across the stack, making them more difficult to track down. For this reason, it’s important to integrate modern observability practices into software development in order to get better insights into what’s happening behind the scenes while your software is running. Traditionally there have been three main pillars of observability which include logs, metrics, and traces. While all three of these areas add value to an observability stack, in this blog we’ll focus on distributed tracing and the value that it provides when tracking down the root cause of issues.

Distributed tracing allows teams to understand what happens to transactions as they pass through different components or tiers of your architecture. This can help to identify where failures occur and where potential performance issues might be occurring in your software. While tracing by itself can provide valuable insights, when combined with logs, metrics, and other event-based information, you’re able to understand a more complete picture of what happened as a transaction traveled throughout a software system.

How Distributed Tracing Has Evolved

Distributed tracing has come a long way over the years and has evolved into a key pillar of observability in a very short period of time. In 2012, Twitter open-sourced their internally built distributed tracing system Zipkin, which they initially built to help gather timing data for services involved in requests to the Twitter API. Zipkin included APIs to instrument your code for trace collection as well as a UI to visualize tracing data in an intuitive manner and was widely adopted by the community.

A few years later, Jaeger, another tracing platform for monitoring and troubleshooting microservices, was released by Uber and subsequently donated to the Cloud Native Computing Foundation. Jaeger was released with inspiration from Zipkin and another distributed tracing project from Google called Dapper. With three major players in the technology industry releasing open-source support for distributed tracing, it was off to fairly wide adoption very quickly. 

Introducing Standards

Anytime that new and widely adopted technology comes to market there are often many different or even competing implementations that can differ slightly making interoperability a challenge. Looking at teams that have adopted the microservices architectural approach, different services may be handled by different teams who can potentially be using different tooling. When adopting tracing technologies this potentially means that unless all teams are using the same tracing tools and observability approach, there may be challenges in tracking traces across all tiers of the architecture in a consistent way.

This led to an increasing need for standardization on tracing approaches. OpenTracing was the first major standard to try to consolidate guidelines for tracing implementations. OpenTracing focused specifically on tracing standards by providing a set of vendor-neutral APIs and was widely adopted. OpenCensus then came about as a standard introduced by Google and focused on standards for both tracing and metrics. Finally, around 2019, OpenTelemetry was introduced in attempt to combine both OpenTracing and OpenCensus into a single project focused on standards for telemetry data including logs, metrics, and traces. As of this blog, OpenTelemetry has launched version 1.0 of its specification.

Understanding a Trace

If you’re not familiar with tracing, some of the terminologies can be confusing at first. I’ll break down a few of the terms you’ll see mentioned in the context of tracing here.

Transaction or Request

This refers to a message or communication sent between services or components in your architecture that you may wish to track

Trace

A trace is a collection of performance data about a transaction as it flows through different components or tiers of your architecture. The goal of a trace is to collect performance information that can be used to pinpoint where failures or performance issues occur in your software.

Span

A span is a building block of a trace and represents a single segment of a transaction’s workflow through a service or component in your software.

Trace or Span Context

Information that is passed between segments of a trace in order to propagate details about the trace that are required to build a complete end-to-end trace. This includes things like trace ID, parent span ID, and potentially other information.

How Does Distributed Tracing Work

Now that we’ve reviewed some vocabulary in the prior section, let’s look at how distributed tracing works as a request passes through an application. Consider a microservices-based architecture where a request passes through one service and then on to many other services in the course of a typical interaction with the application. When that initial request enters the system that has been instrumented with tracing libraries, it’s assigned a trace ID which can be used to identify the trace and its associated spans. As that request moves along to additional microservices, additional spans (or child spans) are created and attached to the same trace ID. This makes it easy to see the flow of that request from service to service using the tracing tools web interface when doing later analysis.

Each tracing span can provide additional information which helps in the diagnosis of performance issues within the application. This includes things like the operation or service name, a start, and end timestamp, tags to annotate spans, logs and events which can capture logging or debug information from the application, and other metadata. Using the tracing provider’s front end, you can view all of this information in a simple tree-like structure in order to follow the flow of a transaction across different services in your application.

A sample trace may look something like the screenshot below. Looking at the details of the trace, notice the first transaction comes through the frontend service followed by a call to the ‘customer’ service and so on. As part of this trace, you not only see the sequence of events that occurred for this specific transaction, but we also see timing data associated with each service call. Clicking into any specific span within a trace may also give more detailed information as discussed above such as timestamps, tags, and even log data.

Conclusion

Modern software architectures are becoming increasingly complex and issues can often be difficult to track down. Having a complete observability stack incorporating logging tools, metrics, and traces can ease the burden on developers when tracking down those hard-to-find bugs. Over the past decade, tracing has become a staple in most well-rounded modern observability stacks. Standards are beginning to take shape and large enterprise organizations are starting to adopt them as they look to maintain their ability to stay vendor-neutral. 

At Rookout, we support distributed tracing by enhancing your debugging session with contextual tracing information. Viewing Rookout debug snapshots side by side with your application tracing information gives a more complete picture of what’s happening when you’re looking to troubleshoot complex issues. The tracing space has evolved and grown heavily in a short period of time, but will have many more new innovations coming in the future that can make your troubleshooting practices more effective and help you get to the bottom of issues faster!

Rookout Sandbox

No registration needed

Play Now

Table of Contents
Get the latest news

4 Ways to Get Your Code Back in Shape After Black Friday

Sharon Sharlin

4 minutes

Table of Contents

If you are reading this, you’ve probably been in a deep code freeze that started 2-3 months ahead of Black Friday. Code freezes are common across industries, not just to developers building e-commerce applications, but also across applications in the fintech, advertising, caching, and antifraud domains to name a few.

During code freezes, nothing new happens and everything is dedicated to testing and strengthening existing platforms, existing software versions, and existing workflows. This causes significant technical debt as features, improvements, and new code in various areas are delayed. So now that Black Friday is over — what will you do?

At Rookout, we like to think of Black Friday as the happy new year for our code! This is a great time to shake the dust out of your application, unfreeze those CI/CD pipelines, and get back to being productive.

Update Your Code

We all use an extensive amount of open source to accelerate time-to-market and reduce development costs, open source sometimes making up 80% of our modern applications! So while it’s a natural tendency to focus on the 20% of proprietary code, it’s just as important to make sure our open source libraries and frameworks are updated. According to Veracode’s June 2021 report, 80% percent of libraries used in software are never updated, even though 92% percent of open source library flaws can be fixed with a simple update.

Key reasons to update your code:

Out-of-date dependencies have a higher chance of breaking.
Updating open source helps avoid known vulnerabilities.
Updating your code means getting the latest capabilities out of your suppliers, projects, and services.

Unfreeze Your CI/CD Pipelines

For a substantial amount of time, there have been no automation processes pushing new versions of the application to deployment and testing. But that doesn’t mean no new code’s been written! Chances are you can expect a tidal wave of updates after the code freeze is over, and so prioritizing what needs to get done is critical.

Tips to Managing the Load after Unfreezing Your CI/CD Pipelines:

Craft a set of prioritization criteria! Hold meetings to determine which functions get first priority — usually the ones that are solving pressing business concerns.
Make sure the appropriate people have the capacity to deploy, test, and troubleshoot issues and outages, even in production.
Involve your DevOps team earlier. Clearing technical debt includes new functional features side by side with new non-functional features. When it comes to the latter, this is the time your DevSecOps people must be on their toes.
When non-functional Monitoring, Logging, Tracing (MLT) mechanisms and tools are injected and introduced — it is important to set reviews with the relevant infra and scrum teams to observe the new collected data and insights and verify those improvements are indeed addressing the needs.

Test Test Test

The modern, agile pace of work is quicker than ever before — but it also utilizes complex tech stacks that have the potential to create problems. Distributed and segmented teams, combined with agile methodologies, may create situations where no one is in charge of end-to-end testing.

Now is the time to make sure that you have a designated person or team that owns this process and takes advantage of the modern tooling available today for QA and test engineers, in order to ensure the delivery of higher quality code.

In addition, this testing team will probably want to embrace chaos engineering to make sure the application is resilient enough to cope with random events like losing a server or a few microservices.

Even after taking all the above precautions, not every unexpected outage can be avoided. These outages can be devastating to a business, whether transactions are lost or we simply fail to meet a pre-defined SLA. This is why it’s more important than ever to invest in Observability so we can better understand the health and state of our systems and applications.

Adopt a Dynamic Observability Tool

In a dynamic and complex cloud-native environment, the only way to maintain the velocity and quality of a cloud-native application is to be able to collect metrics, logs, and traces on-demand and then visualize them in a way that enables instant understandability. Unfortunately, traditional observability tools require developers to write more code and redeploy the application each time new data needs to be extracted.

That’s why we are seeing the rise of dynamic observability tools that can deliver real-time answers to real-time questions. These tools leverage tracepoints, aka “non-breaking breakpoints,” to debug production issues on the fly — an emerging technology that disrupts the way we collect data today.

Such tools allow engineers to dynamically instrument a line of code, to switch on a logline, or to collect a debug snapshot of local variables and stack traces. This dynamic instrumentation is made possible by using bytecode manipulation, which means that data can be extracted without having to stop or redeploy the application.

If you follow these tips, you’ll be ready to draft your “After black Friday” to-do plan! You’ll have your hands full with software updates, CI/CD clean up, proactive testing, and of course modern observability — but what you’ll get in exchange is happy customers leading into the holiday season 🙂


This article was originally published on TheNewStack

Rookout Sandbox

No registration needed

Play Now

Table of Contents
Get the latest news

Five Major Software Development Challenges In Martech

Shahar Fogel | CEO

3 minutes

Table of Contents

In order to optimize results, marketing professionals inside high-performing organizations are embracing new technology, tools and data more than ever before. The technological innovations in the martech domain are booming globally and helping digital marketers achieve their digital campaign and lead-generation goals.

While not often thought of as “deep tech,” marketing cloud solutions in major enterprises like Adobe and Oracle, as well as new innovative companies like Marketo and HubSpot, are dealing with an immense amount of data, infrastructure and privacy complexities. This is leading to some unique challenges when it comes to building and maintaining martech software.

1. Dealing With High Volumes Of Data

Marketing professionals are gathering user data constantly from many different sources and platforms. The amount of time and effort it takes to properly source, categorize and prioritize the ocean of data is unfathomable. On top of that, when there is an issue that needs to be debugged, the massive amount of data makes it extremely difficult for engineers to get to the bottom of data irregularities and anomalies.

These companies need to adopt dynamic observability solutions that are built for cloud-scale applications. If you’re not ready to adopt a SaaS platform, you can start by using the open source project OpenTelemetry to start standardizing your data across metrics, logs and traces.

2. Privacy Concerns

Martech companies are dealing with an unusually large amount of highly sensitive, personally identifiable information (PII) that needs to be protected. Dealing with compliance and regulations while trying to move fast is a top frustration for software developers in the industry.

To address this, martech companies need to adopt tooling that allows them to quickly access and pipeline data securely, whenever they need it. They also should consider shifting security left and embracing DevSecOps best practices. There are even great open source tools out there like Checkov that will automatically scan for cloud misconfigurations.


3. Remote Debugging

In terms of application debugging, I previously noted that a software bug can immediately translate into a loss of money in the martech industry. When developers debug critical applications with complex architectures, nearly $300 billion per year is wasted in engineering time and customers’ opportunity costs. Long gone should be the days where debugging code and deploying a fix takes hours or even days. Long gone should also be the days where developers write endless log lines that create a ton of noise, cost and performance overhead.

Instead, developers should be equipped with modern, SaaS-based debugging tooling that enables developers to quickly access the data they need to troubleshoot and solve the customer’s pain. Of course, developers are used to debugging in their IDE every day, but consider solutions that get real-time data from production systems.

4. Modern Infrastructure

Today’s martech companies are built on top of modern and distributed infrastructure like cloud, containers, microservices and Kubernetes. While this makes martech solutions highly scalable, it adds a ton of complexity. Software developers should consider embracing site reliability engineering (SRE), observability and chaos engineering to proactively improve reliability while dealing with highly dynamic cloud infrastructure.

5. The Rising Costs Of Logging

Developers have been using logs to troubleshoot issues for decades. At scale, these logs become extremely noisy and expensive to store — especially in the martech industry, where there are a lot of quick transactions. Finding the right log can be like finding a needle in the haystack. New companies — such as my organization with its recent solution to dynamically turn logs on and off, as well as solutions from Logz.io and LogDNA — are coming into the space to attempt to address this problem.

At the end of the day, many of the challenges faced in the martech industry are similar across other modern industries dealing with cloud-scale applications. Many engineering organizations are balancing the desire to move fast while simultaneously making good decisions and protecting sensitive customer information. As I discussed, developers in the martech industry are adopting dynamic observability, chaos engineering and other modern practices that address modern problems, as well as adopting open source — such as Delve, OpenTelemetry and Chaos Toolkit — and SaaS solutions to transform their organization.


This article was originally published on Forbes.

Rookout Sandbox

No registration needed

Play Now

Table of Contents
Get the latest news

Introducing Dynamic Observability: A no-code integration between Elastic and Rookout

Oded Keret | VP of Product

6 minutes

Table of Contents

In recent years, Observability has become a de-facto standard when discussing development and maintenance of cloud-native applications. The need to develop an observable system and ensure that as it runs in production, engineers will be able to detect performance issues, downtimes, and service disruptions, has evolved into a rich ecosystem of tools and practices. It also demands the elevation of the field to a new form of a more dynamic kind of observability.

The Elastic Observability platform has been a trailblazer in this ecosystem, providing a one-stop-shop for collecting logs, trace information, and metrics from a seemingly infinite number of agents, agentless collection methods, and cloud provider integrations. Adding visualization, automated root cause analysis, and alerting capabilities on top of the collected data provides engineers with a single pane of glass, providing a rich APM experience presented in a unified and intuitive user experience.

The latest integration between Elastic and Rookout aims to further enrich this experience by introducing Dynamic Observability namely, the ability to collect additional logs, trace information and metrics 1) without adding code nor waiting for a deployment, and 2) with minimal impact on performance and logging costs. This development has pushed observability one step further towards a real-time capability, allowing it to address the rising challenges of managing and deploying distributed and dynamic microservices-based deployments.

In this blog post, we will dive into the new partnership, providing a hands-on guide to exposing the power of Dynamic Observability.

Introducing the Rookout Live Platform

As the name suggests, the combination of debugging with logging and metrics creates a more dynamic observability environment that operates with no interruption to production and can be activated quickly. The Rookout Live Platform integrates with the Elastic Observability, offering two game-changing capabilities to Elastic users:

  1. Non-Breaking Breakpoints” that let you fetch local variables, logs, and metrics from any line of code within the app. This is without stopping the app, without adding code, and without restarting.
  2. Live Logging lets you change logging verbosity level dynamically and contextually. Drill down to the specific instances, components, accounts, or even individual users to get detailed Debug and Trace logs with no pre-filtering.

To enjoy these capabilities and enhance your Elastic Observability experience, we will first set up your Rookout environment.

Setting Up

Setting up Rookout is a matter of minutes. Sign up for the Rookout service online and add the instrumentation agent to your application. if you happen to be using Java, it’s going to look something like the following. For other programming languages and the on-boarding wizard check the online docs should.

curl -L "https://repository.sonatype.org/service/local/artifact/maven/redirect?r=central-proxy&g=com.rookout&a=rook&v=LATEST" -o rook.jar

export JAVA_TOOL_OPTIONS="-javaagent:$(pwd)/rook.jar -DROOKOUT_TOKEN=[Your Rookout Token]"

Besides the instrumentation agent, Rookout also offers a web debugger. Once your application is up and running, you’ll be able to set Non-Breaking Breakpoints in a dev-friendly user interface, and instrument your code dynamically.

To make sure everything is set up correctly, and see the magic of Rookout, select the appropriate file and add a non-breaking breakpoint to the relevant line of code. Once you invoke it, you will instantly get a full snapshot of your application, showing the values of the variables, stack trace, and much more!

Detailed debug information is visible, but your app did not stop

One more ability provided by Rookout is a dynamic view of your cloud-native deployment. In the Debug Session Configuration page, you will be able to get a view of your environment, and group the instances in which Rookout is deployed. By grouping and filtering your environment by Namespace, Deployment or any other cloud-native parameter, you will be able to slice and dice and dynamically fetch data from any or all of the pods, containers, functions or servers running in your application.

Connecting with Elastic Observability

Next, you’ll want to hook Rookout up with your Elastic Observability, so that you can benefit from dynamically collected data in Kibana. Start by clicking Settings (the cogwheel at the bottom left) and select the Targets option. Go ahead and add Elasticsearch as a new target:

Set targets with our dynamic observability integration combining Rookout debugging with the Elastic Stack

Name your new target, configure that cluster’s hostnames, the index name, authentication credentials and more:

Set targets with our dynamic observability integration combining Rookout debugging with the Elastic Stack

Now that you are connected, the Rookout instrumentation agents will listen quietly for instructions. When a Rookout Non-Breaking Breakpoint is set and hit, they will dynamically start streaming live data to your Elastic Observability instance.

Seeing it in Action!

Once you have got everything set up, getting new data into your Elastic is a breeze. Start out by selecting the instances you want to collect data from. You can collect data from as many (or as few!) instances as you need. Whether you want to collect data from entire deployments, or a single instance, that’s entirely up to you.

Based on the instances you have selected, the source code will be automatically loaded into your browser, and all you have to do is click on the relevant line. Once that line of code is executed, you will see a snapshot at the bottom of the screen – make sure this is the information you are looking for.

Dynamic observability means minimal to no interruption of a running app or to full-fledged production.

Finally, edit the breakpoint and configure it to send data to Elasticsearch, and you are done!

The same detailed debug information is visible in Kibana. No code change or restart required

A closer look into local variables collected when the breakpoint was hit

Oh, and one more thing

We have seen how Rookout can be used to instantly switch on a newly created log line, without adding code and without stopping or restarting the app. This is very useful in cases where the data you are missing is just not printed to log. That is – if the log line is just not

there. In some cases, you do have a log line that would have printed the missing data – for example, a log line in DEBUG or INFO level, that will not be printed when the application is running in WARNING or ERROR logging verbosity.

For those cases, Rookout has recently released Rookout Live Logger. This tool that lets engineers change log verbosity and apply dynamic, context-based filtering to existing logs. These logs can also be dynamically pipelined to Elasticsearch, adding yet another level of control over logs, metrics and traces that make up the Elastic Observability experience.

Wrapping things up

As we have shown, Rookout lets you dynamically troubleshoot and add logs in remote, live environments. The fact that you can gain extra visibility into your detailed running code without changing it and without restarting is what sets Rookout apart from traditional instrumentation methods. And by pipelining extra data dynamically into your Elastic ELK stack, we aim to provide a production-first debugging approach throughout your application development lifecycle.

Want to try this for yourself? Signup for free 14 days trials of Rookout and Elastic Cloud.

Originally published on elastic.co

Rookout Sandbox

No registration needed

Play Now

Table of Contents
Get the latest news

Adding a Real-Time Layer to Datadog Observability

Lir Locker | Product Manager

3 minutes

Table of Contents

We all know Datadog. It’s a powerful and established tool that developers, DevOps, and SREs use for anything ranging from monitoring their application’s performance and searching their logs to having an end-to-end understanding of the environment. The nature of cloud-native applications makes the three pillars of observability – (Metrics, Logs, Traces) – needed more than ever to get visibility into your application. 

Datadog enhances that by enabling developers to visualize everything in a user-friendly manner that helps them to immediately understand the situation they are in. Unfortunately, developers find themselves in a frustrating position when they don’t have a specific variable, logline, or metric needed to investigate an issue. This is the time when real-time capabilities are needed – and this is where our datadog integration story begins.

Rookout’s newly introduced integration with Datadog adds a layer of dynamic observability to a developer’s day-to-day Datadog usage, thus greatly extending their debugging capabilities. Having the ability to debug applications on the fly, on top of the existing visibility, Datadog provides, increases productivity and adds valuable insights for developers and DevOps teams.

The new Rookout integration for Datadog uses the newly announced Datadog UI Extensions, enriching the user experience with additional features provided on the Datadog’s user interface.

The integration lets you easily collect custom metrics from your code (leveraging Rookout’s Non-Breaking Breakpoints), and send them directly to Datadog. It does so using two components: 

  1. A context menu item for your dashboard widgets that lets you start a debugging session in Rookout, while keeping the context of your Datadog dashboard.
  2. A custom Datadog dashboard widget for showing all the Non-Breaking Breakpoints that have been set in Rookout and send metrics to Datadog.

The new custom dashboard widget by Rookout

The new custom dashboard widget by Rookout

Adding the integration to your Datadog environment is quite easy.
First, make sure you are already using Rookout and have deployed it to one of your applications. If you haven’t, see our docs or contact us to get it up and running.

Once you have Rookout deployed, go to your Datadog integrations page and search for ‘Rookout’, then click ‘Install’.

Installing the integration

Installing the integration

In order to configure Rookout to send metrics to Datadog, go to your Rookout ‘Targets’ settings page under the Settings menu (cog icon). Then, click ‘Add new target’, choose Datadog, and fill in the required fields.

Adding the Datadog target

Adding the Datadog target

Now that Rookout is ready to send data over to Datadog, let’s choose a Datadog dashboard in which the new data will be shown. In Datadog, choose any time-series graph you would like to show new data in, and add a corresponding label to its title. For example  [env:production]. This label will tell Rookout which services to automatically choose for you once you start debugging from this graph. For more information about Rookout’s labels and filters, see this docs page.

Adding the Rookout label to the title

Adding the Rookout label to the title

You should be all set by now. From now on, every time you need to troubleshoot something using Datadog, all you have to do is click the graph, click ‘Set Metric Points’ and place some Non-Breaking Breakpoints with “Datadog” as their target and you’ll find the source of your issue in no time.

Rookout’s context menu item

Rookout’s context menu item

In Rookout we believe that every engineer should be able to gather any data point from their application in real-time and be able to provide real-time answers about any issue in their production, dev, or staging environments. The newly introduced integration caters this capability to Datadog users and takes their Observability capabilities one step higher by adding dynamic layers to it. 

For more information about the integration and debugging process, watch this video. And you have any further questions, don’t hesitate to contact us.

Happy Debugging!

Lir Locker

Product Manager 

Rookout

Rookout Sandbox

No registration needed

Play Now

Table of Contents
Get the latest news

Rookout Named A Gartner Cool Vendor in Monitoring and Observability

Shahar Fogel | CEO

4 minutes

Table of Contents

We are honored to announce that Rookout, the world’s leading dynamic observability and debugging platform, has been recognized by Gartner as a Cool Vendor, based on the October 11 2021 report titled “Cool Vendors in Monitoring and Observability – Modernize Legacy, Prepare for Tomorrowby Padraig Byrne.

Besides being recognized as a significant (and cool!) vendor in the observability space, we believe that our inclusion in this Cool Vendor report by Gartner confirms the significance of our mission to empower engineering teams to achieve a shift-left strategy, cut MTTR by 80%, and turbocharge their productivity and velocity.

This recognition is also a great testament to the amazing capabilities of our entire team of superstars who are constantly innovating and driving the best product out there, as well as our amazing clients who are adopting the new standard for debugging and understanding their Cloud-Native applications on the fly.

So why is Rookout so cool?

To be considered a “Cool Vendor”, a company must be considered innovative or transformative for products, services, or initiatives.  The criteria by which a vendor is defined as “cool” is whether it is: Innovative, Impactful, and Intriguing.

The research by Gartner notes that:

“Rookout enhances observability to live production environments by enabling teams to debug actively running code. Rookout allows the use of “nonbreaking breakpoints” to get instant outputs on key variables and metrics from complex, distributed systems including microservices and cloud-native applications. This mechanism allows a nonintrusive way to interact with running applications to aid rapid problem identification and resolution of service-impacting issues, without the need to write more code and redeploy versions of the application.

Rookout allows a polyglot approach with support for Java, .NET, Python, Node.js and Ruby (support for additional languages including Golang is planned). Because it runs against real production data, Rookout puts an emphasis on data security and is compliant with a number of regulations and certifications, including SOC2, GDPR and HIPAA. It can be deployed in either a fully SaaS mode or as a hybrid on-premises/SaaS mode that allows sensitive data to remain within the organization’s firewall.”

What it’s all about

Writing new code means writing new bugs. There’s no way around it – it’s a fact of every developer’s daily life. And since debugging is such a critical component of a software engineer’s work, they need the right tools to make sure they can do so quickly, efficiently, and with as minimal frustration and wasted resources as possible. When debugging, developers face the challenges of not being able to get the necessary data they need to gain visibility into what is happening in their code. Instead, to get the data they need, they have to write extra logs, write new code, redeploy, and ultimately stop their application to get the data they’re looking for. This can take anywhere from hours to weeks. It’s painful, it’s frustrating, and even worse- it also negatively impacts customer experience when downtimes and bugs occur. 

With Rookout’s Dynamic Observability platform, developers can instantly access the code-level data they need in order to troubleshoot and understand complex, modern applications, with no extra coding, redeployments, or restarts. It is the latest in obtaining real-time access of any data point within an application when it’s needed so that teams can make better and more informed decisions about how to resolve issues. The platform is based on dynamic instrumentation, which is made possible via bytecode manipulation that other logging and APM vendors simply can’t do. 

So why should engineering teams and managers care?

Gartner emphasizes the benefits Rookout’s solution brings to its clients and for any engineering team by stating:

“Rookout will be of interest to a number of teams, including developers, SREs and IT operations. Any role that involves responsibility for the operation of complex applications in modern cloud environments, and for the resolution of any issues that arise, should assess Rookout for its applications.

Rookout is also of interest to engineering managers looking to improve the productivity and velocity of their development teams by reducing time spent on traditional logging, debugging and reproducing issues for remediation.”

What’s next

We are continuing to build the best suite of dynamic observability products, where the live-debugger and live-logger are the first of many solutions coming soon. 

In the meantime, if you want to resolve software issues 5X faster, boost productivity and velocity, and adopt shift-left observability for your engineering team – Try Free Now, or Contact Us to learn more about the future of debugging and issue resolution.

Disclaimer: The GARTNER COOL VENDOR badge is a trademark and service mark of Gartner, Inc. and/or its affiliates and is used herein with permission. All rights reserved. Gartner does not endorse any vendor, product or service depicted in its research publications and does not advise technology users to select only those vendors with the highest ratings or other designation. Gartner research publications consist of the opinions of Gartner’s Research & Advisory organization and should not be construed as statements of fact. Gartner disclaims all warranties, expressed or implied, with respect to this research, including any warranties of merchantability or fitness for a particular purpose.

Rookout Sandbox

No registration needed

Play Now

Table of Contents
Get the latest news

Level Up Your Cloud-Native Debugging Experience

Oded Keret | VP of Product

4 minutes

Table of Contents

Debugging is hard. Cloud-native debugging is even harder. Debugging Kubernetes and Serverless applications sometimes feels nearly impossible when:

  • Debugging code running remotely, dynamically, and sometimes completely in virtual environments
  • Making sense of a rapidly changing code base, most of which has been written by someone else
  • Experiencing a long and complex deployment process that makes pushing changes and log lines long and cumbersome

These classic remote debugging challenges have made the world of cloud debugging seem impossible at times and has given rise to the practice of Observability.

The rise of the Observability trend in recent years has directed engineers towards one direction to solving these problems: print logs, print traces, throw exceptions. Collect the above data points in a centralized monitoring and visualization tool and use them to troubleshoot. And then, when a new problem arises that requires printing new logs, traces, and errors? Just add code.

Cloud-Native Debugging & Observability

That last comment about adding code has emphasized a key challenge in Cloud-Native debugging: the need to wait for new data to come to light. Live Debugging tools and Live Observability practices have added a new edge to the Observability domain in the past three years or so. Here at Rookout, we have been providing our customers with Live Debugging capabilities, allowing them to debug Kubernetes and Serverless applications in production and staging for a while now.

And, as trailblazers, we have seen our customers face new challenges as they’ve been using our cutting edge solution to debug their Cloud-Native production environments.

We have seen our customers struggle to reproduce issues locally, predominantly in cases where it’s very hard to recreate a copy of a remote environment while simulating the scale, complexity, network conditions, and data state in the live app.

Some of our customers have adopted tools like Tilt, Garden, and Skaffold to simplify and automate this flow. Other customers have taken the opposite approach, opting to gain visibility into the remote environment within a speed and user experience that is as close as possible to the local debugging experience, using tools like Telepresence and Okteto.

We see our customers working hard to manage an ever growing tech stack. The number of programming languages, cloud management frameworks, and the sheer magnitude of tools and code lines that make up their observability pipeline is its own challenge.

Along with the growing scale of the tech stack, the volume of data is growing as well. Managing code version changes, configuration changes, variable state, stack trace, and other data points that need to be thrown together to make sense out of the application behavior is a serious undertaking. Fetching log lines, debug snapshots, error messages, and traces from a running app, shipping the data into a centralized pipeline, and creating the relevant dashboards and alerts on top of the collected insight requires a specialized set of tools and skills.

Visual Debugging Sessions

A key demand we have heard from our customers when trying to tackle the above challenges is a deep need for visualization. Having the ability to dynamically generate new log lines and debug snapshots and metrics has been the bread and butter of Live Debugging tools like Rookout since the inception of our first product launch. But having the ability to collect said data points and present them in the right context, all while providing a visual representation of the state of the application and giving a clear and intuitive way to slice and dice data based on the architecture of the application, takes Live Debugging to the next level.

This is where the concept of a visual debug session was born. We wanted to help software engineers make sense out of the growing complexity of debugging cloud-native applications. So, on top of the basic ability to deploy the Rookout agent in Kubernetes and Serverless environments (which has been around for a few years now), we now show the same environments in a way that provides deeper insight. By visualizing the state, scale, and clustering of the application, as well as allowing our users to slice and dice and prioritize problematic clusters and pods with the click of a button, we aim to make the cloud debugging experience something that is as easy and intuitive as, well, local debugging of a single app running on your desktop.

Go SDK

To wrap it all up, and to be able to tell a true “Kubernetes Debugging” story – we’re also launching a brand new Go SDK. As we know that Go is the go-to language for developing Kubernetes apps (pun intended), we realized that it was just a matter of time before we added the ability to debug Go apps using Rookout. In fact, it helps us wrap up our “eating our own dogfood” story, as we’ve been using an internal version of the Go SDK when debugging Rookout itself for a while now.

So if debugging cloud-native applications is still a challenge for you and your team, we hope things will be much easier now. We expect the new and visual Cloud-Native Debug Session, with its focus on making Kubernetes a first-class citizen at Rookout, and the newly added support for Go, will make your cloud troubleshooting much more effective.

-Happy Debugging-

Rookout Sandbox

No registration needed

Play Now

Table of Contents
Get the latest news

Debugging a Node.js Application with a Production Debugger

Josh Hendrick | Senior Solutions Engineer

8 minutes

Table of Contents

Production debugging in its current form is a relatively new area of technology that aims to make it easier for developers to solve problems in their code. More often than not, we don’t have all the information we need to solve those hard to reproduce bugs. This leads to long hours of debugging, adding more log lines, and creating separate reproduction environments to try to isolate and reproduce problems. The objective of production debugging solutions is to take much of the pain out of these situations by giving developers direct access to their code-level data in live applications whenever they need it.

As I was sitting down and thinking of all the interesting use cases there are for production debuggers, I thought it would be an interesting experiment to deploy Rookout into an open source project and show how easy it is to start debugging. I wanted a challenge, so I searched GitHub and came across the repository for VSCode. Given that Rookout is a developer centric technology and VSCode is a wildly popular developer IDE created by Microsoft, it seemed like a fun choice to see how easy it would be to configure a third party production debugger that was able to help debug VSCode on the fly.

In this article I will show step by step how I configured Rookout within VSCode, a big portion of which is written in Node.js, and was able to set up a live debug session.

Setting up My Environment

To start I needed to clone the VSCode repository and set up my build environment. The instructions on this page were great for getting started building the project. If you want to follow along, you’ll need to ensure you have all the necessary prerequisites listed. 

I simply cloned the repository like so:

git clone https://github.com/microsoft/vscode.git

This project uses Yarn as the package manager, so to install and build all the dependencies it’s as simple as running the following two commands from the console:

cd vscode
yarn
And lastly, I’m on a Mac, so to launch the development version of VS Code, I ran the following:
./scripts/code.sh

If all goes well you should have a development version of VSCode running:

Deploying Rookout in VSCode

Now that I was able to get the development version of VSCode running, I was ready to deploy Rookout. In order to deploy Rookout into a Node.js application, I followed the setup instructions listed on this documentation page

When deploying Rookout in a Node.js application, the basic premise is that we’re installing an npm package, essentially another dependency for our application, as well as making a few minor configuration changes. Once Rookout is running within our application, we’ll be ready to start live debugging which we’ll take a look at in the next section.

To start, we can install the npm package into the application:

npm install --save rookout

Then we need to add a few lines of code at the entry point of the application. In this case that’s the main.js file located at src/main.js. I went ahead and added them at the top of the file:

/*---------------------------------------------------------------------------------------------

 *  Copyright (c) Microsoft Corporation. All rights reserved.

 *  Licensed under the MIT License. See License.txt in the project root for license information.

 *--------------------------------------------------------------------------------------------*/
//@ts-check
'use strict';
const rookout = require('rookout');
rookout.start({
token: '<rookout token>',
labels:
{
"app": "vscode"
}
});
/**
 * @typedef {import('./vs/base/common/product').IProductConfiguration} IProductConfiguration
 * @typedef {import('./vs/base/node/languagePacks').NLSConfiguration} NLSConfiguration
 * @typedef {import('./vs/platform/environment/common/argv').NativeParsedArgs} NativeParsedArgs
 */
...

In the above code, first we include the rookout module and start the Rookout SDK passing in our Rookout security token as well as a label so that we can properly filter our application instance when we’re ready to debug. That was simple enough, but we’re not quite there.

The VSCode project uses Typescript which is a superset of Javascript that compiles down into plain Javascript. When using Rookout to debug, Rookout will automatically compare the file you are trying to debug in the Rookout UI with the file that you have deployed in your runtime environment so that it can alert you to any changes between the two files. If the files are different, this would typically mean that you are attempting to debug the wrong version of your code. In the case of Typescript, the .ts files are transpiled into .js files. To ensure that Rookout can intelligently compare these two files, it will need to have source maps generated which provide a way of translating the generated source files back into the original.

Let’s configure the project to generate inline source maps. To do that we can modify the tsconfig.js file located at src/tsconfig.js

{
"extends": "./tsconfig.base.json",
"compilerOptions": {
"removeComments": false,
"preserveConstEnums": true,
"sourceMap": true,
"inlineSources": true,
"outDir": "../out/vs",
"target": "es2020",
"types": [
"keytar",
"mocha",
"semver",
"sinon",
"winreg",
"trusted-types",
"wicg-file-system-access"
],
"plugins": [
{
"name": "tsec",
"exemptionConfig": "./tsec.exemptions.json"
}
]
},
"include": [
"./typings",
"./vs"
]
}

Following the documentation at https://www.typescriptlang.org/tsconfig#inlineSources, we can set inlineSources to true. It also requires sourceMap to be set to true, so we’ve set that as well. More details on this can be found in the Rookout documentation here. Now we’re almost there.

Lastly, when doing Node.js debugging of Electron applications, the –inspect flag needs to be set which causes the Node.js process to listen for a debugging client. In order to pass the inspect flag, we can modify the VSCode startup script. To do that, we can modify the code.sh script located at scripts/code.sh:

function code() {
cd "$ROOT"
if [[ "$OSTYPE" == "darwin"* ]]; then
NAME=`node -p "require('./product.json').nameLong"`
CODE="./.build/electron/$NAME.app/Contents/MacOS/Electron"
else
NAME=`node -p "require('./product.json').applicationName"`
CODE=".build/electron/$NAME"
fi
# Get electron, compile, built-in extensions
if [[ -z "${VSCODE_SKIP_PRELAUNCH}" ]]; then
node build/lib/preLaunch.js
fi

# Manage built-in extensions
if [[ "$1" == "--builtin" ]]; then
exec "$CODE" build/builtin
return
fi

# Configuration
export NODE_ENV=development
export VSCODE_DEV=1
export VSCODE_CLI=1
export ELECTRON_ENABLE_STACK_DUMPING=1
export ELECTRON_ENABLE_LOGGING=1
# Launch Code
exec "$CODE" --inspect . "$@"
}

In bold above, we can see the place where the –inspect flag has been added. And that’s it, we’re ready to debug!

Let’s Debug a Node.js Application

Now that all the configuration has been done, we are ready to start debugging VSCode in Rookout. First things first, we need to re-compile the project, build the dependencies and then restart VSCode:

yarn compile
yarn
./scripts/code.sh

If everything went well, VSCode should now be running:

Joshs-MBP:vscode jhendrick$ ./scripts/code.sh
yarn run v1.22.10
$ node build/lib/electron
✨  Done in 0.70s.
[20:14:07] Syncronizing built-in extensions...
[20:14:07] You can manage built-in extensions with the --builtin flag
[20:14:07] [marketplace] ms-vscode.node-debug@1.44.32 ✔︎
[20:14:07] [marketplace] ms-vscode.node-debug2@1.42.10 ✔︎
[20:14:07] [marketplace] ms-vscode.references-view@0.0.80 ✔︎
[20:14:07] [marketplace] ms-vscode.js-debug-companion@1.0.14 ✔︎
[20:14:07] [marketplace] ms-vscode.js-debug@1.59.0 ✔︎
[20:14:07] [marketplace] ms-vscode.vscode-js-profile-table@0.0.18 ✔︎
Debugger listening on ws://127.0.0.1:9229/30743951-7f09-4b4f-9d42-ba1329d26c9f
For help, see: https://nodejs.org/en/docs/inspector
[main 2021-08-04T03:14:09.020Z] window: using vscode-file:// protocol and V8 cache options: none
[28010:0803/201414.536367:INFO:CONSOLE(265)] "%c[Extension Host] %cdebugger listening on port 5870 color: blue color:", source: vscode-file://vscode-app/Users/jhendrick/rookout/workspace/vscode/out/vs/workbench/services/extensions/electron-browser/localProcessExtensionHost.js (265)
...

We can now login to Rookout to validate that our SDK connected successfully. Within Rookout we can navigate to the Connected Application page to validate:

From the above screenshot we can see that the SDK connected successfully. Notice that the source origin and revision fields are automatically set. Rookout automatically looks at the .git folder at the root of our application to populate those fields. This allows Rookout to automatically fetch the source code repository when we select our instance and start debugging. Let’s take a look at that next.

Switching to the debugging view within Rookout, we can select the instance to debug:

Clicking Start Debugging brings us into the debugging view so we can start setting non-breaking breakpoints within the application.

Notice that we see auto loaded in parenthesis next to the repository which means that behind the scenes when we selected the instance to debug Rookout automatically fetched the repository using the GitHub API. This makes it easy to ensure that we’re debugging the same revision of the code which we have checked out locally.

Now we’re ready to set a non-breaking breakpoint. Let’s say we wanted to debug the part of the code responsible for the save dialogue. We can open the dialogMainService.ts file and set a breakpoint:

Now we simply need to trigger the code by going to VSCode and saving the Workspace:

From within Rookout, we can see that we capture a message containing debug data with the relevant contextual information including variables, process information, stack trace, and more:

And that’s it. We’re now able to write code and debug it on the fly using Rookout!

Conclusion

Within this article we showed how easy it is to get started debugging a Node.js application with a production debugger like Rookout. It is a powerful approach to solving issues quickly and efficiently, wherever your application may be running. Even in production.

If you have your own Node.js project, hopefully you can use this as a guide in getting started with setting up Rookout within your project. Rookout not only supports Node.js but also Java and other JVM based languages, .NET, Python, and Ruby. Happy debugging!

Rookout Sandbox

No registration needed

Play Now

Table of Contents
Get the latest news

It’s Time To Turn On The Light With Dynamic Log Verbosity

Oded Keret | VP of Product

8 minutes

Table of Contents

As we recently discussed, many of us are still lost in the darkness, grasping for a log line to shed some light on the issue we are trying to troubleshoot. Many of our customers and colleagues have shared the following challenges with us:

  • We print only WARNING and ERROR levels of logs in production, in an attempt to reduce logging cost, performance impact and logging “noise”.
  • When a problem occurs we wish we could have the detailed DEBUG and TRACE level of logs we had when developing locally, but increasing log verbosity in a live environment is often considered risky and expensive.
  • Changing log level usually requires restarting the application, and it is hard to control the amount of logs added by applying such a change.
  • Even if we could print everything without worrying about performance and cost impact – we would still be flooded by a torrent of irrelevant log lines, only a few of them relevant to the issue we are trying to troubleshoot

But what if we didn’t have to make such a choice? What if we could easily and efficiently switch on exactly the logs we needed, without hurting our application? That is the question we had in mind as we started working on the latest offering from the Rookout team: the newly released Rookout Live Logger.

At first glance, Rookout’s Live Logger should look familiar to any developer who has ever used a Live Tail feature in their favorite observability tool. A search box at the top, some filter checkboxes on the left-hand side, a dark background full of log lines front and center. If your go-to method for debugging is using logs, this design should help you feel right at home. But a closer examination of the experience reveals the key difference between Rookout Live Logging and the many Live Tail implementations out there.

Live Tail features in classic observability products, such as Datadog, Logz.io and Sumo Logic, mostly provide the user experience of real time. That is, log lines are shown in real time as they appear, giving the developer a sense of what’s actually happening right now. But when it comes down to it, these features only show logs that were already printed, shipped to the logging service, indexed, and stored.

Rookout Live Logger takes this experience once step further by actually causing new log lines to be printed. By integrating with popular logging libraries such as Log4j, Logback and Winston, the Rookout SDK is able to perform bytecode manipulation and “switch on” log lines that were otherwise hidden. This core capability empowers software engineers to collect real time data with the click of a button, using the insight baked into log lines that were added to the code but were disabled when the code was shipped to production. How does that work? Let’s take a closer look.

[Let there be logging light]

[Let there be logging light]

1 – Dynamic log verbosity

The most frequently repeated phrase we hear from our customers is “I wish I could just easily switch on DEBUG logs without worrying about restarting the app and impacting cost”. Taking this sentiment into account, the first feature we baked into Rookout Live Logger was the ability to do exactly that.

Rookout Live Logger lets you gain deeper insight into the behavior of your app by switching on INFO, DEBUG, or even TRACE logs with the click of a button. The fact that you can increase log verbosity for a limited amount of time, and the fact that you can pinpoint your data collection by using the advanced filter capabilities described below, means that you get exactly the extra log lines that you need No more, no less.

2 – Text-based filtering

When searching through a cascade of seemingly identical log lines, perhaps the most intuitive way of getting the information you need is by typing a short string of text. Rookout is able to only “switch on” log lines that contain the wanted string, ensuring that the log lines printed to your screen (and later pipelined to your observability platform) all match the pattern you are looking for.

Printing only log lines that contain a sneaky error message is a no-brainer. Printing only log lines that came from a specific service, or that mention a problematic variable value, is a bit more advanced. However, you use this capability – it will give you a coarse level of control over the logs you are about to turn on using the verbosity filter.

[Switch a powerful searchlight on to fetch in-context logs]

[Switch a powerful searchlight on to fetch in-context logs]

3 – Context based filtering

String filtering is the most intuitive action for a developer, but it has its limitations. First and foremost – we don’t always know what string we are looking for. This is where context based filtering comes in.

Context based filtering leverages Rookout’s built-in integration with tools that implement the OpenTracing and OpenTelemetry standards. By fetching context data from said tools, Rookout Live Logger lets you switch on only log lines that are printed during execution of code relating to specific users, accounts, services, or other transaction related information that will allow you to quickly get to the root cause of an emerging problem.

4 – Log throughput tracking

How many log lines get printed in your app every day? How many I/O resources get spent on shipping these log lines to your log storage provider? If you know these numbers it might be because you already got an urgent call from your DevOps team asking that you reduce overhead and storage costs.

So before shipping additional log lines to your observability platform, you want to check out the additional log lines being printed by increasing log verbosity. Tweak the volume using the above filters, and only then ship your additional log lines to the chosen Target. This will allow you to gain the additional insight and context needed without hurting your application and without adding noise.

[Light up your observability platform without setting your app on fire]

[Light up your observability platform without setting your app on fire]

5 – Log pipelining

Once you view your newly printed log lines in a Live Tail experience, and once you’ve applied the relevant filters to ensure the increase in throughput is manageable, it’s time to ship the newly printed log lines to your observability pipeline.

Rookout Targets include the most popular log management and APM tools, allowing you and your team to consume the newly printed DEBUG and TRACE data side by side with data collected by other sources.

6 – Enterprise and production ready

Rookout Live Logger is built by the same team that gave you Rookout Live Debugger. That means that the usual Rookout benefits are also baked into our new offering. Live Logger is designed to be a production-grade observability tool. That means that performance impact is minimised, and that secure and compliant data collection are ensured.

It also means that our new solution offers the widest technology coverage available today. In terms of supported languages, cloud vendors and deployment methods, as well as integration with other observability, logging and monitoring tools.

[Light up your observability platform without setting your app on fire]

To recap, we have introduced a revolutionary tool that lets you gain full control of your logging and observability pipeline. When problems arise and you are missing log information, you may now easily switch on log levels that were previously hidden. Advanced filtering and context capabilities let you ensure that only the needed log lines get printed, making sure that the additional logging cost and overhead are minimized. This gives you and your team the confidence and flexibility needed to quickly and effectively solve production issues with the data you need at your fingertips.

You may also note that the new solution complements our existing product: Rookout’s Live Debugger. Our Live Logger lets you turn on log lines that already exist in your code, while the Live Debugger lets you create new log lines on the file when these aren’t written in your code to begin with. The Live Logger lets you switch on logs everywhere, while the Live Debugger pinpoints your search to a known line of code. And while the Live Debugger is usually used to fetch a small number of detailed debug snapshots, our Live Logger is designed to generate a larger volume of log lines.

Rookout’s Live Logger is designed to be a powerful, yet focused, searchlight you can switch on with a click of a button, without worrying about setting your app on fire. We believe this searchlight will give software developers the courage they need to investigate production issues without worrying about a missing log line or about stopping the app and waiting for a code change to be deployed. For as we said earlier, it is better to light a candle than to curse the darkness. But turning on a searchlight is even better.

So that fruitless search for missing log lines? Make it a thing of the past with our new Live Logger. And if you’re looking for more information – or want to try it out for yourself! – check it out here.

Rookout Sandbox

No registration needed

Play Now

Table of Contents
Get the latest news

Rookout’s Live Debugger Now Available on Microsoft’s Azure Marketplace

Elinor Swery | Director of Solution Architecture & Partnerships

4 minutes

Table of Contents

We have recently launched our disruptive Live Debugger on the Azure Marketplace, making it easier than ever before for teams on the Microsoft stack to slash the time they invest in debugging.

We are excited about this, as we have been working closely with Microsoft to make sure that both large international enterprises as well as smaller and scaling startups have direct access to Rookout, to make the most out of our dynamic observability solutions. You can use Rookout to debug your .NET code that is running on the Azure cloud. Rookout also has integrations to Microsoft Teams and Azure DevOps. 

But what is live debugging? Read on to find out more!

In the last few years, there has been an increasing expectation of teams to rapidly deliver digital solutions for immediate business problems. Software development teams are constantly confronted with the challenge of shipping code faster than ever before while ensuring that quality and security are never compromised. These challenges are coupled with the ever increasing complexity of distributed architecture, which on one hand provides scalability and simplified development, but on the other can create an inherent struggle to understand and troubleshoot issues.

When you spot an issue, whether by yourself or by your client telling you that there is something wrong (which let’s be honest, is never fun to experience), it’s often difficult to understand what is truly happening where. Having your code run on cloud, especially when you are on a distributed, serverless environment, means that you don’t always know exactly where your code is being executed. There are multiple microservices communicating with each other, thus making it difficult to get a holistic view of your application. And recreating the situation locally? It is next to impossible. In addition to this, the fact that your environment is continuously changing (instances are deployed and torn down dynamically without the ability to predict when nor which ones) makes it even harder to gain visibility into what’s happening.

Remote debugging has been developed to target these exact situations. Remote debugging is the practice of debugging applications that run in an environment that is different from the local environment on which a developer works on and it allows the developer to debug the code without disrupting the use of the system (i.e. you can debug an application in parallel to it running in production). It empowers developers to handle the complexity of modern applications by using data to understand their code, in real time, as it is running. Remote debugging makes debugging simple and accessible in any environment (from Cloud Native to on-premise) and is the method most suitable for solving the pain and frustration that is debugging distributed code that has spread and shifted over multiple repositories.

Rookout Live Debugging lets developers do exactly that: debug live, remote applications without adding code and without stopping the application – wherever it is deployed. You no longer have to reproduce the issue locally or add log lines. With the use of Non-Breaking Breakpoints, Rookout allows engineers to handle the complexity of modern applications by seeing into their code in real-time, as it’s running. The solution lets developers find the information they need and deliver it anywhere, in order to understand and advance their software. Ultimately, it saves hours of work and reduces debugging and logging time by 80% – with zero friction, overhead, or risk. 

With a click of a button, you can set a Non-Breaking Breakpoint and get the debug data you need on the fly without stopping your app, helping you to get to the root cause and solve the issue.

All of this can be achieved without the need for additional loglines, additional metrics, or the need to reproduce more issues.

Rookout’s live debugger has been extensively used by teams to debug their remote environments, from new startups to large international enterprise companies.

Rookout provides a comprehensive security and compliance offering that is fire tested at a large scale in the production environment of some of the strictest global companies. Rookout is SOC 2 Type 2 compliant and ISO 27001 certified. Rookout offers data processing agreements for GDPR, CCPA, and HIPAA and has different architecture models suitable for any company. 

That’s all you need to do to debug easily and efficiently. While it may sound too good to be true (it’s not, though!) – we’ve got you covered. And if you are a company that loves and trusts the Microsoft offerings, check out our live debugger which is available right in the Azure Marketplace. And let us know what you think! 🙂

Rookout Sandbox

No registration needed

Play Now