Rookout is now a part of the Dynatrace family!

Table of Contents
Get the latest news

Why Developers Should Care About Resilience

Oded Keret | VP of Product

5 minutes

Table of Contents

Recently, a friend reminded me of a joke we used to have when we were both developers at a huge software corporation (we won’t mention names, but back when printers were a thing, you probably owned one of theirs). We didn’t develop printers. We developed performance testing and monitoring tools.

We were the dev team, which was completely separate from the QA team and from the Ops team (yes, I’m that old – we didn’t even call it DevOps back then). Support was part of a completely different organization and “business” was something that happened in an altogether different galaxy. That is, until a customer had an issue.

When an important customer had an issue, we definitely felt it at R&D. Managers called hourly to check on status, and we would have intense conversations with the support team who would then, in turn, have intense discussions with the customer. If we, the software engineers developing the product, ended up on the same call with both support and the customer, it was a sure sign that things were bad. You knew that millions of dollars were on the line, and, consequently, that pressure was high. But most of all: you knew that we would do anything we could to solve the problem, because we needed those millions of dollars to be paid, so that we could keep getting paid. And so, we kept the coffee flowing.

This is where the joke part comes in. We used to have a system for managing support tickets, collecting information, tracking time and assigning it to the relevant software or support engineer, so everyone would know who was in charge. Today, you probably use Zendesk, ServiceNow or one of their alternatives. We used a home grown system, of course.

Our joke was this: the purpose of the system was not to track and measure and propagate the handling of customer issues. The purpose of the system was to indicate someone else is now responsible for solving the problem. Or, if you would rather paraphrase one of my favorite Douglas Adams jokes, the issue is now under a Somebody Else’s Problem field.

Because solving customer issues is difficult and frustrating, and being pressured by business could ruin a software engineer’s day. This is because when you’re a happy code monkey, and all you want to worry about is writing beautiful code and releasing cool features and drinking some coffee, solving a customer issue gets in your way.

You end up spending too much time sifting through endless logs, crossing your fingers and trying to reproduce an issue that only happens at 2 a.m. on a Friday, usually when a blue zebra is passing by. Spending your time on a heated support call is less fun than, say, drinking coffee quietly with your friends.

As R&D managers, we understand that our developers want nothing to do with solving customer issues. We want to make sure they are motivated and happy and efficient, and that they are free to challenge themselves by learning the latest buzz-worthy technologies and thinking up ways to introduce those into our product in a way that will make our customers happy.

Additionally, as R&D managers, we are far more likely to understand the business impact of having too many support tickets or having support tickets that take too long to resolve. We know that the loss on such cases is twofold:

1. The customer that faced an issue and is waiting for a solution may become frustrated, and the company may lose their business.
2. Our engineers are busy solving that customer issue instead of delivering new value to the business.

Therefore, as R&D managers, it is our responsibility to make sure that our engineers have the tools to handle these issues as efficiently as possible when they come up. It is our responsibility to make sure they are motivated, and that they understand the business impact of solving a customer issue as quickly as possible. And whenever possible, it is our job to make sure that they make our application as reliable and stable as possible to begin with.

That ensures that we have test coverage, and the right knowledge, practices and tools to ensure that we have as few customer issues as possible to begin with.

Happily, changes in dev culture usually means that “support” and “business” and even “customers” are not as far away as they used to be. When developing a SaaS platform, your developers often have an almost intimate, real-time ability to track what users are doing and how it impacts their experience. The culture of DevOps has done a lot for breaking the silos that used to separate the dev team from the support team, and to make sure that all members of the team engage and understand how the code they write and the issues they resolve help our customers.

I hope you already found the way to motivate your team to solve such issues, and that they have enough time to drink coffee. If you and your team are still struggling, we suggest bringing in a live debugging tool that can help them solve customer issues even faster, by making sure they have all the data they need at their fingertips, and that they can instantly reproduce any issue in a live, remote environment. Live debugging tools give your engineers a developer-friendly experience, and also gives them the power to reduce issue resolution time, too. Now, all you need to worry about is that your engineers have enough coffee.

Originally published on DevOps.com

Rookout Sandbox

No registration needed

Play Now

Table of Contents
Get the latest news

Resilience: The Muscle We Always Need to Train

Elinor Swery | Director of Solution Architecture & Partnerships

6 minutes

Table of Contents

Last year tested us on many fronts and resilience was a major theme. How well we handle change, unrest and uncertainty have all translated into how well we can deal with major events — such as a global pandemic. Being able to quickly adapt our habits has helped us make the most of the unique year that we had. Teams transformed into effective remote workers, students attended school online, and businesses found creative ways to continue operating through restrictions — all illustrating our resilience and ability to quickly recover from difficulties and changes.

For technology companies, having resilient teams, products and processes is incredibly important — even beyond 2020.

Gone are the days when we could afford to develop a product and run it through endless QA cycles, ensuring that every single permutation was checked off and approved. In today’s environment, the ecosystem is working at incredible speeds. No one waits for a product to be complete before pushing it out to users. Instead, we rely on something that is sufficient and continuously iterate on it. For that reason, we need to learn to be ok with unknown challenges, bugs and timeouts. Quality should not be compromised by any means, but having the resilience to operate when faced with an unknown issue oftentimes can — and will — make or break companies.

We have all experienced disruptions in our favorite digital product providers — be it when Slack had an outage and left us unable to communicate with colleagues during lockdown, or when Google Drive stopped working and for a moment we questioned whether it was okay to rely on remote work tools for everything we do. For many large companies, if something goes wrong, there will be plenty of PR. They might lose money, but eventually, they will move on. It will be an inconvenience, but not a showstopper. For smaller companies, if we have an outage and if we lose one client, it could have devastating effects on the business as a whole. For many smaller to medium-sized companies, we already have resilience ingrained in everything we do — which strengthens our problem-solving. Instead of getting hurt, we make the most of the circumstances we face every day.

So how can we build our resilience muscle?

Building Resilient Processes

Having processes implemented which enable a company to deal with outages, challenges and unplanned events is paramount. Even though each crisis might be different, knowing how to deal with it and which steps to follow takes the guesswork out of a stressful time. Just like we are taught in First Aid: no matter what the injury is, we first need to maintain a patient’s airway, then ensure they are breathing and have a pulse. Similarly, we can build processes that will guide us through any situation, thereby increasing our resilience to dealing with new challenges.

One such example is the habit of running post mortems after dealing with an event. A postmortem brings the team together and gets them to think critically about what went wrong, how things were dealt with, and most importantly, discuss how it should have been dealt with — thus enabling the team to create a prevention plan.

Rookout Sandbox

No registration needed

Play Now

Table of Contents
Get the latest news

Disaster Recovery Plan: How to make sure you’re prepared for the worst

Gilad Weiss

7 minutes

Table of Contents

The first lesson you learn as you start to work around the DevOps field is that being optimistic is not a good virtue. While that might seem overly pessimistic, let me explain. We plan our architecture to fit our needs, deal with edge cases, scale our applications up and as wide as we see fit, and with all of that, we still always expect for the unexpected to happen. As engineers, we are expected to deal with that unexpected. We need to plan ahead and to set out as many insurance layers as possible in order to combat any unforeseen (or seen) circumstance. 

Short of a potential zombie apocalypse, you and your developers should be prepared for the worst of the worst and know how to make sure that your company’s most precious assets – such as running apps in various environments and your data – are protected. And by protected I mean that your data is still accessible and intact and your infrastructure is entirely up-and-running when a disaster could potentially occur. Because if something goes wrong, it’s not just your team who’s suffering. Your customers suffer too. And unhappy customers? Well, that’s a top tier disaster.

You might be reading this and thinking to yourself, “I’m well aware of the worst-case scenario, my apps are running in an elastic cloud environment and there’s a daily backup for the database”. Whether you rely on your cloud’s DR capabilities or know that your dynamic backups are working, it’s all fine and dandy. However, I want you to ask yourself this one question:

Does my DevOps team know how to act in the time of disaster?

Knowing that you have backups and recovery options for your running apps is only half the battle. You also need to minimize the risk of human error and poor documentation when it comes to disaster recovery. It may seem obvious, but oftentimes companies skip basic planning procedures. Here’s some ideas from our own experiences on how you can avoid evident pitfalls. So grab that coffee, and sit back, because we’re going on a Disaster Recovery Plan journey.

Put your hard hat on

In case you’re unfamiliar with the various terms of disaster recovery, here’s a refresher:

In simple terms: RTO (Recovery Time Objective) is defined as the time it takes for an organization’s IT infrastructure to come back online and be fully functional post a disaster. RPO (Recovery Point Objective) reflects the number of transactions lost from the time of the event up to the full recovery of the IT infrastructure.

From: sungardas.com 

Your software product – whether hosted on-prem or on cloud – is vulnerable to various types of system failures, such as cyber attacks, power outages, or even physical hazards.

In order to have minimum RTO in those cases, you need to make sure that all your saved data is backed up and your running apps have an alternative hosting area.

There are dozens of options in the IT market for DR abilities, whether it’s cloud-internal like AWS’s CloudEndure, or external like Acronis, Rackware and other DRaas services that let you backup your apps and data and switch to them quickly when you need to. So how do you start?

The first step of the plan is to identify the various components in your infrastructure and the treatment they need in terms of backups:

  1. Should I use online backup or offline backup for my DB?
  2. Are the availability zones enough for my kubernetes deployment?
  3. Should I move my data to an on-site unit in the worst case scenario?
  4. What are the options my cloud provider has for me?
  5. Is moving my pods to a new cluster enough?
  6. What about secrets rotation?

The answers to these questions define your DRP and what you need to do when you need to evacuate your data. Often, the chosen practice is deploying your infrastructure to DR dedicated hosts, restoring DB backups at a secondary location and ensuring routing to those new locations.

Keep it warm

As I previously mentioned, having a plan is only half the battle. Since the DevOps team is the one that should operate the DRP and they’re only human (shocking, I know), you’ll want to minimize the chances for human error. In order to ensure that happens, the plan’s execution should be practiced as a dry-run on a regular-basis by your team. That will ensure you and your team are knowledgeable and fully prepared for the real world scenario.

Here at Rookout, we have an annual dry-run day in which we test out our DRP. It also serves as a good opportunity for seniors on the team to sharpen their skills and for the juniors to make sure they are familiar with the infrastructure itself. After each dry-run of the DRP, the plan is updated, so that when a real disaster occurs the team won’t face any unexpected obstacles. Dealing with those obstacles is crucial for minimizing production downtime and the RPO.

Documentation and rewriting are the essence of the annual dry-run. We check the relevancy of each step along the way in order to have the simplest and most coherent plan. During the execution of the DRP we will periodically ask ourselves: Is this image still used? Is the version of the Helm chart supported? How can I test that the deployment went well? How can this be done if the backup is up-to-date? 

Not once did we find old images and obsolete steps that could really affect our RPO and RTO if the plan was to be executed for real.

This is actually our desired state. Be cool when the other shoe drops.

Some practical suggestions

In your knowledge-shared environment, have a DRP-related file with all the steps that one needs to run in order to activate your DR plan. The steps should be easy to follow and cover all the work that needs to be done in order to achieve a working, full-system environment in a new “location”.

A new location might need to be configured with a new load balancer, APM components, SSL enforcer, cyber-defense-related components and the list goes on. A full system means a full package.

Set an annual date for the dry-run DRP so the responsible engineers will know to prepare for it. I also suggest having a private or internal repository hosted in your source control management system, that has all the related scripts that need to be run for the plan.

In the dry-run DRP, the DevOps team should follow all steps and make sure that each step is up-to-date and relevant. The plan should be able to run alongside the production deployment and not interfere with the customer’s actions. 

Don’t forget to test out the new location! Is it accessible? Is it ready to withstand scale? Unit testing, by itself, isn’t enough for testing a DRP. In case you have periodically running testing, also run them against your new deployment environment to make sure all is as it should be. Even better, you could take down your pre-prod environment and replace it with the DR deployment.

Where to go from here?

Having a DRP is a MUST for every software that needs to run indefinitely, and having a plan needs research first, by writing up the steps, and then a regular, non-skippable dry-run just to keep the scripts and the people in shape.

The DevOps team might see this as a chore – rebuilding the already existing infrastructure, but at a different place – and it shouldn’t be like that. Operating it with less stress of a real disaster makes sure that when s*** hits the fan, you and your team are going to be able to make your company and your customers are happy. And don’t forget: “Practice Makes Perfect”.

Rookout Sandbox

No registration needed

Play Now

Table of Contents
Get the latest news

Solving Customer Related Problems with R&D

Dudi Cohen | VP R&D

9 minutes

Table of Contents

As an R&D manager, there are many things on my mind that keep me up at night. These thoughts range anywhere from impossible research explorations, employee motivation, rising cloud costs, all the way to security incidents. However, there is one that sweeps all of them aside when they surface and that is solving customer facing issues. In its raw form, a customer issue means that someone who is paying you money can’t use your product or that your product isn’t doing what it’s supposed to do. And that someone can also decide to stop paying you money.

It’s a pretty simple equation: handle the customer issue or your company loses money. This sort of equation, when left unsolved, keeps me up at night. Since I like sleeping, I try to resolve our customer’s issues as fast as I can. And since I assume most of you do too, following are some of my strategies on how to handle those issues and sleep like a baby.

Admitting there is an issue

The basic essence of a customer issue is the fact that when you need to handle a customer’s issue, it is usually unplanned. I’m pretty sure no sane engineer ever released a version and awaited eagerly for that 4AM phone call from a customer. As unplanned tasks usually happen, we sometimes try to shrug them off or wave them off with disbelief. An instinctive reaction would be to say that “the customer is doing something wrong” or “the issue is unrelated to our product”. While these assumptions might be true on occasions, they don’t in any way change the fact that there is an issue that requires resolving. If the customer is doing something wrong or misusing our product, we need to be attentive and explain to the user how to properly use the product (and later on understand why he was doing what he did). If the customer thinks the issue is related to our product, then we need to prove to the customer why it isn’t related to our product. Waving hands and pointing fingers at other culprits without evidence won’t solve anything.

The first thing you have to do is admit there is an issue. Whether the customer approached you by chat or via a support representative doesn’t matter. A customer issue is an issue that requires resolution the moment the customer thinks it is an issue. And if there is an issue requiring R&D attention, you must assign an engineer who’s in charge. Most importantly, everybody needs to understand who the person is that’s responsible for handling the issue.

Start and move forward with information

Once you’ve admitted there is an issue and assigned an engineer, you’ll need to understand in which scope R&D needs to handle the issue. In our R&D team at Rookout, we have a very close relationship with our Account Managers, Support Engineers, and our Customer Success team. This sort of close relationship allows these teams to easily communicate their customers’ issues and their own concerns with us. There is no such thing as a ‘stupid question’, and we try to help them out whenever we can. But we always need additional information, and an account manager intimately knows their customer’s history and tech stack, which is seldom true for our R&D engineers.

When an issue is elevated to R&D, we need information to be able to take care of it. Being told that “customer X is having issue Y” contains no useful information for us. We need to understand how the customer has deployed and integrated Rookout, whether the customer has used Rookout before, what issues the customer has encountered in the past, what exactly the customer reported, and which steps the support engineer tried to take. Basically, we need to know everything.

Every piece of information is critical, whether it is past communication with the customer or even what the customer’s hunches and assumptions are. Without information and properly documenting everything, you are just a goldfish that has to do everything every time from scratch. The information is so important you need to make sure you document everything. Every step that you take, every communication with the customer, and every piece of data related to the issue must be documented. When handling an issue in Rookout, we document each step in a dedicated Slack channel for each customer and eventually write the information in the relevant Jira ticket.

Work together

Once you have the necessary information, you can devise a plan to handle the issue. If this is an issue the support engineer can handle alone, then just go ahead and give them the proper tools to remediate the issue. It might be just a link to the relevant documentation or some hand holding using a complex feature. Either way, you will need to work together. Remember that talking with customers isn’t your or your engineer’s day job.

The support engineer, account manager or whoever his day job is handling customers are the ones proficient in handling and communicating with customers. They will know how to get back to the customer and what to tell him. If needed, they will ask R&D to join a meeting with the customer or to write an email together. Since Rookout’s customers are engineers, it’s sometimes very tempting to send someone from R&D to talk with the customer (because we speak the same language, right?), but make sure you don’t send your engineers alone.

Whenever there is any doubt, there is no doubt

Since information is crucial to resolve the issue (or even understanding the issue), the information must be solid and concrete. Be doubtful, and don’t take anything for granted. No need to assume everybody is wrong, but when the behavior of your system is reflecting that the information isn’t right, dig deeper and re-ask questions. If some data needs to be collected again with more verbosity, then do it. Relying on false data will lead you into wild goose chases. If the customer tells you that his application is installed on a Linux machine and you observe that things are acting like on a Windows machine, then ask the customer to double-check it. Maybe someone changed something in the customer’s environment and they aren’t aware of it. If the customer tells you that they clicked on the “kebab menu” then maybe they got confused and actually clicked on the “hamburger button”. Simply ask the customer to “show me what you did” (because, let’s be real- we’ve all mixed up kebabs and hamburgers when hungry).

Choose your own battleground

Every minute the customer is talking with you, showing you things, or helping you to help him is time the customer has wasted. A cooperative customer is amazing, and debugging hands-on in the customer environment can often lead to a fast resolution. However, the customer’s time is precious and must not be wasted. Once you understand the issue and have all the information, go ahead and leave the customer alone and reproduce the problem in your own battleground (or playground, however, you call your dev environment). Additionally, fighting the battle in the customer’s playground leaves you without your own tools and freedom, as you are constrained by the customer and his environment.

Sometimes it is hard to reproduce the issue in a different environment (hey, that’s what we built Rookout for!), but if you need the customer to reproduce the issue, then get the customer to help you collect enough information to allow you to reproduce the problem. Understand exactly what the customer’s environment looks like, and try to mimic it. If the customer is having issues with your web app, then use the same browser and the same extensions they use. In other scenarios, sometimes you can also use the same public container images the customer uses. Don’t go blindly into the “reproduction game” and don’t be a ‘reenactor’ and commit yourself to it if you don’t have enough information. Keep in mind that you can’t reproduce without collecting all the information in advance.

Master the away game

If you haven’t managed to reproduce the issue, then you need to collect more data. Sometimes you’ll have to go through the cycle of collecting data, trying to reproduce with that data, understand that you need more data, collect more data and on and on. Make sure you have the right tools to collect the data. Remember that your customer’s time is precious, and you need to disturb him as minimally as possible. Telling them to upgrade so you can get information from more logs that you’ve just added can be quite a strain on the customer. Try to reduce friction with the customer as you progress by using the logs that you have, using your error reporting tool (Bugsnag or Sentry are my favorites), or collect whatever you need whenever you need it using Rookout (yeah, we also use Rookout to debug Rookout).

Fix the problem

It might sound like I’m stating the obvious. But seriously – make sure you fix the problem. Once you’ve found the root cause, fixing the issue for the customer might involve one of two paths. The first path can be a tactical solution. If the customer can refrain from encountering the issue by doing something different or changing a configuration, then go ahead and help them do just that (but don’t forget: document everything!). The second path can be the strategic solution of writing code to fix the bug. This tactical path can be chosen when either the strategic path will take too long to resolve or if the customer needs an immediate solution or is unable to upgrade or redeploy. The strategic path might not be taken immediately and might be prioritized later on by your product manager if the tactical path is acceptable. But if you expect other customers to face the issue – the strategic path is a no-brainer.

Make sure to follow through

Once you’ve decided how to handle and fix the issue, don’t forget where it all started. Everything began with the customer trying to do something and was unable to properly do it. You might have come a long way from that first time you’ve heard about that issue. Now, go ahead and take a look at what the customer reported. Make sure that everything works as the customer expects it to. Once you’ve made sure that you handled the issue, you can approach the customer (but remember, don’t go alone!) and ask the customer to verify that from their point of view, everything is resolved and they’re satisfied.

Solving customer issues makes your product better

The quality of your product depends on many factors, but what really pushes it forward are your customers. A product without customer issues is a product without customers. If your customers call you up and tell you about an issue they are experiencing, it means they love your product and want to use it. So give the love back to your customers and handle their issues as professionally as you can. Every time you handle and resolve an issue, your product improves, and ultimately, that helps me sleep more peacefully. 😉

Rookout Sandbox

No registration needed

Play Now

Table of Contents
Get the latest news

Lessons Learned When Building A Kubernetes Operator

Adi Ludmer | Senior Software Engineer

6 minutes

Table of Contents

As we see more customers adopting Rookout for debugging cloud-native applications, we are not surprised to learn that a significant number of them work in a microservice environment. In the most common case among these customers, each service has its own code repository maintained by the team who develops the service. And although deploying Rookout in a single microservice or application is as easy as adding a single line of code, we learned from our customers that managing Rookout’s configuration across so many repositories was shaping up to be an inconvenience.

So we decided to take a step back and think up ways to make life even sweeter for our customers, and to make managing a complex Rookout setup as easy as it should be. We wanted to make it possible to manage the setup in a declarative manner, as you would expect it to be done in a Kubernetes environment. And then the figurative lightbulb went off above our heads. We knew that all those services get deployed on the same Kubernetes cluster, so what if we could manage Rookout’s configuration from the cluster itself? And thus, the concept of implementing a Kubernetes Operator was born.

So, what’s an Operator?

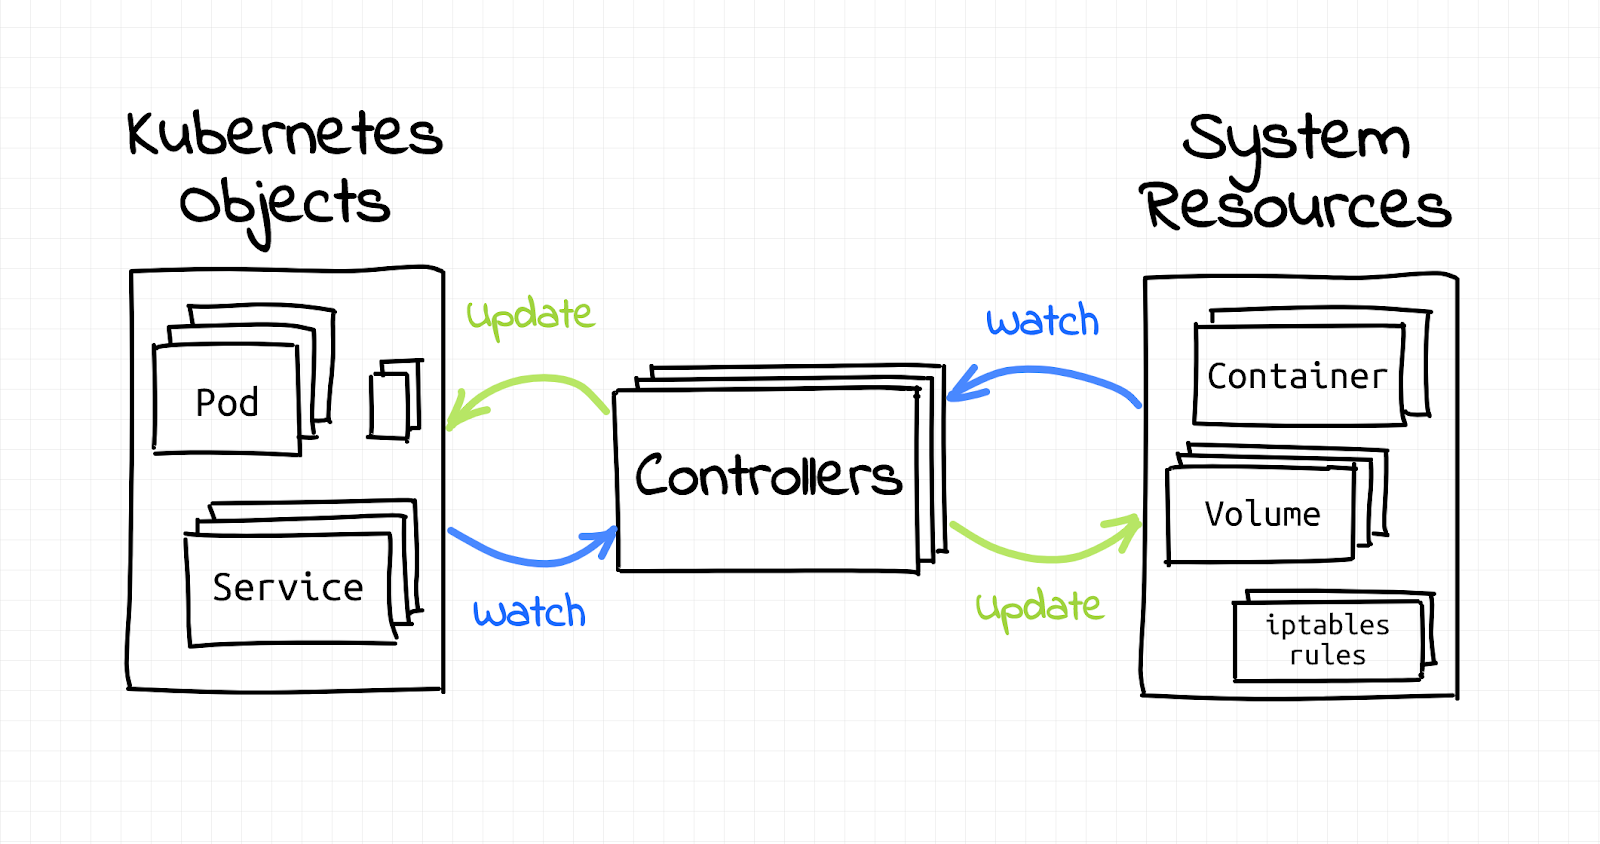
An Operator is a Kubernetes cluster core building block that is responsible for maintaining cluster resources such as deployments, pods, containers, or any other such resource that is able to be configured via kubernetes YAML objects and kubectl.

Whenever a developer runs `kubectl apply -f deployment.yaml`, there is always at least one, if not more, Operators that get notified about the changes that were requested and take care of them for you. For example when you request an SSL certificate in your deployment YAML file, there is an Operator in the cluster that listens to certificate requests, generates them, and then injects them to the relevant pods.

[Image source: Ivan’s blog post]


Operators are implemented as pods that run on their dedicated namespace and they have special permissions to apply changes on resources on other namespaces. Each Operator needs to be registered to at least one resource that it takes care of and asks for its specific permissions in order to manage it (but we’ll talk about that more further on, don’t worry!).

Why did we implement our own Operator?

Before we created the Rookout Operator, our deployment process in a Kubernetes cluster required updating each app that the developer would want to debug with Rookout. The modification included embedding Rookout by changing the container image or by modifying the deployment yamls of the app.

This modification process could be quite onerous for dev teams who have hundreds or thousands of apps in their organization. This would create an unfortunate situation for the DevOps engineer or the application developer who would need to go over each service and change its code in order to load Rookout with their custom labels. Said labels are required to allow developers and DevOps engineers to identify their apps on Rookout’s Web IDE, and before we created the Operator, they would need to repeat this process over again every time they would want to change those labels.

Implementing an Operator allowed us to load the Rookout SDK in a fully transparent way. Even better, we were able to do this with no code changes to the original application or its deployment yaml.

How does the Rookout Operator work?

The Rookout Operator is installed via helm or kubectl and its pod gets created in its own namespace.

It then registers itself to the following resources :

  1. Deployment – so it can apply the required changes on it to install the Rookout SDK
  2. Rookout Configuration – for configuring where and how to install Rookout

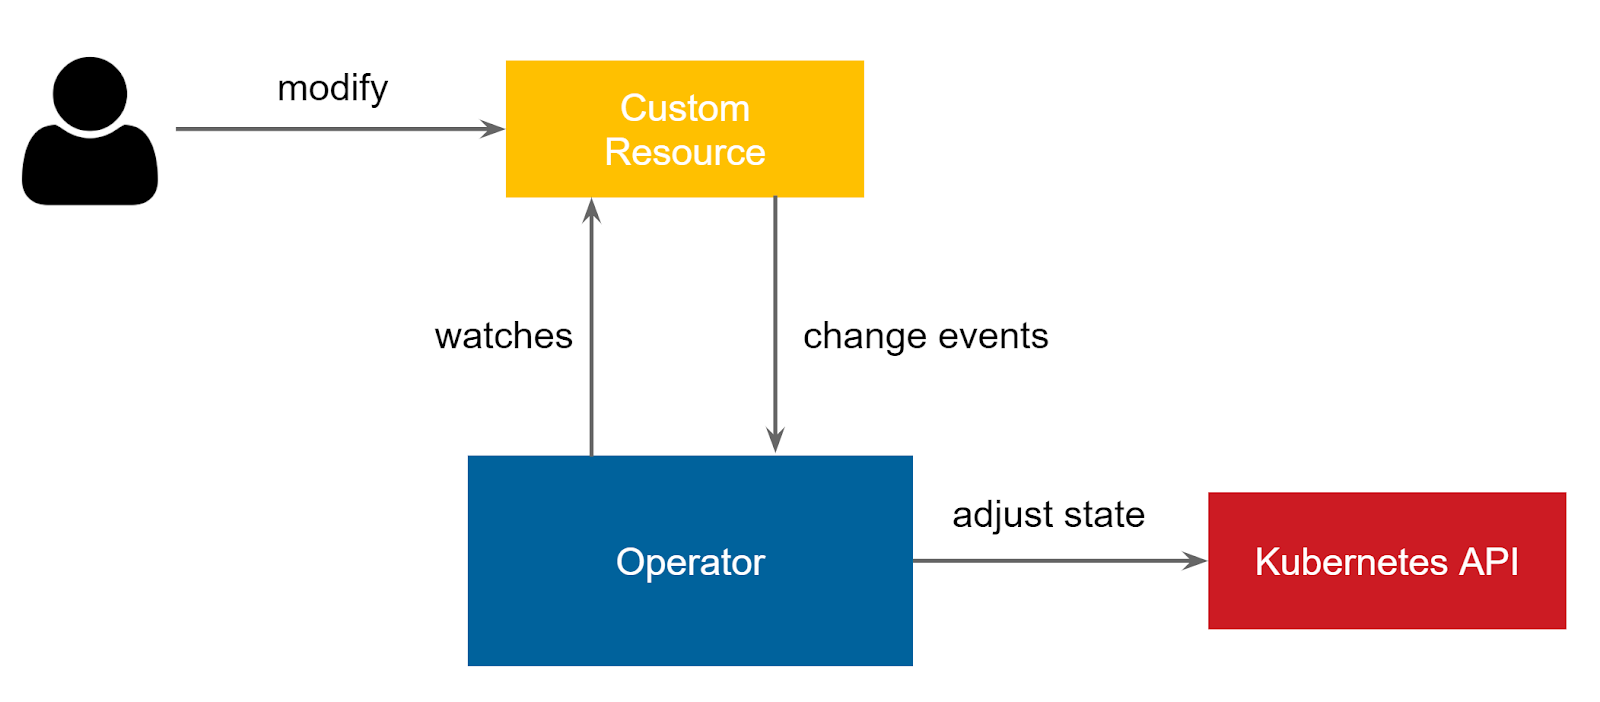
Next, the Operator waits for Rookout Configuration Resource to be added so it will have the configuration for deploying the Rookout SDK. Rookout configuration contains a list of matchers composed by a combination of deployment name, container name, and labels. Once the configuration is set, the Rookout Operator can start to patch deployment resources.

[Image source: openshift blog]

Every time a deployment is created, updated, or deleted, the Rookout Operator gets notified and has the ability to modify it. The modification is done the same way as we do it via `kubectl apply`, except that the Operator uses the Kubernetes API client directly (as a Go package) and does not depend on the kubectl binary.

How do we patch a deployment?

Initially, we add an init container that places Rookout SDK artifacts in a shared volume which is accessible to the other containers in the same pod.

Then, we add an environment variable to the relevant containers in the deployment which tells their JVM to load Rookout agent from the shared volume before the main java app starts.

Rookout patches deployment resources using the kubernetes client for Golang. You can take a look at our patching code in our public operator repo. In order to be able to patch deployments the operator needs to have the deployment:patch permission. We add this permission with a special annotation in the code.

This annotation tells the build process to generate the following RBAC yaml for the operator, which contains all the operator required permissions, and specifically deployments:PATCH for applying Rookout on requested deployments.

Let’s talk security

Operators are very powerful, as they have cluster wide permissions. When implementing an Operator, it’s necessary to pay a lot of attention – and ask permissions – for only the required resources and the required actions for those resources.

For example, if our operator asks for access to be notified when changes are made in deployment resources and for permission to then patch it, it will also ask to be notified of changes to Rookout Configuration resource.

That’s it – no less, no more.

Customize your Kubernetes cluster


The implementation of  Kubernetes Operators opens the gate to the world of Kubernetes internals. It might sound a bit scary at first, but once you get used to the concepts you’ll realize how much power your developers will have. And the best part? It’s all by simply adding your custom logic to a Kubernetes cluster and having the ability to share your own awesome logic with the entire community.

You can create operators that enforce custom security policies in your cluster and add support to new resource types like SQL/Document databases, which will behave as native Kubernetes components and will be configured in the same yamls you already use for your deployments. Sounds too good to be true, right? It’s not.

I hope this tutorial inspired you to start work on your own Kubernetes Operator and join this amazing ecosystem.

Rookout Sandbox

No registration needed

Play Now

Table of Contents
Get the latest news

Profiling Schrödinger’s Code

Dudi Cohen | VP R&D

7 minutes

Table of Contents

In modern software development and operations, everything can be monitored. This isn’t a matter of technology. If you want to monitor something, you can. However, modern monitoring tools come with a price, and while sometimes that price isn’t too high, at other times the cost can be unbearable. For example, an APM tool that monitors your server’s health with CPU and memory metrics is pretty cheap and non-intrusive. However, if you want to profile your application’s performance – more specifically, if you want to pin-point that piece of code that hits your performance – you will have to pay with your own application’s performance.

Isn’t that a bit paradoxal? To analyze and improve your own application’s performance, you will need to hit your application’s performance. But it isn’t only a paradox. That’s how modern code profiling tools work, by operating as an “all or nothing” solution. But that’s just silly, because that’s like using a 20 pound sledgehammer to screw a lightbulb. And while that might make for a great post on r/funny, it’s really not the path you want to be taking. The use of modern technology and the right code-monitoring tools can help you out with surgical precision.

Schrödinger’s code

Everybody who has studied a bit of physics, or who has seen enough cartoons in the recent decade, knows about Schrödinger’s cat. Simplifying this thought experiment would be describing a paradox about a cat, who’s inside a box, and who is considered both dead and alive at the same time. How can that be? Well, inside the box there is a flask of poison, and unless you open up the box and take a look, you won’t know whether the cat is dead or alive. But, if you open up the box it will tilt the flask of poison which will kill the cat. So, you can never know whether the cat is dead or alive and trying to look at the cat’s state will kill him anyways. The paradox essentially is this: the method that you use to monitor your subject affects your subject’s state.

Application profiling tools remind me of this paradox. If you want to understand what pieces of your code degrade your application’s performance, you must degrade your application’s performance. Profiling tools not only instrument every piece of your application’s code, but register every line hit and every function invocation and exit. The TL;DR? They monitor everything. And that makes everything slow.

Code profiling should be less painful

Let’s all be honest. Investigating performance issues is a nightmare and everybody hates doing it. The first pain in performance issues is the fact that you won’t notice them while developing, which means that of course you’ll create automation for stress testing your application, but it has its limits. You will find performance issues and fix them in dev or maybe even in staging, but that’s the easy stuff. Performance issues hit you hard when you least expect them… and that’s in production. Well, it’s not that you don’t expect them per se, but usually it’s when you’ve already moved on to the next task and it’s become but a mere memory. Once you hit those issues in production (or to be more precise: when they hit you or backstab you), you’ll have to solve them and it will usually be near impossible to reproduce them in dev. The performance will probably depend on multiple services in production, whether they are your own micro-services or even 3rd party SaaS. Sometimes it will be hard to even spin up those services in dev.

The next thing you’ll try to do is understand how to use a profiler in production. After that, you’ll try to understand how to explain to your manager (or customers) why you need to use a profiler in production and degrade the performance. You’ll tell your customers: “Please have some patience, I need to check whether my cat is dead, so I’ll just open up the box”. But they won’t like the aftermath, as they know that opening the box will kill the cat.

When “all or nothing” is not the only choice

When we meet with our customers, whether at an annual feedback session or when we finish a POC, we ask them what else they wish they had Rookout for. The magic of Rookout is that Rookout allows its user to understand that they don’t need to collect everything, but rather can collect only the pieces of information that they need. You don’t need to collect millions of logs in fear of missing out on some data, you can just collect the data when you need it. When our customers told us that they wanted Rookout to help them solve performance issues, we picked up the gauntlet and went to the drawing board. We decided that we want our customers to profile only the pieces of code that they want to profile. We wanted to address their pain and provide them with a tool that helps them understand whether their cat is dead or alive, but without killing it.

Code profiling points

Our goal was to give the user the capability to surgically profile their code, anywhere, anytime and without any performance degradation. We already had Rookout’s basic building block of instrumenting our customer’s code in real time, and that’s pretty much all we needed. Once our user wants to profile their code, all they need to do is activate the profiling mode in their Rookout dashboard.

The next step would be to locate the piece of code that they wish to profile, click on the gutter, and place two profiling points. From then on we will start measuring the time taken between them.

That’s it! So simple, so clean. You don’t need to instrument everything, you don’t need to kill your application, and the best part? You don’t need to kill your cat. You can go a step further and also start adapting and changing your profiling points, you can start measuring times while going down the stack. When you understand that the performance issue is in a certain area, you can start pinpointing the measurement to other small spans until you pinpoint your issue. You can also set conditions in which the measurement will take place. Maybe there is only one server or one type of request that needs to be profiled? All of this will happen in your production environment and it won’t degrade your entire environment’s performance.

Agile flame graphs

Being agile isn’t only about development, it’s also about how you solve problems and monitor your application. Modern software development roots for agile development by developing your software one step at a time, releasing each step, and learning from it before the next step is developed. We should also practice agile when solving problems. We don’t need to profile everything, as it will slow everything down and there won’t be any learning cycle. The right way is to start profiling in an agile manner, either from the bottom up or from the top down. If you start profiling from the bottom, you can start eliminating small methods which aren’t the root cause of your performance issues and then climb up to the root cause. If you start profiling from the top, you can understand the ballpark of the root cause and start surgically find the root cause by going down the call stack. Either way, you do it step by step, while learning from each iteration and profiling only the parts which are relevant to your investigation.

Don’t open the box, use a webcam

Telling the paradox of Schrödinger’s cat to a Gen Z (or a zoomer) will sometimes get you a chuckle and a simple answer of “Take a webcam and place it inside the box before you close it”. Well, Erwin Schrödinger devised the experiment in 1935 when webcams were quite hard to find. The next time you think about profiling your application in production, think about using Rookout: be kind, don’t kill cats.

Rookout Sandbox

No registration needed

Play Now

Table of Contents
Get the latest news

How To Keep Developers Moving Fast From The First Line Of Code To Production (And Beyond)

Oded Keret | VP of Product

8 minutes

Table of Contents

This blog post is a recap of a joint webinar featuring, and co-written by, Garden CEO Jon Edvald and Rookout head of product Oded Keret. It also appeared on the Garden blog.

You can find a full recording of the webinar here

Key takeaways:

  • Debugging in the world of microservices and Kubernetes can be painful, especially when it comes to reproducing an issue. 
  • Why? Because there are so many moving parts: differences between environments, configurations, and network behavior; environment-specific datasets; ever-shifting code versions; and more. 
  • Garden and Rookout offer a powerful combination that allows a developer to write code and test against their own production-like environment, quickly find the root cause of a problem when something breaks, redeploy and re-test a fix, then validate the fix across all environments. 

Troubleshooting customer issues in production is a difficult job. These are the issues that impact the business the most, so consequently, stress levels are almost always at a high. And it’s never fun to be measured against an SLA, which feels like you’re stuck in a losing battle.

And it’s especially hard in the world of microservices and Kubernetes, because it’s so difficult to recreate a reliable replica of production in your local development environment.

Indeed, when we ask users about the toughest challenge they face when actually solving production problems, the answer is almost always reproducing the issue.

Alas, “cannot reproduce” is one of the classic problems in software engineering, and sometimes we ask ourselves, how is this still a problem in today’s advanced, cloud native ecosystem? Well, because there are so many moving parts in modern applications, such as:

  • There are differences between the customer environment vs. testing environment vs. your local environment
  • The configuration and network are never the same
  • A customer’s production dataset might cause the bug, and you don’t have access to it
  • Code versions keep shifting, and every microservice has its own development cycle with teams pushing separately
  • The Kubernetes deployment itself varies and is hard to reproduce outside of production

So, how do you troubleshoot when the Kubernetes command line is limited in terms of what it can offer, you can’t deploy a production-like environment locally, and ssh-ing into a remote environment is out of the question? Most of our users turn to a couple of these tried-and-true tactics.

There’s logging and tracing, which requires spending a lot of time writing code that prints logs that you’ll need if anything goes wrong. This means that when a new problem comes along, you’ll need to add a logline, push it, wait for it to be pushed, then wait for the issue to be reproduced again before you can actually get the log of what happened. You’re already dreaming of the next coffee you’re going to drink in that long wait time, right?

And, if all else fails, there’s pushing to CI and praying that the thing you fixed happens to be the thing that was causing the problem. But we know that’s almost never the case.

Neither option is particularly helpful, and we believe there’s a better approach. That’s where Rookout and Garden come in.

What is Rookout?

Rookout is an application that makes debugging easy and accessible in any environment by allowing software engineers to handle the complexity of modern applications by seeing into their code in real-time, as it’s running.  Developers can debug a local environment running on their laptops or a very complex microservices environment running in the cloud or a customer’s environment.

Instrumenting Rookout in your application is a matter of adding the Rookout token as an environment variable or as a parameter in the code itself, and it’s a one-time change. And once that’s done, you have access to every application that’s been instrumented with Rookout. If you had the same application running in multiple environments (for example, in a test environment and in a customer environment), you’d also be able to filter and pick a specific environment.

Rookout uses a technology called Non-Breaking Breakpoints (you may have heard of similar technologies called logpoints or tracepoints). Basically, these let you set a breakpoint at a line of code and get data without stopping your application, which is critical—in a live, dynamic, cloud environment, you can’t just stop the code.

Rookout looks and feels like an IDE—you can see the source code for all of the different services in your application alongside data that helps you to debug. You have the benefit of seeing data at the code level without having to stop your code from running—which is something that you have to be able to do when debugging a live, microservices application.

What is Garden?

Garden is part Kubernetes development tool, part automation engine that builds, tests, and deploys your application. It allows you to fully define the relationships between every part of a system, including how each component is built and tested.

The aim is that for every developer or CI pipeline, you can just run a single command such as `garden deploy` or `garden test`(because tests are a native element in Garden) to spin up a production-like environment and run your full suite of tests, including integration tests.

One of the things that’s most important about Garden is something we call the Stack Graph. The Stack Graph visualizes all the different components in your system and all the steps involved in going from a bunch of source code, through build, through deployments, plus any add’l tasks that need to happen like seeding a database, all the way down to tests—which could be unit tests that have no runtime dependencies but also integration and end-to-end tests that actually need running instances of your stack.

With Garden, you have a framework and toolkit to reason about your whole system, deploy it all in a consistent manner, and deploy a full environment where you can run tests while you code. These environments are as production-like as you can get, way more so than running docker-compose or using homegrown set of bash scripts

Another key aspect of Garden, especially with Kubernetes, you can run `garden deploy` and point it at a remote Kubernetes cluster, but it’ll feel like you’re working in a local environment.

Garden and Rookout: A Better Dev and Debugging Workflow

Editor’s note: in this blog post, we’re going to describe at a high level how Garden and Rookout complement each other during the development process. If you’d like a much more detailed overview, including a demo that shows the two products working side-by-side, please take a look at the webinar recording.

Given what we know about Garden and Rookout, here’s what an end-to-end development and debugging process might look like with the two products.

  1. A developer uses Garden to spin up a production-like environment for coding and running tests. It only takes one command to spin up the environment and ensure that the most up-to-date version of every service has been built and tested, and the Stack Graph provides a visual representation of the entire stack. It’s easy to point this environment at a remote Kubernetes cluster, so the developer doesn’t actually have to have Docker and Kubernetes running on their laptop and can still use the IDE and other tools of their choice.
  2. The developer runs the full suite of integration tests while coding, and one of the tests fails. It’s easy to pinpoint which test failed in Garden (and the Stack Graph visualizes it), but we don’t get a lot of insight about what went wrong. So what are our options to figure out what’s causing the test to fail? We could go put in a bunch of console logs. Or we could look at the test code. Or bend over backwards to try and somehow attach a debugger to a process that’s running in a remote Kubernetes cluster, but we all know that’s far from a delightful experience.
  3. Luckily, Rookout is already instrumented in our application, so we have a much better option for debugging. We can get to the root cause without shutting down our environment and (gasp!) without adding loglines and redeploying. Within a few minutes, we’ve been able to identify our issue and have all the context we need to fix it (or assign it to the responsible developer).
  4. Once the issue is fixed, we can redeploy and re-test our app with Garden. Again, we can run the full suite of tests directly from our development environment and get fairly fast feedback—we don’t have to push to CI and wait just to be able to run integration tests. And this time around, all of our tests pass. It’s looking promising!
  5. Rookout lets us validate the change across all environments to be sure the bug was actually fixed. Rookout is especially well-suited for validating fixes in a complex Kubernetes environment, including in production.

Because all the deploys and builds in Garden happen within a Kubernetes cluster, it’s something that can easily be shared across developers who are working on a problem together.  Same goes for Rookout—each dev can have their own instance running. This collaborative aspect is pretty impressive.

Wrapping up and next steps

If you’d like to have a deeper look on what we covered in this post, we recommend you head on over to the webinar recording.

If you want to see how Rookout can help speed up your developers’ Kubernetes debugging processes and ultimately help you solve customer issues 5x faster (imagine how much more time for coffee you’d have), explore our site or get in touch to see how we can mke that magic happen for you. 😉

Rookout Sandbox

No registration needed

Play Now

Table of Contents
Get the latest news

Non-Breaking Breakpoints: The Evolution Of Debugging

Noa Goldman | Senior Product Manager

7 minutes

Table of Contents

Since the beginning of time, back to before humans invented fire, there were two traditional ways to debug applications: one way -after having invented hieroglyphics, of course – was by reading log lines and the other was by using the common debuggers that surrounded a cave dev’s cave.

It’s safe to say that society has progressed since then and, luckily, so too has traditional debugging. To get a clear understanding of how much we R&D team members have evolved, we’ll have to go back in time for a little while to see what it meant to debug traditionally.   

Writing the logs on your cave walls

Let’s review the most prehistoric of debugging methods: logging. The prehistoric developer did this by adding log statements in key paths of the code. Then these logs were printed to a local file or a remote logging server in a distant cave. After, the issue had to be reproduced in the application itself so that the log lines would be printed according to the relevant bug they were trying to fix.

Thankfully, the process of debugging with logs has evolved. In recent years, debugging with logs has grown and matured into what we now call ‘tracing’, in which context has been added to log statements in order to allow developers to analyze the behavior of complex, cloud-native, service-based systems.

Log debugging, especially when used nowadays, has many advantages. The most important one is that the application continues to run as it is without having to stop. When working with cloud-native, distributed systems, logging works well.

However, debugging using logs comes with a few disadvantages. The first is that the logs themselves have to be printed, and as such it isn’t always easy to read through them and understand what they mean, even for the developer who originally wrote them. And this is made even worse by what has been dubbed ‘Logging FOMO’, which is the need a developer feels to add log lines anywhere and everywhere, in the hopes that doing so will give them more insight into their code. The second major disadvantage is the fact that in order to add logs and be able to get the information, lines of code have to be added. It’s not just about writing new code, it’s also about having to wait for the new code to be deployed in order to see the new logs.

And, to add salt into an open wound, the overhead for printing the logs and the storage costs for storing them are significant. Suffice to say, the difficulties of log writing today are unavoidable.

We invented the wheel and an IDE

Now that you know all about debugging with logs, let’s continue with our debugging overview and introduce you to: The Traditional Debugger. 

At this point, we’ve jumped way beyond caveman years. With society’s evolution, the traditional debugger was introduced. You modern devs may know what it is, but for those of you who are still stuck in prehistoric times, it’s a debugging tool that allows developers to run the application in a visual debugger, sometimes as part of an IDE, where the code is also written, edited, and version controlled. The visual debugger has breakpoints, snapshot view, intellisense, and other such pretty visual enhancements.

However, much like debugging using log lines, or discovering that there’s a lion outside your cave, there are disadvantages here as well. A major challenge when using a debugger is that the application has to run in debug mode. Usually, this means stopping your applications, which means you’re not really reproducing the behavior of a multi-threaded, multi-service, or cloud-native distributed system. Another significant challenge is that it’s difficult to practice debugging when using remote servers. Attach to process challenges are definitely something to consider when using a debugger.

Less time fixing bugs, more time to for coffee

Lucky for us, in our modern society, alongside inventions such as iced coffee and Zoom calls, new debugging solutions were introduced to the world. These are solutions that attempt to generate a best-of-breed approach, by mixing the two approaches above to get the best of both worlds.

These tools allow managers to enhance their team’s debugging process, reduce overhead costs, and save time and money. For developers, these tools means spending a great deal less time on bug fixing (which can be extremely frustrating at the best of times) by allowing them to, well, log less.

Let’s look at the future called Non-Breaking Breakpoints together and examine what it means and why these tools are necessary in modern times.

So, What Are Debugging Non-Breaking Breakpoints?

Tools that offer tracepoints, log points, snappoints or Non-Breaking Breakpoints are all tools that are offering methods for modern debugging. Modern debugging provides an easy way to investigate issues using relevant data. The use of modern debuggers allows developers to keep searching for proper bug solutions without having to stop the application from running. These tools usually offer a visual, code-focused interface, where fetching the additional data is done simply by clicking on the relevant line of code.

Such tools allow both developers who know each line of their code and managers who are not as familiar with it to dynamically add a data collection point that once hit will send a log line, trace line, or full snapshot of all local variables, stack trace, and much more.

This modern debugging implementation makes the traditional practice of log debugging and step-by-step debugging possible in several cases which were considered impossible before, such as:

  • Debugging live applications in production environments. In prehistoric days, debugging step by step was only available in your local machine and it was almost impossible to reproduce production environments locally. Today, modern debugging tools set up new trends and allow both managers and devs to debug production environments remotely, without the fear of affecting active users and having to wait for specific timing.
  • Debugging distributed, cloud-native deployments such as Kubernetes, Lambda, and others. The primitive developer had to deploy locally in order to debug the code that was running in his village’s local Cloud. Thanks to the new debugging tools, the modern dev can debug in a way that wasn’t possible before, by debugging applications that are running on distributed, cloud-native platforms, and without having to deploy locally.

Back to the future of debugging

Now that we’ve crawled out of our caves and into the future let’s understand how modern debugging tools actually work. In this day and age, modern debugging allows users to fetch snapshots from any desired location in the code. These snapshots are being fetched by placing things called: tracepoints, log points, or Non-Breaking Breakpoints.

A Non-Breaking Breakpoint can be set in any line of code, remotely, in any desired environment, and at any time. Once it is set, the Non-Breaking Breakpoint is able to fetch data, messages, or snapshots, which include all local variables being collected from the application in that specific location in the code. It has no effect on the running application or its performance and includes a protection mechanism to make sure there are no overheads while data is being fetched.

Changes are scary. Modern times can bring a lot of uncertainties and confusion. I mean, no one thought that the cronut would actually be tasty back in the day, remember? But don’t worry. Using the new technology of modern debugging is much easier than inventing fire. Don’t believe me? Setting Non-Breaking Breakpoints is so fast and easy, here’s all that needs to be done:

  1.  Attach the correct SDK to your code. It’s a one-liner that, when added in, will allow data to be fetched instantly, remotely, and at any time.
  2. Once the SDK is installed and the IDE is open with the current repository of the running application, you simply set a Non-Breaking Breakpoint and make sure the running application will execute that chosen line. Once it’s done – snapshots will be coming right at you. Easier than inventing fire, right?

New technology can be scary sometimes and you may think that what you’ve been working with so far is enough. And maybe it is, but why put in the extra work when there are tools and technologies out there that will make your life so much easier? Why continue to stay a cave dev, when you can be a modern dev? Embrace change and move forward. And if you don’t do it for the sake of your tech, do it for that extra coffee time you’ll be freeing up.

Rookout Sandbox

No registration needed

Play Now

Table of Contents
Get the latest news

Why You Should Care About The Financial Benefit Of A Developer Tool

Elinor Swery | Director of Solution Architecture & Partnerships

7 minutes

Table of Contents

You wouldn’t expect an architect to build a skyscraper with just a hammer and a ladder, right? Then why do we sometimes look at developer tools as something ‘extra’, or as a ‘nice to have’, and simply assume that all that a developer needs is a laptop and an internet connection? A skyscraper is built in a fraction of the time and to a much higher quality if the team has access to top of the line equipment. Similarly a development team with the right set of tools can achieve far greater results, ultimately contributing to significant financial benefits.

Giving people the right tools to do their job effectively is a well known concept and is something that is continuously refined in many different industries and professions. It is the main theme around Goldratt’s Theory of Constraints. If you identify that people are the critical resource in your operation, by giving them the right tools to do their job more effectively, the company will see direct (and increasing) benefits to its operations and its ability to create an output more efficiently. Often we see that developers are the critical resource in tech companies; they are constantly in a shortage, hiring is oftentimes difficult, and they are a significant portion of the overall operation expenses. But don’t despair! That’s why we will focus here on how to remove some of the constraints through the use of developer tools and the ultimate financial benefit that this will give you. You’re welcome 😉

Developer Tools- the how, the what, the why

Developer tools include software, platforms, and add ons that enable developers to do their jobs better by enabling them to write high-quality code more efficiently, while also enjoying the process. They are tools that remove friction, distractions, and context switching. These may include tools that enable more effective communication between teammates, enable better task and project management, support knowledge and information sharing, code base management, as well as compile, build, and monitoring tools.

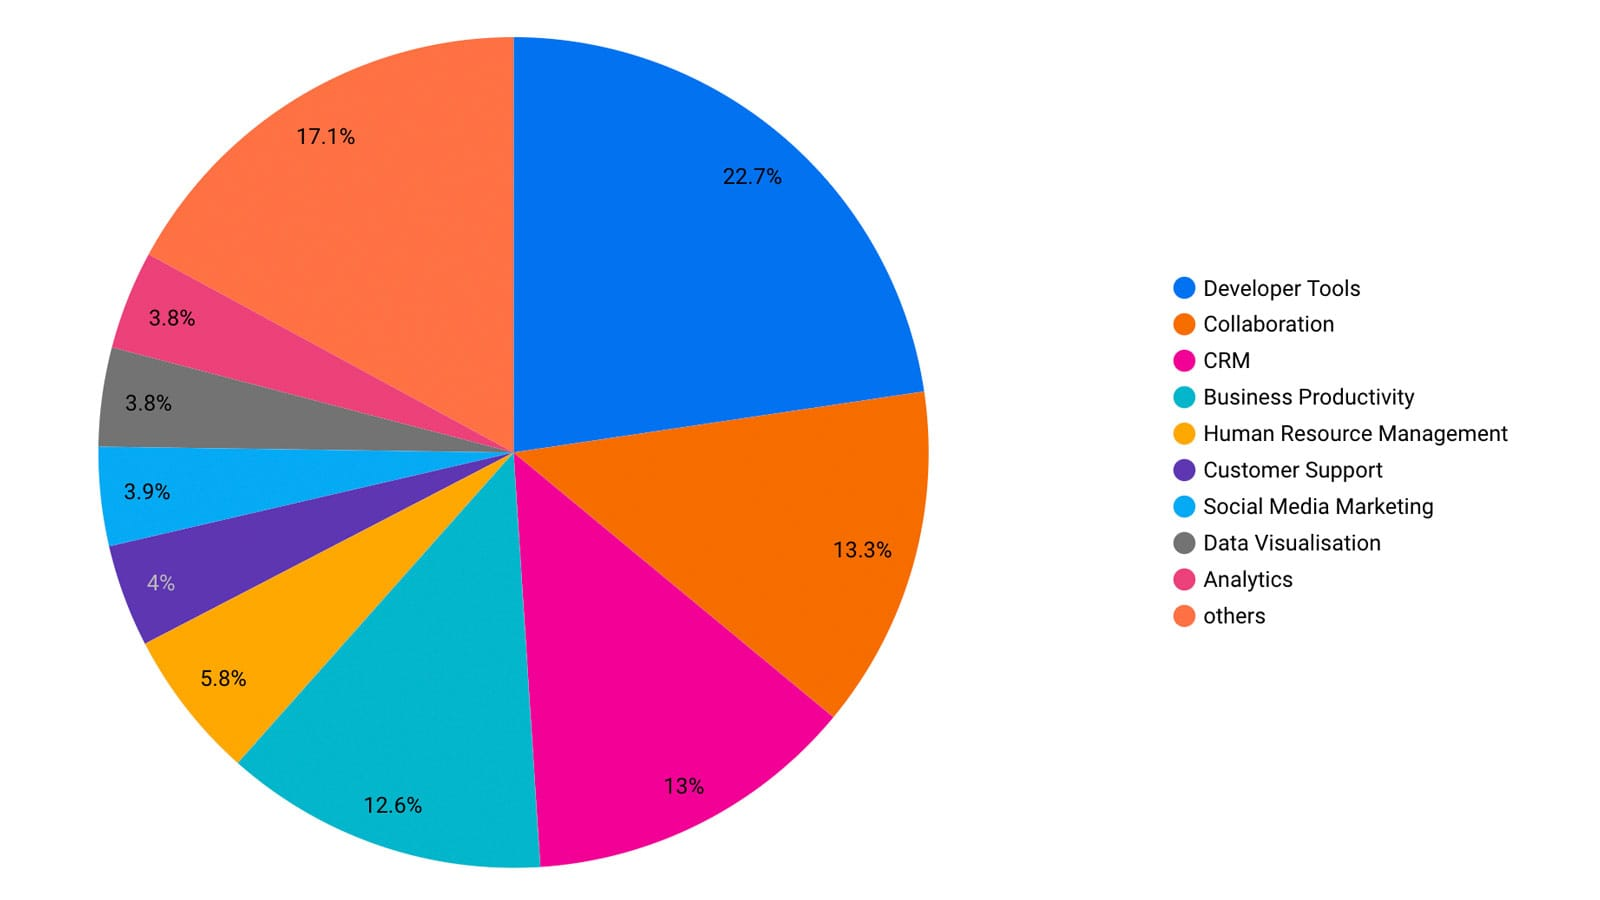
As the software industry grows and the demand for developers increases, so too has the awareness of the benefits of developer tools. As a result, companies have become more receptive to spend on apps that boost productivity, improve code quality and save time. This is reflected in the continuous growth of the enterprise software category, which is expected to be worth $636 billion by 2023. These spendings are significant. Take Atlassian for example, the company behind Jira and confluence; in 2020 they recorded revenues of $1.6B and Twilio recorded revenues of $1.1B in 2019. Research has also shown that a significant portion of a company’s software budget is oftentimes spent on developer tools; 22.7% compared to 13% which is spent on customer management.

Distribution of tech start-ups spending of software budget (aggregated by Cledara)

It’s easy to see why developers tools have created so many large businesses; developer tools are big business. The math is easy: if a tool helps you save you valuable engineering time, you get direct cost savings (or alternatively you can use your time savings to work on the next set of features). Similarly, any tool that helps you improve the quality of your code, reduce downtime and ensure that your product is performing to its highest quality will mean that your clients will be even happier and bring their friends along too (and that means even more business!).

So now that we’ve thrown enough stats at you to prove our point, let’s take a deeper look into just how different types of developer tools really do bring a financial benefit to your organization.

Code Editors

When a developer uses a suitable editor (instead of a basic text editor) they can leverage a myriad of features, such as syntax highlighting, code completion, snippets, code refactoring, source code navigation, etc. Each of these has a direct benefit on the time spent writing code, as well as the end quality, with clear financial benefits to the company. Focusing on the most basic feature, syntax highlighting, a study has found that the presence of syntax highlighting significantly reduces the time taken for a programmer to internalise the semantics of a program. Saving just 5% of a developer’s time spent on writing code with a simple tool seems like a no-brainer to implementing in order to gain financial benefits for your company.

Build Automation Software

Scripting or automating the process of compiling computer source code into binary code effectively reduces the time needed to be spent by developers on manual and repetitive tasks. More importantly, having tools to complete this quickly ensures that developers focus on the task at hand. Even if compiling takes just 15 seconds, programmers will get bored and switch over to something else. It could be another task, in which case the cost of context switching or lack of focus would add up, or worse, they might switch over to ‘quickly’ reading The Onion or Reddit forums which will suck them in and kill hours of productivity. Reducing this “downtime” in productivity will save time wasted in multipliers.

Build automation only scrapes the surface when it comes to the pipeline that could be automated. By leveraging tools that focus on automated testing, release management, and repository management even more time could be saved, creating a more efficient workflow.

Debugging tools

In the US alone, $113B is spent annually on identifying and fixing product defects. Debugging tools help reduce this, but more importantly, help decrease customer downtime, which oftentimes is more expensive than development resources. Take Amazon’s one hour downtime on Prime Day in 2018; it is estimated that it may have cost them up to $100 million in lost sales. How much would your company lose if it had a bug in the customer-facing product? And if a proper tool meant that the likelihood of the problem arising was decreased (and your time to resolve it decreased too), would you invest in it?

8 Tools Every Java Developer Should Know (& Love) - Stormpath User Identity API

How do you actually do it?

It’s often best to start with the tool targeting the biggest pain point in your organization. Focus on your constraints and your biggest blockers and find the tool that will help you work more efficiently in that aspect. Start with that tool and once you see the benefits rolling in, move onto the next tool. Adopting a new tool is not always straightforward. Not only will you need to get the team to start learning how to use a new tool (and get used to a new interface), it will often also impact the way in which they approach tasks. Shifting habits isn’t trivial.

What often works best is that if tools aren’t forced onto developers – rather the benefits are shown clearly and the developers understand how they will improve their day-to-day job and choose to use it on their own accord. A good way to get developers involved is to get them to be a part of a tool evaluation period – get their feedback and get them involved in the decision making process and adoption plan.

Go on. Save those $$$

As dev managers ourselves, and with a product that’s geared towards increasing developer productivity, we’ve seen this cost benefit analysis been carried out time and time again. We know that bringing in new tools and workflows isn’t always easy, and often the financial (or any type of) benefit is hard to see from the get-go. So that’s why we did the legwork for you- to show you that it IS worth it.

So what are you waiting for? Whether you choose better debugging tools – like ourselves, that helps your devs debug on the fly, without stopping, writing new code, or redeploying- better code editors, or something else entirely: the time is now! Start saving. Trust me. Make that leap.

Rookout Sandbox

No registration needed

Play Now

Kubernetes and Debugging
Table of Contents
Get the latest news

Kubernetes Dev Tools in 2021: Development Machines (Part 5)

Liran Haimovitch | Co-Founder & CTO

5 minutes

Kubernetes and Debugging
Table of Contents

Over the last year, we have witnessed a shift in engineering working habits. COVID-19 forced many of us into lockdown. Instead of working from the office, coffee shops, and airport lounges, I found myself mostly working out of my (hastily built) home office. For many of us, this meant shifting back to a workstation over a trusty laptop.

Not surprisingly, this did nothing to abate the heated discussion over which computers and operating systems are best for developing software. And so, in this final blog post of the series, you’ll get to learn a bit more about setting up your development machine.

Computer

First things first, you need to pick your computer. You have to choose between countless hardware models, but only three major operating systems – macOS, Windows, and Linux.

Over the last decade, Macs have steadily risen in popularity with software engineers. macOS is part of the Unix family of operating systems and will provide a good approximation of the Linux distributions you will be running in production. More importantly, with most of the open-source community working on Macs, you will probably find it’s the most comfortable platform to utilize open-source software.

Microsoft has been investing heavily in cloud and cloud-native computing and has put a lot of work into their operating system as well. While not valid for every open-source project out there, you can expect all the critical Kubernetes tooling to work flawlessly with Windows. When working with Windows, you will probably find WSL 2 useful for when you end up needing a Linux machine.

And, last but most definitely not least, you can eschew away with all the emulations and just get a Linux desktop distribution for your development machine. Linux has many popular desktop distributions, and all of them will be closer to what will happen in production. Additionally, they all have built-in package managers and terminals, which you will have to add to Windows or Mac.

If adopting every open-source tool is out there is a priority, or if you are an Apple fan, you should go with Mac. PCs with Windows are the most versatile, enabling additional activities such as gaming. PCs with Linux offer limitless options and customizations, as well as a pure open-source approach.

Terminal

Most of the tooling for Kubernetes is CLI based. So for Operating Systems that don’t have (a good) one built in, you better set one up on your development machine. For macOS, iTerm2 is the reigning king, and you should get YADR or ohmyzsh to customize it to perfection. For Windows, check out the new Windows terminal. It even allows you WSL shells in the same window with the command line and PowerShell.

Along the way, don’t forget to pick up Homebrew for Mac or Chocolatey for Windows.

Containers

Occasionally, you will want to build and run containers directly in your development environment. The obvious choice here is Docker Desktop that is easy to install and has everything you need. As a bonus, you even get (an admittedly resource-hungry) Kubernetes deployment you can turn on and off at will.

Tools

When it comes to Kubernetes tooling, kubectl is not the most important one in my book. Kubernetes is all about declarative configuration, which usually ends up stored in Git repositories. And so GitOps has become synonymous with cloud-native computing, and you will spend much of your time working with the Git CLI. If you happen to be using Github, you might want to check out their official CLI as well.

For working with Kubernetes itself, you will probably want kubectl (which is bundled with the latest versions of Docker Desktop), as well as Helm, and maybe even Kustomize. You can read more about them and the differences between them here.

Don’t forget to install your cloud provider’s CLI: AWS, Azure, GCP, Digital Ocean, etc…

Coding

When it comes to coding, a great IDE is priceless. The two most popular IDEs are Visual Studio Code (free) and JetBrains (paid). Both of them have significant Kubernetes support via plugins, and you can read more about them here. Of course, there are many more IDEs out there, such as Atom or Sublime.

As you are coding your way through Kubernetes, you need some way to view your cluster(s) live status. Here, my recommendations are k9s for CLI fans and Lens for those looking for a more IDE-like experience. But why choose when you can have both?

Summary

Selecting and setting up a development machine for your Kubernetes is not so different from how you would do it for any other environment. There are, however, a handful of extra tools you will want at your disposal to work within the ecosystem and its open-source projects to the best effect.

Over this five pieces series, we have gone through an up-to-date review of developer tooling for the Kubernetes ecosystem. I hope you enjoyed and learned as much reading it as I have when writing it. If you have any questions or other topics you would like me to cover, please feel free to contact me.

If you are interested in cloud-native developing tooling and have read this far, one small request before you go. Check out Rookout. You won’t regret it.

Check out the full Tools For Kubernetes Series:

Part 1: Helm, Kustomize & Skaffold

Part 2: Skaffold, Tilt & Garden

Part 3: Lens, VSCode, IntelliJ & Gitpod 

Part 4: Docker, BuildKit, Buildpacks, Jib & Kaniko


Rookout Sandbox

No registration needed

Play Now

Table of Contents
Get the latest news

Developer Tools for Kubernetes in 2021: Docker, Kaniko, Buildpack & Jib (Part 4)

Liran Haimovitch | Co-Founder & CTO

5 minutes

Table of Contents

Over the last few blog posts, I have covered critical elements of developer tooling for Kubernetes and how things are looking in 2021. As we continue to dive into that discussion, we must not forget the process of building container images.

Of course, most of us create our images by writing Dockerfiles and building them with the Docker engine. And yet, more and more teams are adopting newer alternatives. After all, the Docker image format has been standardized as part of the OCI (Open Container Initiative) a long while ago.

In this blog post, I’ll be covering updates to the Docker engine, including BuildKit and Buildx (the CNCF Buildpacks project) and a few Google open-source alternatives such as Kaniko and Jib.

As you read through this post, it’s essential to keep in mind the distinction between the two main elements used to build a container image. The first element is the format we use to specify the container image – for instance, a Dockerfile. The second element is the engine we use to build the container image – for example, the Docker engine. Some of the tools we’ll cover in this post focus on only one of those elements, while others offer both.

Docker

Since selling off its enterprise business to Mirantis, Docker has been focused on developer tooling around containers, first and foremost the Docker Desktop application. In late 2020 Docker released their 2.4.0.0 version of the application, which (finally!) migrated the image building experience to the BuildKit, which had up until then been an experimental project.

Some of the highlights of the BuildKit engine for us as Docker end-users include:

  1. Faster build performance.
  2. Remote caching of build steps. Caching happens in the form of image layers.
  3. Two new CLI flags added: –secret and –ssh.

If you are looking to dive even deeper into BuildKit and its advanced features to optimize build processes performance and security, you should check the Docker CLI build plugin.

The container images we are building using Docker are specified using Dockerfiles. The Dockerfile format offers a straightforward and procedural approach to image building. It has a relatively gentle learning curve, easy to get started with, and not too tricky to master. The Docker multi-stage builds (which have been available since 2017) provided us with even more granular control to separate the temporary build and test images from the final runtime image. Using a multi-stage Dockerfile, we can use a plethora of minimal runtime images such as distroless.

Buildpacks

Buildpacks (not to be confused with BuildKit) is a CNCF project bringing a more structured image building approach. This additional structure brings with it a better separation of concerns, but unfortunately results in additional complexity.

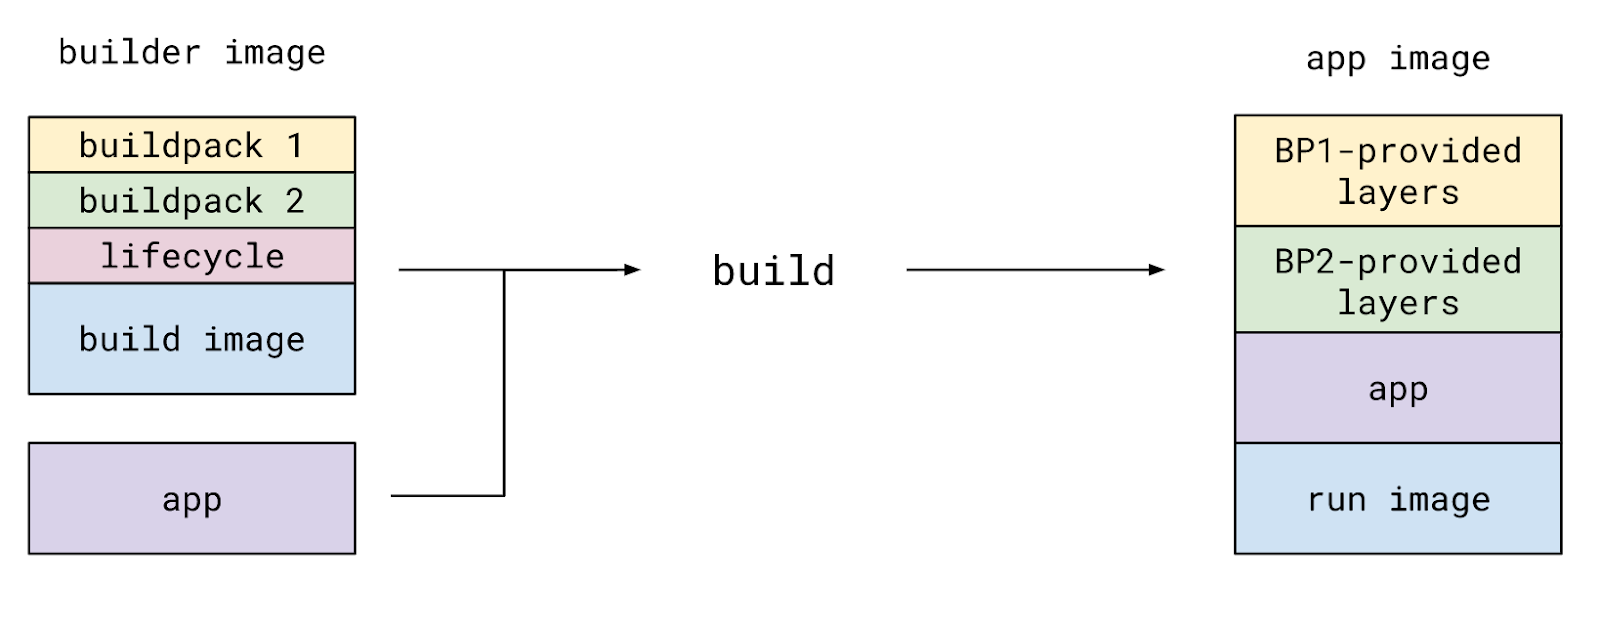
You can think of the Buildpack as a two-stage Dockerfile. You start by selecting the base image for the first stage, known as the build image in Buildpacks. You then choose one or more build and configuration tools such as Maven or Webpack to build your application, known as buildpacks. Finally, you select the base image for the second stage Dockerfile, known as the run image.

During the build process, the Buildpack engine spins up the build image in a container, executes the relevant buildpacks one by one, and then overlays their outputs on top of the run image, creating a ready-to-use application image. Here’s what it looks like on the Buildpacks’ official docs:

This structured separation of concerns has several benefits, some of which are:

  1. The organization can define a set of applicable build images, buildpacks, and run images. Each of those can be defined and maintained separately.
  2. This modular design enables the reusability of components, both within the organization and the open-source community.
  3. The application image operating system and runtime environment can change without rebuilding the image. This operation is known as a rebase.

If this separation of concerns is a high priority for your team, I recommend checking out buildpacks (please note the pack CLI depends on Docker). As for the rest of us, we might want to wait for this promising project to become a bit easier to use.

Jib

If you are a JVM developer and a structured build process for your container application has caught your attention, Jib might be just up your alley. This Google open source project offers Gradle and Maven plugins to build container images from your favorite build tools. As a bonus, Jib is self-contained and does not require the Docker engine.

For a similar but language-agnostic approach, check out Bazel’s rules for building container images.

Docker-Free Building

At the very end of 2020, the Kubernetes team has deprecated Docker as a container runtime in favor of other container runtimes. For most of us mere mortals, as users of the Kubernetes ecosystem, this does not have any implications.

You might be thinking of leaving Docker behind as well. Maybe the client-daemon architecture doesn’t work well in your use-case, or perhaps you need better rootless support. If that’s the case, then there are a few alternatives to check out.

If you are looking to run your container builder within a container, you should take a look at

Kaniko, This open-source project by Google offers a pre-built container image used to build new container images. Google originally developed Kaniko to run in a Kubernetes cluster, but you can deploy it to Docker and other container environments as well.

If you are a Linux user, you can check out Podman, an open-source daemonless container engine. Podman aims to be fully compatible with Docker, or as they like to put it, alias docker=podman.

Summary

As for software engineers working in the Kubernetes ecosystem, our work products are container images more often than not. And while those images are a great way to ship software (if you haven’t done so, check out Solomon Hykes’ fantastic talk), building high-quality images is a non-trivial task.

And yet, we don’t always want every team member to become a Docker and Linux expert, understanding the intricacies of building those production-grade images. The challenge is even more significant in larger organizations, where different stakeholders are in charge of defending and enforcing various policies regarding security, performance, and standardization.

Maybe in 2021, we’ll finally see the structured approaches to container building mature, providing a comparable, or even better, user experience to the traditional Dockerfile.

Check out the full Tools For Kubernetes Series:

Part 1: Helm, Kustomize & Skaffold

Part 2: Skaffold, Tilt & Garden

Part 3: Lens, VSCode, IntelliJ & Gitpod 

Part 5: Development Machines

Rookout Sandbox

No registration needed

Play Now

Table of Contents
Get the latest news

Rainy Day Reads

Maor Rudick

2 minutes

Table of Contents

Not to steal the Stark family slogan, but “winter is coming”. Or rather- winter is here. And with winter, comes weather that makes us all want to burrito ourselves in our blankets, grab a steaming cup of coffee, and just veg. We’re all for that. 

Whether the view outside your window is pearly white or washed-out greys- snuggle right in because we’ve put together some of our best winter weather reads for you. So tear yourself away from the feeling that you missed a log line or maybe you need to rewrite some code and make yourself a steaming mug of coffee (or hot cocoa, we’re not here to judge). Because really, there’s nothing better than hearing the rain ping on your window, reading about optimizing dev workflows, and knowing that you have nowhere to be than right where you are, right? 

Here are our top five rainy day reads, for your perusing pleasure:

  1. Jenkins and Kubernetes: the perfect pair

Why run Jenkins on Kubernetes, you ask? Easy answer: because it helps you gain a smooth deployment experience. Here are some insights on how to do so yourself and what we learned while doing so.

  1. Developer tooling for Kubernetes in 2021

As all developers know, working with Kubernetes can be challenging. That’s why we’ve put together insights and reviews into the best tools out there – and the most up-to-date ones! – to use when doing so. FYI- it’s a series, so don’t miss out on all four parts!

  1. Remote debugging

The rise of new software techniques, such as microservices and cloud-native, has not only changed the way we write code, but also the way we debug it. Classic debugging is no longer yielding the same results and the time has come to eradicate the headaches and frustration of using a method that simply isn’t working. Enter: remote debugging. Here’s everything you need to know to get your own remote debugging a smooth-rolling machine. 

  1. Understandability

The more software grows and develops, the less ability that developers have to understand what is happening within it. But it doesn’t have to be this way. That’s why you need to make sure your team has software understandability. But what is software understandability, really? And how do you achieve it? Read to find out!

  1. The journey to debugging other people’s code

Ever struggled with third-party code and thought to yourself, “damn, I wish I just had X-ray vision to understand this”. Well, you asked. We delivered. Gain some x-ray vision for yourself here 😉

Rookout Sandbox

No registration needed

Play Now